EURJPYEURJPY is trading in bullish parallel channel, and created Head and Shoulder pattern at strong resistance area. And a massive sell rally break the neckline of HnS pattern. any successful retest of broken level will be nice option to sell.
if the sell pressure continues, the next target could be the back to lows at 156.50 region.
What you guys think of this idea ?
Head_and_shoulder

Bullish reversed Head & Shoulders on VIXThe VIX seems to have validated a bullish pattern, the reversed Head & Shoulders with a target around 27 and intermediate resistance with the line linking the tops near 24.
Only a break below the shoulders level around 15 would invalidate this view.

🔥 FTM Head & Shoulders: Peaking Into The AbyssFTM has been one of my favorite tokens during the bull-run, but has lost nearly all of its value over the last two years. In its current state, it's one of the weakest big alts.
In my eyes, there's potential for more bearish price action in the future. I think that FTM can fall as far as 0.03 USD. Consequently, this would be my ideal area to step in for a long-term position.
I'm waiting until the price closes below the neck-line of the pattern before making an entry.

Dr copper potential more downside moveHello traders, lets take a look at copper which testing an important resistance area and see what can possibly happen and what are the consequences of possible bearish move in other markets like us equities.
first lets talk technical, price overall bearish Daily move in copper formed a standard #head_and_shoulder pattern in form of consolidation in downtrend move and as we know this chart pattern in the middle of a move showing continuation. As it can be seen price formed clear H&S pattern and now forming possible LH at key resistance area below Daily EMA and at the 4H timeframe 200 EMA. more importantly price failed to close above 3.80$ in the past 3 days.
Also we know that copper as one of the most important commodities is very sensitive on economic data, and since central banks are in raising interest rate campaign in order to take control inflation this can be interpreted as lower economic growth and as a result les demand for industrial commodities like copper which can bring prices lower.
so now obvious chart pattern and a valid downtrend, price testing important resistance area and failed to break above it and more importantly we have fundamental aspect inline with technical analysis which all together gives good odd to find a trigger to short.

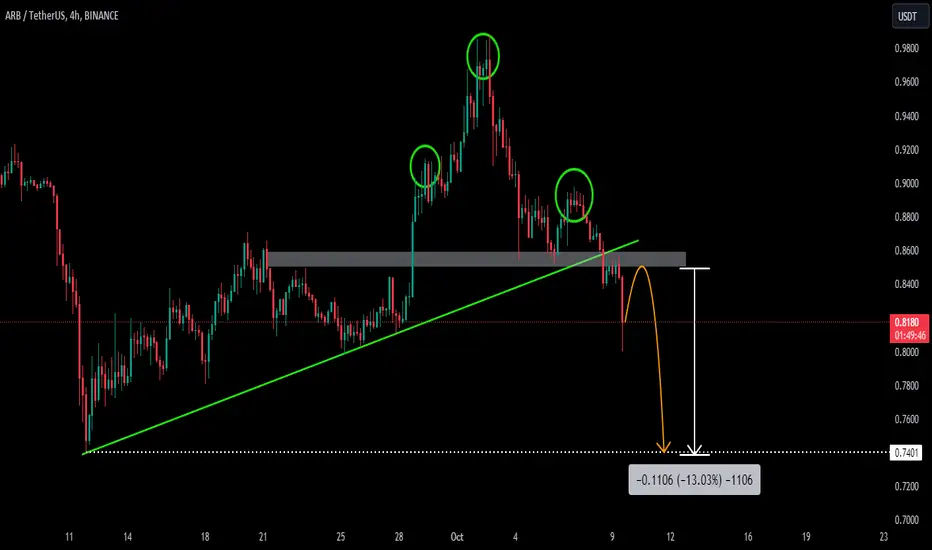
ARBUSDTARBUSDT is trading in bullish parallel channel, and created Head and Shoulder pattern at strong resistance area. And a massive sell rally break the neckline of HnS pattern. any successful retest of broken level will be nice option to sell.
if the sell pressure continues, the next target could be the back to lows at 0.7400 region.
BTC short Oct/Nov then bullish againH&S pattern in bitcoin should be closing in October / November then it will continue with the bullish cycle

EURCAD ↘️ ↘️ Head & shoulders pattern Hello Everyone 🙋🏽♂️
A head & shoulders pattern with a descending channel
set the stop loss 1.44692
and take profit at 1.35600
We are not responsible of any losses for anyone, our trades are profitable more for long terms and we take losses as everyone,
manage your lot size as well and your SL and TP
Don't forget to hit the like bottom and write a comment to support us.
Follow us for more 🙋🏻♂️
Best Regard / EMA Trading .
Disclaimer:
----------------
It's not a financial advise, As everyone we take losses sometime but for long term trading we are profitable traders, so manage your account well with SL and TP and your lot size to keep your account safe and stay in the market .

👑 EURCAD 🗝️ LEVELS TO WATCH👀AND WHYGreetings traders.👋 Today's spotlight is on EURCAD, revealing an enticing trading prospect. After a thorough review of the daily chart, it's evident that we're witnessing a quintessential Head and Shoulders reversal pattern.
The crux of our observation lies in the price's decisive move below the neckline, pinpointed at 1.42850. The price didn't just breach this critical level but retraced to validate it, reinforcing its importance. With the price now operating beneath the breakout candle, we're anticipating a bearish journey ahead for the pair.
For those contemplating a trade:
Stop-Loss:
Think about positioning it just above the preceding peak before the breakout or around the median of the right shoulder for an added buffer.
Profit Targets: Set your sights on capturing gains equivalent to 62%-79% of the Head and Shoulders pattern's full height, starting from the point of neckline breakout.
We value your insights. If this analysis aligns with your strategy and proves beneficial, we'd appreciate your endorsement. Share your thoughts or questions in the comments. Remember, risk management is paramount. Trade wisely.
Wishing you successful trades.
TCPLTP

Vertex, will it work this time? Vertex provides corporate tax processing software and consulting services to 4200 customers over 310 countries
I bought it on June but I got stopped out very fast
Now the pattern is looking better and with less participants? Count me in
All year with good relative strength, more up volume spikes and yesterday broke through long term resistence
Let's wait for the follow up

BTC Potential H&S PlayAs BTC was recently rejected from the 200 day SMA (~$28,000) as well as the 0.5 Fib level (of rally June 16-23), the potential for Head & Shoulders pattern is coming into play.
SPY
is also testing lower trendline of it's rising wedge ("recession news" likely coming) and could capitulate, leading to further pressure on BTC.
Just some Wine Wednesday speculation, but I wouldn't be surprised if we see another sharp leg down before the end of the year.
Long term bull, but "Uptober" might be a bulltrap.

SPX - Still within longer term supports Despite a difficult last 2 months when both SPX and NDX have formed a potentially bearish Head and Shoulders formation, both are still holding at their respective necklines so far.
Upon zooming out, we could also see that SPX is still trading within its rising channel that was formed since the start of its bull run from Oct 2022.
what transpired so far was a mean reversion to channel support and towards a rising VWAP anchored at a major pivot point on 13 Mar this year (creating next possible supports for SPX at 4260 - 4275 should its H&S neckline be breached).
Similarly, I am seeing that heavyweights like META, AAPL, AMZN, GOOG, TSLA are now sitting on (or near) their respective VWAPs anchored from their respective major pivot low during March or April this year.
Might not be time to be longer term bearish yet unless we see a breach of the rising channel.
On the flip side, markets are still fragile and momentum for any rebound is still lacking and it's best to be cautious until we see a clearer direction over the next few days or even a week or 2.
Disclaimer:
TA is about improving our odds of a successful trade (not a guarantee). This is just my own analysis and opinion for discussion and is NOT a trade advice. Kindly do your own due diligence and trade according to your own risk tolerance and don't forget that money management (ie trailing stop loss and position sizing) is (probably the most) important!
Take care and Good Luck!


US30 head and shoulders pattern Like my previous idea on the Dow Jones
I said before the head and shoulders nick line has broken
And we are half way of my short position
I will make update if any changes spotted
BLACKBULL:US30 OANDA:US30USD CAPITALCOM:US30 TVC:DJI EIGHTCAP:US30 PEPPERSTONE:US30

H&S and Dark Cloud Cover indicate short term bearish reversal?Heidelbergcement's future not looking good amid a raising interest rates environment for real estate promoters.
Technical analysis: Bearish
A Head and Shoulders pattern could be underway since Sep 2022 and once the stock has reached a double ceiling level at 77.50€. Besides, a Dark Cloud cover was formed on Friday 29th of September in the right shoulder and today's candle seems to be confirming the candlestick pattern prophecy, which would lead us to first support level ranging from 68.5-70.5€.
Beyond analysis and POV: Bearish and Bullish
The fact that Vonovia has frozen 60.000 apartments that were supposed to be built now also indicates a reduction of materials' demand to build houses and perhaps other real estate promoters have come up with the same decision. This means, less materials needed for now which could potentially affect Heidelbergcement's profits in the near future. However, the ISM Manufacturing PMI came better than expected for September (actual 49, exp. 47.7 prev. 47.6). This means, any short-term bearish reversal could not last long.
Fundamental analysis: All bullish considerations
The debt level is considered satisfactory with a net debt to equity ratio of 32.8%. Earnings Payout to Shareholders is 26%. P/E ratio = 7.5 while industry average is 9.1.


BTCUSDT ↘️ Head & Shoulders patternHello Everyone 🙋🏽♂️
As we could see We a change of channel after a head & shoulders patters wish is it a downtrend signal. on my opinion set the stop loss in the right shoulder and the take profit until the support divide to two TP .
We are not responsible of any losses for anyone, our trades are profitable more for long terms and we take losses as everyone,
manage your lot size as well and your SL and TP
Don't forget to hit the like bottom and write a comment to support us.
Follow us for more 🙋🏻♂️
Best Regard / EMA Trading .
Disclaimer:
----------------
It's not a financial advise, As everyone we take losses sometime but for long term trading we are profitable traders, so manage your account well with SL and TP and your lot size to keep your account safe and stay in the market .

👑 GBPNZD 🗝️ KEY LEVELS TO WATCH 👀Hello traders!👋 Welcome to another analysis. Today, we'll be diving into the GBP/NZD currency pair, which presents an excellent trading opportunity.
The chart showcases a price action reversal pattern, "Inverse Head and Shoulders," on its hourly chart. Prior to this formation, the price had been on a prolonged downtrend. With this pattern emerging, there's potential for a change in direction.
The price has broken above the neckline at 2.05029 confirming the pattern.
I recommend placing stops at 50% of the distance from our right shoulder to the breakout.
Profit Targets: at 62% (2.05692) and 79% (2.05861).
Stay tune, there is a lot more to come in this pair shortly.
If you find this analysis helpful, please support by liking and commenting. Your encouragement motivates me to provide more updates!
TCPLTP

H&S on SPY active. Will $410 target be hit?Traders,
A strong dollar (11 weeks straight of green candles) and an elevated VIX has helped to trigger a break of this H&S neckline on the SPY chart. The pattern is now playing out but we are on support on the RSI chart where we can usually expect a bounce. Additionally, we have strong support at the 200 day ma just below us. Our target on this H&S is 410. The big question is will we reach that target or will the bottom of my channel which coincides with the 200 day ma catch us before falling that far?
Best,
Stew

BTC - H&S Pattern point $25K Short TermHi Traders, Investors and Speculators of Charts📈📉
The markets are trading in the red and weak price action on BTC indicates that sellers are dominating the short term, with a nasty Head and Shoulders pattern showing up in the 4h.
Shorting Bitcoin can be tempting, especially when prices are actively moving. However, acting on impulse without a plan leads to reckless gambling more often than not. Savvy traders wait patiently for ideal opportunities with defined risk-reward ratios. Also, the risk-reward setup isn't ideal for a leveraged position right on BTCUSDT.
BTC grabs attention when it moves, but plenty of other assets offer worthwhile trading opportunities. Expand your watchlist across stocks, forex, commodities, indexes, and more. Evaluate which markets are exhibiting solid technical setups right now. Don't feel pressured to trade BTC just because it's moving. Sometimes the best trade is no trade if conditions aren't ideal. There are other opportunities with better risk-reward setups than Bitcoin.
_______________________
📢Follow us here on TradingView for daily updates and trade ideas on crypto , stocks and commodities 💎Hit like & Follow 👍
We thank you for your support !
CryptoCheck

SnP500More pain ahead for SnP500?
As SnP500 has been on enormous bullish trend and recently has formed reversal patter, Head and shoulder pattern.
And it has also break the neckline of reversal pattern. Which is suggesting the more pain ahead.

gbp/aud inverted head and shoulders patterngbp/aud -inverted head and shoulders pattern with 1600+ pips potential

Next Support At 1780, Bearish!Hey humans!
Aspen Grey here, hoping my transmission reaches Earth on time!
ETH is clearly in a major bearish pattern that will help fulfill the head and shoulders type pattern you can see on the higher time frames and also in the picture I have published.
In the past, the shape has stopped at the first of supports, like our 1780 line. But the price is also likely to fall if that support will not hold and most likely hit the bottom support I have depicted at 1680.
Then it's either bearish winter hell, which could push us further into the depths but let's hope these institutions keep pumping our coins and maybe we will see an ATH this winter.
Much love!
Aspen Grey

How to Head and ShouldersGreetings, Financial Enthusiasts! 🌟 If you appreciate our charts, give us a quick 💜💜
The Head and Shoulders pattern is a well-known chart formation in technical analysis. It indicates a reversal from a bullish to a bearish trend, usually at the end of an upward trend.
Key Points:
- Head and Shoulders: Chart pattern signaling trend reversal.
- Formation: Three peaks on a baseline - two lower outer peaks and a higher middle peak.
- Bullish to Bearish: Suggests a shift from an upward trend to a downward one.
- Applicability: Seen on all timeframes, suitable for various traders and investors.
- Entry Levels: Easily identifiable, aiding in trade implementation.
Why It Matters:
The Head and Shoulders pattern provides traders with a visual representation of a trend reversal. It's widely used due to its simplicity and applicability across different timeframes.
The Pattern:
- Formation (Market Tops):
1. Left Shoulder: Price rises, forms a peak, then falls.
2. Head: Price rises again, forming a higher peak.
3. Right Shoulder: Price falls again, then rises but forms a lower peak than the head.
- Formation (Market Bottoms):
1. Left Shoulder: Price falls, forms a trough, then rises.
2. Head: Price falls again, forming a lower trough.
3. Right Shoulder: Price rises again, then falls, forming a higher trough than the head.
Neckline:
- For Market Tops: Connect the low after the left shoulder to the low following the head to create the neckline.
- For Market Bottoms: Connect the high after the left shoulder to the high after the head to form the neckline.
Trading the Pattern:
- Wait for the pattern to complete before trading.
- Entry when price breaks below the neckline (tops) or above it (bottoms).
- Stops placed above the right shoulder (tops) or below it (bottoms).
- Profit targets calculated based on the head-to-shoulder difference and added (bottoms) or subtracted (tops) from the breakout level.
Why It Works:
- Sellers enter as price falls from its peak, reducing aggressive buying.
- The neckline marks a point where traders exit positions, driving price toward the target.
- A lower right shoulder (tops) or higher right shoulder (bottoms) signals a trend shift.
- Profit target assumes forced exits by those in losing positions.
- The neckline prompts many traders to exit, pushing price towards the target.
- Volume analysis helps confirm patterns; expanding volume (bottoms) shows increased buying interest.
Pitfalls:
- Waiting for pattern completion may require patience.
- Not all patterns lead to successful trades.
- Profit targets aren't always reached.
- External events can disrupt patterns.
- Patterns can be subjective; traders should define their criteria.
The Head and Shoulders pattern, though not foolproof, provides a structured approach to identify and act on trend reversals.
