EURJPY IDEA FOR SHORTHere is another trade a took this week,trading just this pair,took two buys and now a sell, had some plans on a eurusd but missed my entry for buy,and entry for sell happened in the middle of the night,it happens sometimes.Entered this trade on a retest of a HS pattern,HS means that a reverseal could happen so i took a sell here,red line is a multiple weekly candle close,lets see how this trade will play out
Head_and_shoulder

EGLDUSDT, Inverse Head & ShouldersEGLDUSDT in TF 1D,
Inverse Head & Shoulder
Breakout Neckline
Wait retest Neckline.
Best price for Buy is 45$
Thanks

BTC---> SCALP POSITIONHELLO GUYS...
time is consuming therefore long story short,
get a short position until the first pink area, or you can risk it and hold it until the second pink area!
if the price reaches the second pink area and gives you some confirmation get a long position until the higher high level to this chart!
I hope I write it clearly!
always do your research.
If you have any questions, you can write them in the comments below, and I will answer them.
And please don't forget to support this idea with your likes and comment

EURJPY TWO TRADES PLAYEDHere u can see classic h6s pattern traded,maybe sl isnt on the best place 144.800? Would love to hear where would u put your sl,let me know in the comments!

USDCHF - Waiting for a Breakout...
The USDCHF Price Touched the Weekly Resistance Level 📉
Currently, The price is in Double Top Pattern !
i'm waiting for a breakout in the neckline 🔥
Then! we will see a bearish move 📉
TARGET: 0.92925🎯
.....
if you agreed with this IDEA, please leave a LIKE, FOLLOW or COMMENT!

USOIL - Double TOP 📉The USOIL Price Touched the resistance level 🧐
Currently, The price is in Double Top Pattern !
i'm waiting for a breakout in the neckline 🔥
Then! we will see a bearish move 📉
TARGET 1 : 75.80🎯
TARGET 2 : 74.15🎯
.....
if you agreed with this IDEA, please leave a LIKE, FOLLOW or COMMENT!

GBPCAD - Important Breakout 📈The GBPCAD price is in Bullish Triple Bottom Pattern 🧐
The Daily Resistance Line is broken 🔥
so, i predict a bullish move 📈
i'm Waiting for a retest 🧐
TARGET 1: 1.64434
TARGET 2: 1.66624
...
if you agreed with this IDEA, please leave a LIKE, FOLLOW or COMMENT!

ALIBABA ($BABA): Technical Analysis on daily chartHi everyone!
The main trend of $BABA is bearish on the daily chart, but most of the bearish momentum has already been worked on by the market. Having said that, even in the short term I remain bearish at least up to the support area, from there I cannot exclude some Reversal Pattern (see chart below). If this happens, an update to this analysis will be necessary because before trying to take a long position I want to wait for at least one clear signal (for example, an impulsive structure on the hourly chart).
POTENTIAL REVERSAL PATTERN
If we look at the Daily Chart, the support area could turn into something like a Right Shoulder of a potential "Inverted Head & Shoulders".
Trade with care! 👍 ...and if you think that my analysis is useful, please..."Like, Share and Comment" ...thank you! 💖
Cheers!
N.B.: Updates will follow below

USDJPY Ready for a large move southThis idea is one to watch and will be a good move if it happens.
USDJPY took incredible Bull action last year, but has since been moving back down to previous support levels.
We can start to see an incredible head and shoulder pattern forming.
Key levels to look out for are the previous support zones around the 126-127 zone and especially the 115 zone which has been a historical key zone.
Whilst in there as been short term bulish pull back, stepping back out to the daily shows there is more to this downside and a good entry zone currently.

EURAud pt. 1.1.EURAUD possible H&S. On daily chart price has gone past strong ressitance level, but on 4h it's still knocking at the door.
Lets see how this daily candle ends, but until price hasn't gone past head, I will keep adding small sell orders.
Good luck.

PVRHello and welcome to this analysis
In the weekly time frame its given a wedge breakdown and followed it up with a throwback to resume its down move again. In this process it has also activated a Bearish Head & Shoulder pattern.
Resistance is now at 1600 while support comes in at 1275 (with a minor one near 1460)

DXY Testing Strong Resistance LevelAfter the US dollar index broke out of the descending channel as we previously mentioned, it is now testing the strong resistance level at 105.70. It is likely to bounce back to form the first shoulder of the head and shoulders pattern, possibly towards 103.850 or even 103.750 to retest the previous support level and the ascending annual trend line. This would form the right shoulder of the head and shoulders pattern, providing a good buying opportunity up to the neckline above.
I will closely monitor the market to seize entry and exit opportunities based on analysis within the trading channel, hoping to profit from these expected price movements.
-------------------------------------------------------------------------
Let me know your thoughts in the comments, and show your support by liking the idea.
Please follow if you're interested in more ideas like this.
Your support is greatly appreciated!

USDCAD - Double BOTTOM 📈the USDCAD is in double BOTTOM Pattern
the Neckline is broken
so, i predict a bullish move 📈
i'm waiting for a retest...
TARGET: 1.36430🎯
...
if you agreed with this IDEA, please leave a LIKE, SUBSCRIBE or COMMENT!

KOTAK BANKHello & welcome to this analysis on one of India leading Pvt banks
In the weekly time frame its forming a Bearish Head & Shoulder pattern suggesting below 1640 (neckline) for a possible downside till 1475.
At the current moment it faces resistance at 1725 and 1750.
Unless those levels are not broken on the upside it remains one of the weakest banks in the Bank Nifty index.
Regards

JB Hunt, time to go long? (H&S)Closed out a short position after today's drop in Nasdaq and then went long on the reversal/bounce off the low $182's. Looking to see to what extent the Head & Shoulders pattern plays out beyond $186.
If we stay above the 200 MA, $190 would be the first profit target, with a possible short to retest $186.00.
NASDAQ:JBHT

Head & Shoulders and long tradingThe chart should be self-explaining. Let's see if the order gets filled in the next weeks. Good trades, folks!

BOSCH - NSE - INDIACompany website- www.bosch.in
Founded in 1886, into multinational engineering electronics, presence is over 60 countries worldwide.
Major product line-
Automotive Aftermarket parts ( battery, spark plugs, wipers, brakes, clutch plates etc ) and smart mobility ( autonomous and Iot enabled )
Household appliances- fridge, dishwashers, washing machines, microwaves etc
Powertools, software, engineering etc - Huge diversity of business.
Invested into the blockchain for future growth.
Financials-
Assets worth 9000cr, zero debt, high brand value, fv 10- becomes a candidate for split/ bonus
____________________________________________________________________________________
Inverted head and shoulder pattern = classic reversal
A strong buy.

KAVA With Bullish Setup FormationKAVAUSD is making a nice a-b-c pullback within wave B/2 after an impulsive rally into wave A/1 from the lows. It's currently already sitting at interesting 0.80 support area, from where we may see a continuation higher into wave C or 3, especially if we also consider nice and clean inverted Head&Shoulders pattern.
Technically speaking, if the price rebounds back above 1.10 region and neckline of inverted H&S pattern, then we can easily expect more gains, as bullish trend would be confirmed. Invalidation level remains at 0.5150.
Happy trading!

USOIL (CRUDE OIL) PERFECT BEARISH SETUPTVC:USOIL
HI , TRADER'S .. AS YOU CAN SEE HEAD & SHOULDER PATTERN IN 4HR TF
Price is making beautiful bearish H & S , Price is completing right shoulder and reaching Neckline
Neckline or support line is near 72.90 , once market breakout from neckline and retest it
Sell entry can execute after retest , Target will be 64.00
Trade with proper risk management
❤️Please, support my work with follow ,share and like, thank you!❤️

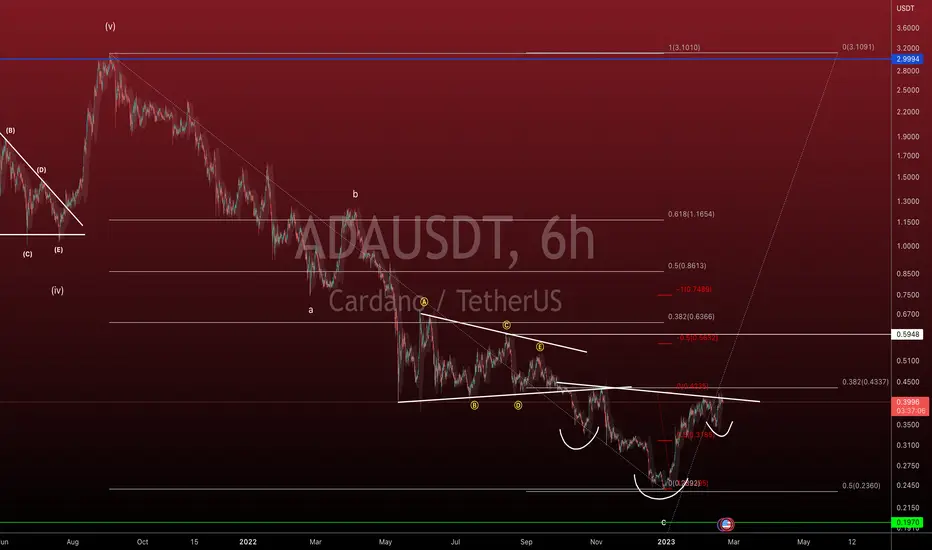
Cardano at a critical pointI gave a pretty vague outlook on Cardano the other day so I figure I should probably fess up a bit and let you all know exactly how I feel about it. Right now, it looks like we're in an inverted head and shoulder pattern. It looks like it wants to explode out of here and o straight for the target which is $0.75 but not so fast. Lets discuss a few things here.
First, do you actually know how to trade a head and shoulders pattern? Pattern trading can be pretty decent as long as you do it right. Ideally, we'll break out of the current pattern and do a nice solid retest of the neckline. Your stop loss should be the low of the right shoulder and your target should be 100% of the size of the head to the neckline. That puts us at right below 75 cents.
To compare, ADA is trading at 40 cents now. That's a pretty good reward, but what is the risk? Currently a 13% risk. That's not insignificant. Play your cards right and you'll be okay but don't do anything dumb. Wait for a breakout and get a retest of this level we're at now (around 40 cents) and you'll be ok. Just keep that stop loss to make sure you survive another day.
Asian paints in an way of head and shoulder breakout Asian paints was in a way of its bullish head and shoulder breakout also with full support of RSI ..
Buy it at 2856
Target 2918 2964 3027
Sl 2730

HBAR bullish if neckline is penetratedHBAR has almost formed an inverse head n' ahoulders that can be seen as a complex one. confirmation is when the neckline is penetrated with decent volume.

8035 longAs you can see on the chart - I'm feeling bullish. Entering with a tight SL. Let's see how this trade plays out.
