Head and ShouldersWe see a regular divergence in Daily timeframe . So the pair will go down!
In 4h, we can see the target by analyzing head and shoulders!
Head_and_shoulder

NVDA Daily Price Predictions 2/1/23NVDA close to completing its primary pullback following this head and shoulders pattern. It's on its way to reaching bouncing off support on fib retracement, daily pivot, and most importantly the previous neckline attached to the pattern. I predict today we will possibly see a large rejection candle approaching the neckline and will be the last day of the pullback before turning back to the upside. Assuming we don't see any unexpected price action today (breaking support or failing to reach support zone) this would be an ideal position to place a long position.

XAUUSD STRONG SELL!we have 2 factors for open a sell position:
1)in 4h we can see chart going to make head and shoulders
2)the channel was broken and you can see a pullback
So...:
XAUUSD SELL AT : 1927
TP1:1900
TP2:1860
SL:1937

AUDJPY..4H bearish view..AUDJPY pair runs to touch nice level for short trade after bouncing off daily resistance zone ----> after breaking 4H uptrend line and formation aclassic H&S pattern ,am expecting down move with nice short trade with perfect R/R ratio ...be safe...

BITCOIN - Head and Shoulders Targeting $21000BTC is in a good setup for a head and shoulders to the downside. The head and shoulders is a bearish pattern where the price bounces and returns to the "Neckline" support level the 3 times with the final return resulting in a break of neckline support.
How to spot
The easiest way to spot a head and shoulders is to find a support level that the price is bouncing off of. Look for a moderate bounce that returns to support followed by a larger bounce that also returns to support. This is the left shoulder, head setup. In this case, you can see a possible right shoulder forming around $23120. This price area has proven to be strong resistance. It has kept the price at bay for weeks now with all breakouts retreating back below it. As a result, it's the perfect set up for a head and shoulders.
How to set your target price
To determine your target price, measure the distance between the top of the head and the neckline. In this case, $1500. Subtract this amount from the neckline and you will get your target price.
Make the bearish case
How is the price action looking? Is the price action bearish? Is there a lot of buy or sell volume? By making a bearish case prior to your head and shoulders call, you will have more success in your trades.
BTC BEARISH CASE
-Broke the red channel
-Returned back below strong resistance
-Bear flag setup for right shoulder
How to Trade
Some traders like to enter their short at the top of what they perceive to be the right shoulder. The weaker (lower) the right shoulder in comparison to the left shoulder, the better. This shoulder is still early so its difficult to say whether we've topped yet, but the strong resistance would make me feel better about entering here. Other traders like to enter their short once the price has broken the neckline, which would be a more definite bearish move.
Technical patterns are never 100% for certain. However, if you can spot them and trade them in the right circumstances, you will find a lot of success. Best of luck! I hope this helps improve your trading and your PnL!

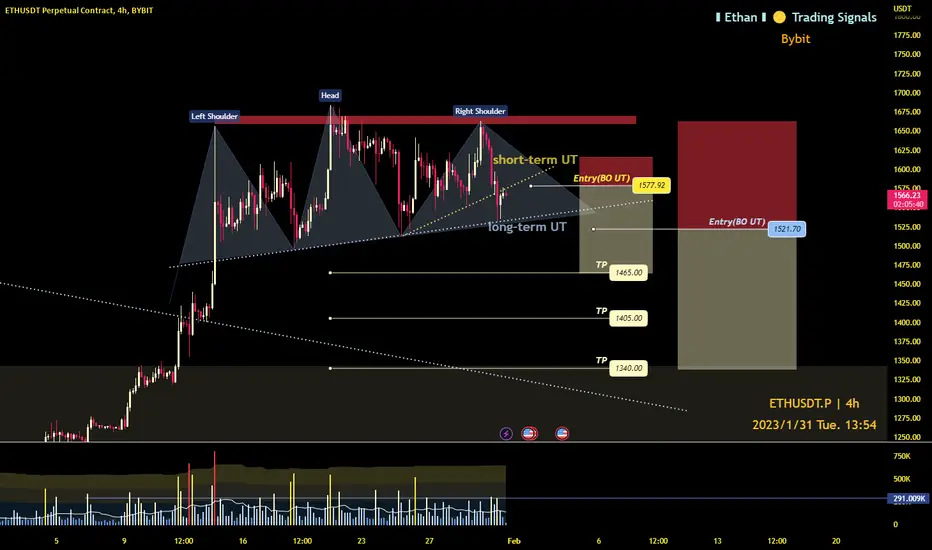
ETH - 2 Selling StrategiesBYBIT:ETHUSDT.P
4H time frame
-
ETH forms a potential HS
According two uptrend(UT) lines, there are 2 opportunities to open short.
-
1.
Entry: if getting resistance from short-term uptrend again(~1577)
TP: 1465 or reach lower uptrend
SL: 1615
2.
Entry: BO the long-term UT (~1521)
TP: 1405, 1340
SL: High of right shoulder (~1663)
-
Notice: All price are set from the predicted trend, can set it more accurate based on the actual trend/pattern after opening short
BULLISH into BEARISH ScenarioTSLA has momentum to move to 180 area. (This needs to happen before FOMC meeting)
I thought Tesla was finished here, but momentum is strong and puts are piling in, I think we may see a continued rally to 169,if we close above 167.55 on daily or weekly, Tesla could hit 180 by Tuesday, before selling off
Technical Bullish Patterns:
15min- Bullish pennant breakout - measured move to 170-175 (close below 154.5) invalidates (false break-out)
Daily: H&S Pattern measured move to 175-181 (close below )
Technical Bearishness:
1 hr - Bearish Divergence on RSI, MACD, STOCH
200 WMA: 167
currently oversold on BB bands
Bearish Catalysts:
-1/27 PCE Prices higher than expected
-1/31 employment cost index higher than expected
-1/31 Bad Tech earnings
-2/1-Fed Drops Market on Feb 1st (FOMC decision) **** I think Fed will tank the market

Square Reverse Head and Shoulder at fib? I believe I'm looking at a reverse head and shoulder on Block (SQ) on the weekly. This could indicate a longer term breakout above the fib. I'm thinking of small position size to front run the break out, a little more on a pullback (considering RSI) and larger size after a breakout up to 100. Tech's recent run in January and Block's extremely strong pullback in 2022 set up nicely for profit making.

Inverse head and shoulder pattern on Ultratech Cement chartsNSE:ULTRACEMCO
Formation of inverse head and shoulder pattern
Current Price - 7237
Target 1 (diff from left shoulder) - 7650 - remaining upside 413 (5.7%)
Target 2 (diff from right shoulder) - 7825 - remaining upside 588 (8.1%)
Stop Loss (low of last candle) - 6863 - downside risk -374 (-5.1%)
Disc - invested, for educational purpose only.


H&S PATTERNS INTO H&S PATTERS Head and shoulder patters are ALL OVER CRYPTO AND NOBODY IS TALKING ABOUT IT! FILL THAT GAP

BTC/USDTi think btc going to break up side
i am looking target 17200$ & 18000$
if btc break 16200 then after retest i am taking my short position

ETHUSDT shortBINANCE:ETHUSDT
Head and shoulder pattern if the neckline is broken
In fact, it gives us the confirmation we need

QML pattern Quasimodo | SMART MONEY CONCEPTHello all. Today we will talk about the reversal pattern "Quasimodo" or QML. Schematically it looks like this:
The price moves in the trend, in POI the structure breaks and after that, the price can not update the previous HH and the downward movement continues (consider a schematic example).
In this example, after the breakdown of the structure, the price reverses to soften and remove internal liquidity, after which a reversal occurs. This is done in order to close a losing position at the expense of those who put their stop losses behind the maximum of the substructure.
There are many names for this pattern, such as three tap setup, but I'm more accustomed to calling it quasimodo. If you like, it's a reworked version of the "head and shoulders" pattern, but in this case you're focusing on the price action instead of the picture.
Criteria for QML formation
1. Use it in HTF POI
2. Watch HTF POI
3.Watch the price action.
4. Premium or Discount zone
To use the pattern effectively, you must analyze the chart of all TFs. And use the pattern as an entry model. For example, the daily TF is bearish. The price is in the premium zone, as well as on the H1 TF began an uptrend, a full of bullish trend in the lower TF, after which we see that the substructure (red) has changed from a rising to a descending. And thus, we expect a continuation of the downtrend.
Important
Don't use this pattern in terms of "drawing". They can draw anything on the chart. I recommend to look for POI in POI of higher TFs.
An additional factor could be substructure fluctuations before FWG or OB. You need to see how the price behaves after their update.
Where to put a stop loss
The first option is a stop-loss for a local FVG/OB
The second - above swing high of substrucutre
Third - above the HTF point of interest, if your RR allows it
EXAMPLE
After updating the all-time high, the daily structure was broken. Then price consolidated, it was worth waiting for the manipulation. It was possible to enter from HTF POI - aggressive entry, but it was possible to wait for confirmation on the LTF (as I do).
I'm expect bullish OF on 4H chart to HTF POI (2D ob)
This "entry into position" is shown as an example, so that you can form an understanding of how to act in this or that situation. In conclusion, the more factors you take into account in your analysis, the higher the probability of working out of the pattern. Also, it's up to you to choose what kind of stop loss you will use. There is no right and wrong, everything depends on your strategy and money management.
The position was opened after the second liquidity raid in the premium market. I hope it was helpful to you. Thank you for your attention

GBPAUD pt. 1.2GBPAUD break the neckline of the head and shoulders pattern, now making a retest on 4h, looks like we will get ABC pattern. Tp for this move is fib 1.272 or around 1,7135.
Ultimate TP for wave 3 on 1d chart 1,700.
I'll keep posting updates on this idea.

AUDUSD Moving Into Technical Resistance After CPIAUD is the mover of the day after CPI yoy jumped unexpectedly to 8.4% in Australia up from 7.3%. Thats big and can potentially mean that RBA will be foreced to raise rates further. AUDUSD is moving aggressively higher, but still trading at some key resistance levels here, with fifth wave. A lot of major currenices are trading at resistance vs USD, so if suddenly USD index would rally, then Aussie can come back down, but would most likely suffer less than others. From a longer term perspective we see AUDUSD clearly in bullish mode for much more upside, but ideally after a higher degree pullback.

GBP/USD UNIQUE IDEA....(buy).....hi to all friends
Hope you all are enjoying me ideas and analysis. Now i am here to discuss about FXCM:GBPUSD
A simple forecast.....80% win....
Note: Dear friends, be sure to confirm in the 1-hour time frame and enter the 15-minute time frame ...
Wait for breaks and confirmation....
Goodluck and as always, trade safe!..........

DOGE/USDT / LOOKING BEARISH/BULLISH! doge/usd
currenctly our short position but if they hit my sl or complete a head & shoulder pattern then i am gonna to open my long position my short position target achived then i am gonna to open my long trade because harmonic pattern are completed.
u are agree with my idea then like it :)
u are agree with my idea then like it :)

GBPUSD ShortFX:GBPUSD
A head and shoulder pattern on GBPUSD for a potential short. Waiting for a break and retest with a candlestick confirmation to go short on GBPUSD.

#TSLA Big Heads have big Shoulders. The weekly chart on #tsla has formed a massive head and shoulders. you see the high volume enter the left shoulder, then the depreciation in volume another smaller volume but higher price making the head, and the lowest volume right shouler, followed but some nice volume.
*can bulls hold? it is a musk company, tis the season and all. But this big head here does not look Bueno! good luck traders, im looking for low volume in premarket sustained after open, and possible long put. no entrys or exits because ill be observing as data comes in.

WAIT FOR RETEST AND TAKE IT UP..It appear the market has created an inverted left shoulder of consolidation, an inverted head.. market broke in support, wait for retest and buy the inverted right shoulder.. get in and get out, or take it to the the support zone.. happy trading..

My personal opinion - an expected decline of the NasdaqWe are in tense weeks where the market is in a war of bulls and bears.
After reading market reviews on behalf of Bank of America and others, analyzing market trends, talking to representatives of the Federal Reserve, past behavior of the market and performing technical analysis.
In my opinion, all the data is converging to the point where the Nasdaq is going to fall to the peak of the Corona period.
1. Traditionally, the bottom in the market comes only after the interest rate hikes a re over.
2. Apple, the most powerful company in the USA, has not yet broken the mold of the cup and the handle it created.
3. The period of reporting the results will bring with it a decrease in the PE of companies that has not yet been updated in accordance with the decrease in profits.
Good luck to everyone, Yosef

Large potential head and shoulders 30k soon????If price does reject from this resistance (Hopefully it doesn't) and come back into the macro value area price could hit the golden pocket retracement of that move up which has a lot of confluence such as an old and very respected weekly s/r a naked daily point of control and a daily s/r. If price can bounce from that area with market cipher printing a trigger wave on higher time frames and lower-mid timeframes showing clear divergences on momentum and money flow price could probably make its way up to make a new high creating a huge head and shoulders with a target of 30k which just so happens to be the target for some other analysis I was doing.
While trading make sure you manage risk properly
But most importantly have fun.
