What's Next on Copper Intraday H&S?The aforementioned Asset Re: Copper displays a possible bearish intraday set-up. All things considered (Methodology, + Risk strategy), should this set-up become validated, this trader will revert to correlated assets i.e., XAUUSD and co-correlated assets of XAUUSD i.e., XAGUSD, AUDUSD, NZDUSD, EURUSD and GBPUSD, for similar set-ups and entries within the annotated and technical direction.
Ps: Not intended as a form of financial advice, but merely reflects the opinions of a retail speculator.
Head_and_shoulder

BTC Forming right shoulder of H&S...headed down to $15,600?BTC keeps getting denied at the centerline of the main downward channel. When the upward channel that's been in play since November 21 intersected with the main downward channel there was a steep breakdown. Now I believe we will finish out the H&S as drawn until we reach the bottom of the upward channel on Thursday. Then there will likely be another dump down to support at $15,600 which is also the 0.128 line that has been major support and resistance in the main downward channel.
I think this is really only the beginning of a massive dump until the end of the year. Mercury will be retrograde on December 28 and 6 out of 6 of the last times Mercury has gone retrograde, a major dump has taken place in the 2-3 weeks preceding the exact date of retrograde. We have entered this shadow period now so I think this is only the beginning of several weeks of bears in control. I think we'll see at least $12k before year's end.

CrudeJust a view short term bullish, if head and shoulder pattern comletes and breaks the neckline
Possible tgt 7440
Neckline at 7240

DXY heading northOn the daily chart, The DXY holds in a powerful resistance zone; there is a 200DMA, monthly resistance, weekly resistance, and a supply zone with a 38.20 Fib.
In the 6-hour time frame, we have two reversal patterns, with a divergence in the MACD.
We may see a head and shoulders pattern if a candle closes above 105.74, as shown by the yellow arrows on the hourly chart.
--------------------------------
Feel free to share your thoughts in the comments, and kindly support the idea with a like. Your support is greatly appreciated!

SPX500 might be heading shortSPX500 is facing strong resistance,
1 - touching a trend line that started on January 22 and touched again on March 22 and August 22.
2- A touch of the 200-day moving average.
3- Touch the ascending channel's top trend line.
4- Entered and exited a supply zone.
On the 4 hour time frame, I see a head and shoulder pattern with a divergence on the MACD
In order for the bears to take control, the neckline of the head and shoulders pattern at 3903.4 needs to be broken.
--------------------------------
Feel free to share your thoughts in the comments, and kindly support the idea with a like. Your support is greatly appreciated!


$dxy - head and shouldersthis is bullish for stocks, expecting a nice bounce in $spy, $qqq, etc with the breakdown from the $dxy h&s

Inverse H&S pattern on AUDUSDTaken this inverse head and shoulders pattern and hit first targets at 0.6779
Look to take 2nd targets at the high 0.6833
Already in a risk free trade lets see how this one plays out

EUR/HUF - inverse Head&Shoulders - Long - 1-3wA potential inverse head and shoulders pattern on the chart (not the prettiest, but whatever) and on the RSI as a possible sign of a reversal.
Let's see if price can rise above the neckline around 415 HUF, if so:
Buy in: above ~415 HUF
TP: 433 HUF
Time interval ~1-3weeks
Fundamental background:
The European Commission has concluded that Budapest has not sufficiently fulfilled its reform promises in the fight against corruption, and will recommend to member states to freeze €7.5 billion from three cohesion programs at its meeting next Wednesday, according to the conservative daily Frankfurter Allgemeine Zeitung. ( 23.11.2022-13:14)
If the Council adopts the Commission's proposals, it would mean 65 % of the funds for three Hungarian operational programs would be withdrawn from Hungary. This would mean blocking €7.5 billion, or around 3,000 billion HUF, which is around the third of the cohesion funding for the budget period up to 2027.
HUF weakened against the euro on the news.
source: www.faz.net

EURAUD forming reversal pattern on 1 hourEURAUD forming reversal pattern of head and shoulder on 30M and 1H timeframe . If it breaks neckline with volumes it will be going downwards to 1.53000.With proper stop loss traders can take a short sell ride from here

$EURCAD - It's brewing!$EURCAD - It's brewing!
I've really enjoyed the long side of $eurcad
Technically we are making a inverse H&S
We can even go to lower time frame and see that in a perfect measure. Now when I seek to trade patterns, firstly it's important to see break out as well as a great R/R. I would prefer a pull back towards areas of: 1.36 - 1.35 half areas and then perhaps execute first position if we are to break towards upside of resistance we are currently at in GREEN I have drawn 2 target areas I will be looking to scale out in. Now that's way I trade it isn't for everyone. Stop below where the 1.32 half areas giving it enough room and if it is to hit the stop then the pattern would be invalid to me and I would then re plan this trade.
Don't forget to trade your own trade plan.
Have a great week ahead,
Trade Journal

A head and shoulders pattern on the 4 hour time frame of BitcoinBTCUSDT after breaking its 200 ema and 100 ema in the hourly time frame, and somewhat stabilizing the price, Bitcoin still needs to supply energy and return to lower levels, and for this reason, it has created a head and shoulder pattern in the 4 hour time frame. If we get confirmation that the neckline is not broken, we will sell or short. Profit limit and loss limit are marked with dashed arrows. I hope the whales in the market will not cause any problems in the correct implementation of this pattern.

Bitcoin head and shoulders Are we seeing a possible head and shoulders forming here on the 4-hour chart for Bitcoin? This would coincide with the $9500 target and possibly a slightly lower price into the $8900 level for Bitcoin. This price action would actually bring us into this Gareth Soloway yellow trendline.


USDCHFHi traders, watch USDCHF with your own according strategy and look for a long position opportunity for a short term trade setup GOOD LUCK.

#CHFJPY possible short opportunitySince JPY index shown potential upside move and already break above a bearish Daily channel as well as forming a reverse Head & Shoulder formation it gave us the idea of to be looking for a shorting opportunity on different JPY pairs like CHFJPY.
If JPY index keep going up to reach its one to one Head & Shoulder target projection then we can expect any upside rally on different JPY pairs can lead to another drop.
With all this being said now if you take a look at CHFJPY chart you can see price formed a bearish impulsive move and as a result of that move formed a new low. since then price been correcting that down side move and now it reached the static resistance area which you can call it structural point too and also 61.8% of Fibonacci level and 1H EMA. which all together can give us a resistive cluster.
moreover, price also did reject from the area just recently and formed two bearish 1H candles, which shows that sellers are there. but in order for us to be able to sell we need another bullish move in lower time frame. but unable to goes above the recent top and 1H EMA or at least wont close above it.

head and shoulder formation in tata communicationA clear head and shoulder formation in tata communication plan trade accordingly.....
post for educational purpose only...

XAUUSD will go long if:If gold breaks the neckline of the inverse head and shoulder pattern @1803 with momentum and stays there, it will probably target 1832 and then come back to retest the neckline and do some liquidity fishing to head up again towards 1895.
There is a possibility of changing the hole direction down to 1703, but I am still biased long on gold ; my reasons for that is that We have the price hanging above 200,100 and 55 EMA's on the daily chart , and the price broke the very strong monthly resistance @1756, as shown in the chart below.
--------------------------------
Feel free to share your thoughts in the comments, and kindly support the idea with a like. Your support is greatly appreciated!

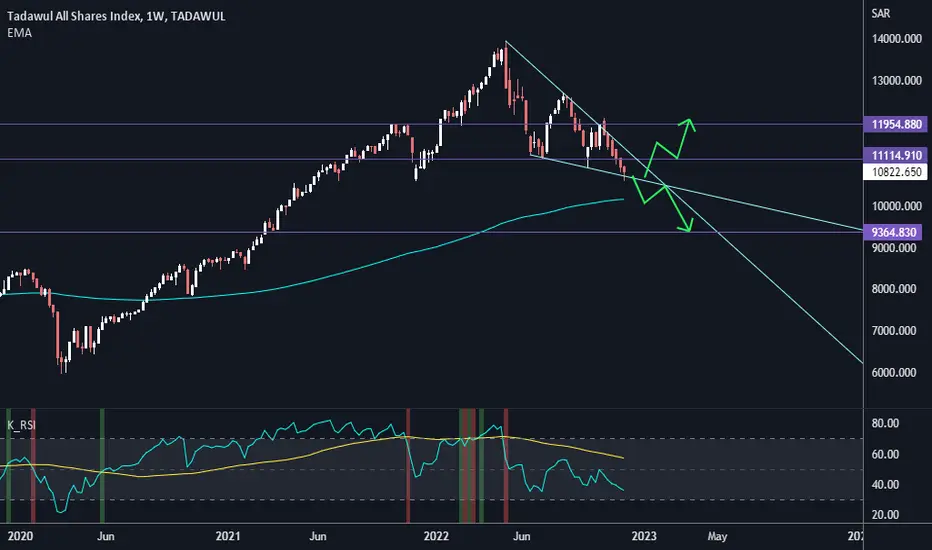
Tadawul All Share Index (TASI) look for coming weeksTadawul All Share Index (TASI) at a crossroads:
1- rise to nearly 12000
2- down to 9500 level
Head & Shoulders ???I
see a head and shoulders forming on the 4 hour time frame. Curious if we hit the levels and see what happens from there.

#Head&Shoulder chart pattern in action
Head and shoulder definition: A simple head and shoulders top formation is characterized by a peak representing
the left shoulder, followed by a higher peak which is referred to as the head of the formation. A lower peak representing the right shoulder is found on the right‐hand side of the head. The head should be the highest peak in the formation. The neckline is a trendline that connects the troughs that lie on either side of the head. Necklines may be horizontal or inclined which in our case is inclined. In an inverted head and shoulders formation (also referred to as a head and shoulders bottom), the head is the lowest
trough within the formation.
Head and shoulder pattern completion: The head and shoulders formation is completed with a valid breakout of the neckline Until a valid penetration has occurred, the formation is regarded as merely tentative. But as you can see in our case the pattern is completed since we can see upside breakout of the chart pattern neckline.
Head and shoulder pattern target: The minimum one‐to‐one price objective or target for a head and shoulders top formation is simply the vertical distance between the head and the neckline projected downward from the neckline breakout level. For an inverted head and shoulders formation, the vertical distance is projected upward from the neckline breakout level. You can see this vertical line in the chart.
Head and shoulder pattern entry:
■■ Short at a break of the right shoulder’s uptrend line with a stop placed above the right shoulder or head (see Point 1 in Figure 13.9)
■■ Short at the peak of the right shoulder with a stop placed above the right shoulder or head, especially when there is a significant resistive confluence comprising of significant Fibonacci retracement levels, Floor Trader’s Pivot Point levels, and
psychologically important price levels associated with double and triple zeros
■■ Short at the right shoulder when it is testing the left shoulder’s resistance level, with a stop placed above the resistance level or head
■■ Short on a valid penetration of the neckline with a stop placed above the neckline, right shoulder, or head (see Point 2 in Figure 13.9)
■■ Short on a retest of the neckline after a valid penetration with a stop placed above the neckline, right shoulder, or head (see Point 3 in Figure 13.9)
■■ Short on the penetration of the price associated with the trough created by the retest action, with a stop placed above the trough, neckline, right shoulder, or head (see Point 4 in Figure 13.9)
i.postimg.cc
Source: the handbook of technical analysis by Mark Andrew Lim

#JPYbasket bullish move confirmationsyesterday red candle was not only a retest to a broken bearish channel upper line, but also head and shoulder neckline. in addition to these two confluence we should be aware that JPY index suffers a lot through past month during rate hike cycle of central banks and fall massively like never before.
But now that we have some confluences that we are close to end of rate hike cycle JPY has found some room to appreciate against other currencies and as a result in technical aspect we can see it had formed and broke bullish chart pattern and its no longer trading in bearish channel.
with the look at the text book chart pattern target we can see that price can come all the way up to the oldest bearish channel midline and from there we should be looking for other confirmation and change in macro-economy.
