GBPUSD Trade PlanChart shows a bullish divergence between price and RSI, alongside an inverse head and shoulders pattern, indicating a potential bullish reversal.
The trade setup suggests a buy stop above the neckline at 1.27268, with a stop loss at 1.25861 (below the lower low).
Profit targets are TP1 at 1.28680 (first resistance) and TP2 at 1.30080 (higher resistance).
Ensure confirmation with a strong breakout above the neckline.
Partial profits can be taken at TP1, moving the stop loss to breakeven for a risk-free trade.
If the price closes below 1.25861, the setup is invalidated, and no entry should be made.
Head_and_shoulder

Update: Trade closed $138 $VRTOne of my best performing single name equities of 2024 - $NYSE:VRT. I've closed most of this trade because it has swollen to be a larger portion of my portfolio than was intended, i.e. portfolio rebalancing. I will keep VRT on my watchlist as a new leader in the AI infrastructure category and a YTD leader overall. I will shop for pullbacks to the 18, 21, and even 50 day moving averages, or a new pattern development -- the latter would take at least several weeks from now to form with enough duration for me to be interested.
My goal is to lock in this profit and to not give it back.

A price action swing resistance level.i this example i am watching this swing resistance level to traded back to and then goes lower.

AAPL: About to shift the trend! (D & H chartts)Daily Chart (Left)
Head and Shoulders (H&S) Pattern: A potential Head and Shoulders pattern is forming on the daily chart, with a neckline around the $221.33 level. If this pattern completes and the price breaks below the neckline, it could indicate a bearish reversal, signaling further downside.
Pivot Point: The pivot point at $228.66 is acting as a near-term resistance level. A break above this level could invalidate the H&S pattern, leading to a continuation of the uptrend.
21-Day EMA: The stock is hovering around the 21-day EMA, suggesting indecision in the market. Staying above this EMA could be positive for bulls, increasing the chances of an upwards breakout of the pivot point.
Hourly Chart (Right)
Cup and Handle Pattern: The hourly chart shows a potential Cup and Handle formation, with resistance at the $228.66 level. A breakout above this resistance could lead to a bullish continuation.
EMA Support: The 21-hour EMA has provided dynamic support, keeping the price within the handle formation. Holding this EMA and breaking the resistance could complete the Cup and Handle pattern, signaling further upside in the short term.
Trading Implications:
AAPL is at a crucial juncture. A break above $228.66 would favor a bullish outlook, while a break below the $221.33 neckline would indicate a bearish reversal. For now, we should watch these key levels closely for potential setups.
For more detailed technical analyses and insights like this, be sure to follow my account. Your support helps me continue providing valuable content to help you make informed trading decisions.
Remember, real trading is reactive, not predictive, so let's stay focused on the key points described above and only trade when there is confirmation.
“To anticipate the market is to gamble. To be patient and react only when the market gives the signal is to speculate.” — Jesse Lauriston Livermore
All the best,
Nathan.

EUR/USD's Déjà Vu: Ready to Ride the Next Wave?So, here’s the deal with EUR/USD – it’s throwing out a pretty juicy head-and-shoulders pattern. If you’re not familiar, just think of it like this: the market is literally shrugging its shoulders, and when it does that, it usually means it’s getting ready to slide downhill. And guess what? We’ve seen this exact move before... twice. 📉
Pattern Repeat: Déjà Vu, But Profitable
Flashback 1: Way back on the left side of the chart, there was a head-and-shoulders (that’s like the market’s favorite I’m-outta-here move). It shrugged its shoulders, and then – boom – dropped about 400 pips. Nice little payday if you were ready for it.
Flashback 2: Middle of the chart, same thing. It pulled another head-and-shoulders, neckline broke at around 1.0920, and down it went about 350 pips. It’s like clockwork – see a shoulder, expect the floor to drop soon after. 🕰️
Now, Let’s Talk About This Current Setup
We’re seeing another head-and-shoulders pattern forming on the right side. And here’s the fun part: if it follows the same pattern as the last two, we’re in for a similar ride.
Neckline Level: This one's got its neckline (the line where we know things could start falling fast) around 1.0740. And look – it’s already cracked below that. This means we’re potentially heading towards our next target.
Targets 🎯
Alright, so where’s this going if it drops? Here’s the roadmap:
First Stop: 1.0460 – This level’s like a speed bump. If price respects it, we might see a little bounce, but if it doesn’t, the road is wide open for more downside action. 🚗💨
Next Destination: 1.0175 – Think of this as the next major support level. Historically, every time EUR/USD has done its head-and-shoulders thing, it didn’t just stop at the first target. Nope. It kept on trucking, usually another few hundred pips. So if you’re looking for a bigger move, this level’s worth watching. 📉
Ultimate Bear Zone: 0.9650 – Now, if we’re talking about a full-blown trend continuation, then 0.9650 is the jackpot. That’s where things could get seriously interesting. But hey, let’s not get ahead of ourselves – let’s take this step by step. 🚀
How to Play This 🕹️
If you’re looking to trade this, here’s the game plan:
Entry Point: If the price slides down to 1.0460, that’s a prime spot to watch. If it hesitates here and starts bouncing, you might see some action going back up a bit – maybe a chance to reset or take some off the table if you’re short.
But if it breaks through 1.0460 like it’s not even there? Buckle up for 1.0175.
Stop-Loss: Look, head-and-shoulders has been reliable here, but we still need to protect ourselves. Set a stop above 1.0550. Worst case? You cut your loss if the market decides to play tricks.
Profit Goals: Go for 1.0460 first, and if things are looking spicy, aim for 1.0175. And if we’re really riding this bear wave – there’s that 0.9650 ultimate bear zone waiting at the end. 🐻💰
Quick Recap
EUR/USD is giving us a déjà vu setup with this head-and-shoulders action. This pattern has been on point the last couple of times – each breakdown led to big drops, so history’s on our side. If this one plays out similarly, 1.0460 is the first floor, 1.0175 is the basement, and 0.9650... well, that’s where we hit the goldmine if the bears take over completely.
Keep it simple. Watch for those levels, manage your risk, and let’s see if EUR/USD does what it’s done before. You know what they say – the trend is your friend... until it’s not. 😉

AVAX Long Signal | 30-Min TimeframeA three-wave correction has concluded, and AVAX appears to be beginning a new bullish trend. The chart indicates the formation of an Inverse Head and Shoulders pattern, suggesting that a strong upward move may follow after the neckline breakout.
🔑 Entry: After the breakout above $35
🎯 Take Profit: $39
⚠️ Stop Loss: $33
📊 Risk to Reward: 2:1
If the price breaks above the $35 level, this setup provides a favorable opportunity to enter a long position with high profit potential and controlled risk. Technical analysis supports that an upward move is accessible, so enter carefully. 🚀

Bitcoin Inverse Head & Shoulders Target Hit!Good morning. I have talked about my inverse H&S from our daily chart quite often in past videos and post. Therefore, it is important that I also call your attention to the fact that, as of today, this inverse H&S target has been hit. Congrats to all of you who chose to hold from the break of our neckline. That would not have been an easy task.
Now, with our market hot, we need to start to prepare for some pullback. I know this is contrary to what you may be hearing and it might be that popular opinion is correct this time, but usually it is not. The market, if given opportunity, will hurt as many as it can during any counter trend price movement and so it is good to prepare accordingly.
Once the market slows down its buying, which might continue to 88k-92k (remember, my year end target has always been 88k-92k), we need to start looking for areas of pullback. There are two significant areas that price could look to retreat to.
The first is that white ascending TL around 76k. That is actually the neckline to a larger cup and handle pattern which I will talk about in another post. I could see us coming back to give that neckline a proper retest, validating its legitimacy.
The second area is lower and honestly less likely to be tested but on the weekly chart remains a possibility for us to wick down to and quickly lick. That is the 70k area, our last huge area of liquidity. For the cup and handle neckline to remain valid, this drop would have to be relatively quick. I would not see us remaining down in that area if we dropped there for more than a few days.
Enjoy all those gainz guys! 2025 will be massive. I have somehow managed to nail the year end target for 2023. Now 2024 is making me look smart. And I can't wait to start showing you all what I see coming for 2025! It will melt faces!
✌️Stew

EurUsd Analysis | Rebound in short term?The euro hit a 4-1/2-month low against the U.S. dollar as investors worried about possible U.S. tariffs which would hurt the euro area's economy. The greenback was within striking distance of the levels seen right after the U.S. presidential election against major currencies as markets focused on data and Federal Reserve speakers and waited for clarity about future U.S. policy. Analysts expect measures from President-elect Donald Trump to put upward pressure on inflation and bond yields while limiting the Fed's scope to ease policy.
However, they see investors trading on economic data and clues about the rate outlook before seeing what Trump's policies would actually be in practice. Market participants flagged that the sensitivity of the euro to the threat of higher U.S. import tariffs was evident late Friday, when media reported that Trump was lining up Robert Lighthizer, seen as a hawk on trade, to run his trade policy. However, two sources familiar with the matter said Lighthizer has not been asked by Trump to return to the agency overseeing trade policy.
That said, from a technical point of view, the pair is very interesting to follow in the short term, if we look at the 4H chart, we have reached a very important support area, so we do not exclude some bullish movement. If the pair will trigger a technical bounce it should do so with at least 3 legs, and in this case it could still form a bullish Head and Shoulders Pattern (not shown on the chart, but quite simple to imagine). The most speculative bulls are trying to take long positions on the resistance, the more cautious Traders could wait for the formation of the right shoulder taking a position with a stop loss under the Head.
Thanks for watching.

FTMUSDT - Inverse Head & Shoulders - A Prime Long Opportunity?1.) Quick Overview
On the FTM/USDT 4-hour chart, an inverse Head & Shoulders pattern is shaping up, often hinting at a bullish reversal. If the pattern completes, this could offer an excellent long setup. The key level to watch is around the mOpen at $0.6555, where the price is expected to dip and complete the “right shoulder,” potentially setting the stage for a strong bounce.
2.) Deep Dive: Chart Analysis
Inverse Head & Shoulders Pattern:
- Left Shoulder: Formed near $0.6342.
- Head: A deeper low at $0.4744, marking the low point of the pattern.
- Right Shoulder (In Progress): Expected to complete around mOpen at $0.6555. If the price touches down here and holds, it could serve as an ideal long entry point.
Fibonacci Retracement:
- The 0.382 Fibonacci retracement level aligns near $0.6555, supporting the right shoulder as a potential bounce zone.
Key Levels to Watch:
- mOpen at $0.6555: This is our primary entry level, where the right shoulder could find support.
- VAL (Volume Area Low) at $0.6324: Another important support zone where the anchored VWAP also aligns, reinforcing this area as a significant base. If the price dips below mOpen, the VAL may act as a secondary support level.
- VAH (Volume Area High) at $0.7262: Our initial target if the inverse Head & Shoulders completes, with potential for further gains.
Volume Profile:
- Increased volume near the head formation suggests accumulation, supporting a bullish scenario if the right shoulder completes as expected.
3.) Trade Setup
- Entry: Look for a long entry around $0.6555.
- Stop Loss: Place the stop loss just below $0.58 to manage risk if the pattern fails.
- Target: Initial target at $0.7262 with room for more upside if the breakout continues.
- Risk-to-Reward: Favorable setup with solid support and a high-probability bounce area.
4.) Final Thoughts
- With the combination of the inverse Head & Shoulders, support at mOpen, Fibonacci, and anchored VWAP at the VAL, this FTM/USDT setup looks promising for a long position. Watch for confirmation around $0.6555 to see if the right shoulder completes.
Disclaimer
This analysis is for educational purposes and should not be taken as financial advice. Always do your own research and manage risk carefully!

Pfizer chart is predicting bad news for the worldPfizer is showing signs of accumulation past few months which means a markup phase is coming very soon. I am assuming the market already knows some major catalyst is in the pipeline.

$MOG Shows a H & SH on 10 HR possible 40% down!Be Aware of head & Shoulders on MOG 10hr chart. could come up and retest, but if breaks down would be a 40% measured move downward if up... then the 40% to the up side with resistance, be careful

Amazon (AMZN) - Potential H&S Reversal, Watch for BreakdownOverview:
Amazon (NASDAQ: AMZN) appears to be forming a Head and Shoulders pattern, which is often a bearish reversal indicator. The left shoulder, head, and right shoulder are clearly defined, with the neckline situated near the $180-$176 zone. If the price breaks below this area, it could signal a larger move downward.
Technical Setup:
Pattern: Head and Shoulders
Neckline Support: ~$180 - $176 (critical support area)
Trendline: Red ascending trendline, currently serving as additional support
Target Zone: Potential drop toward $168 or lower if the pattern confirms
Price Action:
The recent pullback from the right shoulder aligns with the overall pattern, and a daily close below $176 could confirm the reversal.
Watch for a bounce off the neckline for a potential short-term trade; otherwise, a breakdown could lead to a deeper correction.
Risk Management:
A sustained move above the right shoulder (~$190) would invalidate the bearish setup and suggest a continuation of the uptrend.
Catalysts:
Upcoming earnings and market sentiment around consumer spending could influence the stock’s direction, potentially acting as a catalyst for the breakdown or reversal.

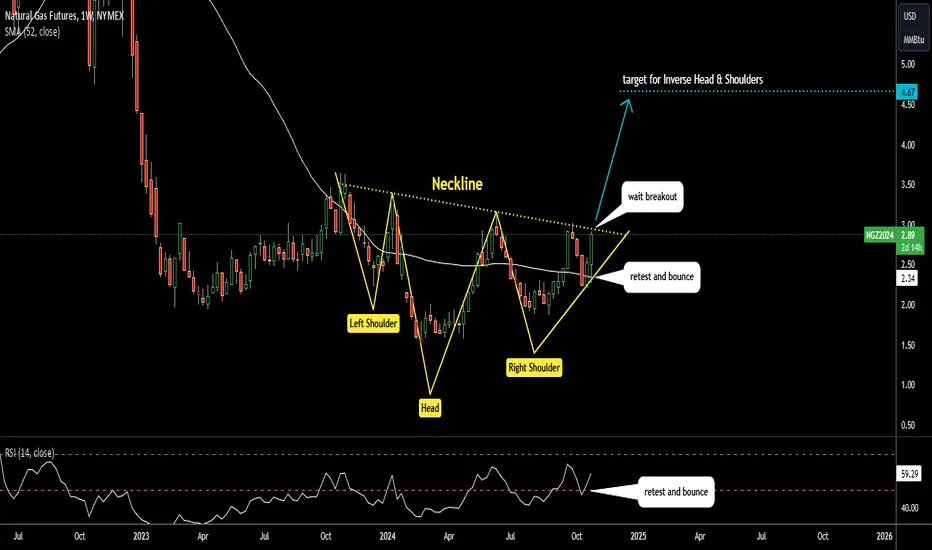
Natural Gas: Inverse Head & Shoulders targets $4.67The series of three valleys with the lowest bottom in between shaped notorious Inverse Head & Shoulders pattern in Natural Gas futures chart.
It's bullish reversal pattern.
Price eyes to break above the Neckline to trigger the pattern.
Target is located at the size of the Head added to the Neckline break point at $4.67.
Invalidation is below the trough of Right Shoulder at $1.88
Indicators support this bullish pattern:
1) RSI retested the midline and bounced up
2) Price retested 52-week MA and bounced up
VIX!!!HS, the VIX is about to crash. I'm accumulating SDIX (short VIX) and buying puts of UVXY at every short term rally. SP500 heading to ATH.

GBP/USD Bullish Reversal - Inverted Head & Shoulders FormationPattern Formation:
The GBP/USD pair is currently forming an Inverted Head and Shoulders pattern, which is a classic bullish reversal signal. This pattern indicates that the downtrend may be coming to an end, and we could see a potential upward movement upon confirmation.
Key Support and Rejection Level:
The price has shown a strong rejection from a key Support level at 1.29050 , which aligns with the 0.618 Fibonacci Retracement level. This confluence strengthens the support, suggesting that the price has found a significant bottom at this level. The repeated rejections at this zone indicate buying pressure, supporting the potential bullish setup.
RSI Analysis:
Upon analyzing the Relative Strength Index (RSI) on the 4-hour timeframe, there is a clear Bullish Divergence . While the price was forming lower lows, the RSI was forming higher lows. This divergence suggests a potential reversal in price, further validating our bullish outlook.
Entry Strategy:
An entry is recommended upon the breakout of the Neckline at approximately 1.30020 . For a more conservative approach, entering on a re-test of this level will provide additional confirmation of the breakout's validity.
Entry Point: Near 1.30020
Stop Loss: Near 1.29050 (below the support level)
Take Profit Levels:
To maximize the potential profit while managing risk, the following take profit (TP) levels are suggested:
TP-1: 1.30990
TP-2: 1.31960
TP-3: 1.32930
Conclusion:
The overall technical analysis indicates a potential bullish reversal for GBP/USD based on the Inverted Head and Shoulders pattern, support at 1.29050, 0.618 Fibonacci level, and bullish RSI divergence. An entry near 1.30020 with a stop loss at 1.29050 offers a favorable risk-to-reward ratio. The market should be closely monitored for a confirmed breakout or re-test at the neckline level.
Recommendation: Watch for a clean breakout or re-test at 1.30020 for a potential bullish entry, and follow the risk management plan by placing the stop loss near 1.29050.

NVDA Nvidia Let's take a quick look at NASDAQ:NVDA
H&S Head and Shoulders Pattern Forming Look for volume surge if the price closes below the neckline Volume has already been declining after rising through the first two peaks. This is based on a short term 30 minute chart and not financial advice.

AUD/USD 4h short ideahey everyone here is a possible head and shoulders pattern on the 4 h time frame there is a nice neckline formed the sup and res are respected in the past so now wait for the right moment especially if it is shaped go to a lower time frame to get in on time.
Have a nice day everyone!(:

GBP/USD idea short Hey everyone i have a possible idea to go short on gbpusd on the daily timeframe.
It goes like this the rising wedge pattern has been broken and is on the right track to a head and shoulders pattern if the pattern is nicely formed then go to a lower timeframe to follow the bearish trend.
Wishing everyone a good trading week!!
#bearish #headandshoulders #short

MOTILALOFS - Head and Shoulder patternAll details are given on chart. If you like the analyses please do share it with your friends, like and follow me for more such interesting charts.
Disc - Am not a SEBI registered analyst. Please do your own analyses before taking position. Details provided on chart is only for educational purposes and not a trading recommendation

Nifty 50 Index - Head and Shoulders Pattern ConfirmedOn the daily timeframe, Nifty 50 has formed a textbook Head and Shoulders pattern, signaling a potential bearish reversal. The left shoulder formed around late August, followed by a higher peak (head) in early September, and now the right shoulder is completed. The neckline has been broken at the 24,612 level, indicating further downside risk.
Key Points:
Pattern: Head and Shoulders (Bearish Reversal)
Neckline : 24,612 (Broken)
Immediate Support: 24,459
Target 1: 23,348 (measured move from the head to neckline)
Volume: Increased during the right shoulder formation, confirming selling pressure.
RSI: Currently near the oversold territory, suggesting a possible short-term relief bounce before resuming the downtrend.
Projection:
Short-term downside: The first target can be seen around 23,348, where the measured move would complete.
Risk Management: A close back above the neckline would invalidate the bearish outlook, with resistance now around 24,816.

Technical Analysis of Digital Turbine (APPS)Looking at the stock's (APPS) historical performance, we can see a long lateral phase that lasted about 10 years. It broke out of this sideways trend with a strong bullish rally, reaching a peak of around $100. After that, the uptrend ended, and a downward phase began, following the formation of a Double Top technical pattern.
The downtrend appears to have stopped near a support zone.
When zooming in with a lower timeframe, we notice that the downtrend halted around this area. The stock broke a descending trendline and formed a bullish Head and Shoulders pattern. The neckline was broken with strength, accompanied by a substantial increase in volume, coinciding with the release of earnings and revenue reports.
After the strong rally, the stock retraced and is now sitting at the Point of Control (POC) of a key volume area, which considers the entire history of the stock.
Bullish Scenario
The stock seems to be in a rebound phase after touching the POC. A continued upward movement could target the $7 area, which aligns with another significant volume area.
Bearish Scenario
If the POC area fails to hold, one could consider entering at the $1 level, which corresponds to a support area.
Note of Caution: The stock has experienced a massive loss over three years, dropping from $100 to around $1.50. Therefore, it’s crucial to proceed with caution when evaluating this stock.

WBA beautiful setup!After consolidating below $9.30 for a while, price is finally moving back towards it in an attempt to break. I really like this setup if we can break above it with initial targets at $10
Great potential for a swing! Keep an eye on this one

#GBPCHF potential reverse head and shoulder patternIn this chart, as you can see, we might be dealing with an inverse head and shoulders pattern. If confirmed, this pattern could lead to higher prices.
However, before taking any positions, it would be prudent to wait for a shift in the lower timeframe market structure toward a bullish trend to ensure stronger confirmation of the move.
