BTC Daily Time Frame H&S Price Target ~54,500I see a head and shoulders pattern has formed on the daily and 12 hour time frames with a down side target around 54,500 USD. This is a short term Bearish outlook that I believe could play out over the next 24-48 hours or less. There are potential moves to the upside, but I’m leaning toward this playing out. There are many longs that could be taken out, while the shorts flip providing major upside moves. Not financial advice. DYOR.
Head_and_shoulders

USDJPY: My First Idea For Long-termDear Trades
This is my first Idea for USDJPY.
I hope this analysis is correct. Please tell me your opinions.

SQ - Update - Potential ReversalSQ has been holding a downtrend for quite some time now; with buyers stepping in heading into earnings, we could see a nice bullish reversal coming and a breakout of the downtrend. Square's holding a massive falling wedge on the weekly timeframe, accompanied by some bullish hidden divergence on the RSI, Bollinger bands squeezing, and a huge bullish cypher harmonic pattern. Additionally, an inverse head and shoulders has formed on the 4-Hour timeframe (See Attached Charts Below). Similarly, on the daily timeframe, SQ is within a symmetrical triangle with some bullish hidden divergence on the RSI and a bullish Gartley harmonic pattern. Bullish and will be watching closely for a breakout from this wedge and triangle as buyers continue to step in (broader market conditions & earnings permitting)- Just some support and resistance levels along with some RSI-based supply and demand zones to keep an eye on in the meantime. **See Below for Price Targets, Weekly Timeframe, and Previous Charts**
PT1- $73.87
PT2- $78.82
PT3- $81.03
PT4- $86.76+
--Weekly Timeframe--
- Falling Wedge
- Bullish Harmonic Formed on the Daily & Weekly Timeframes
- Bollinger Bands Squeezing
--4-Hour Timeframe--
- Inverse Head and Shoulders
- Bullish Hidden Divergence on the RSI

IEX made bullish head &shoulderIEX made a bullish head &shoulder at the bottom now we are waiting for the breakout.
Buy IEX at 147
Target 153 155.45 158.25 163.25
Sl 138

Bonds: 10-12% further downside?Based on the TLT pattern shown here, bonds may have much further below to go.
They've continued to steadily sell off as rates have continued climbing, and show no signs of a long-term bounce.
Target 1 has been breached, leaving target 2 in the crosshairs: $86-87.

SPY - Update (From Nov. 2021)Posting an update on the SPY here as the markets closed out the week in somewhat of a make or break spot. The SPY continued to follow the bearish megaphone that it's been holding for months, while simultaneously holding the downtrend stemming from a massive head and shoulders on the SPY's weekly timeframe (See Attached Charts Below). A bearish bat harmonic pattern also formed on the SPY on Friday, as it broke below a strong support level circa $368.27 and closed near its 52-Week low at $362.17. This comes as seller volume continues to outweigh buyer volume as the markets head into a big week economically speaking. In the upcoming week, economic data and events include New Home Sales, Consumer Confidence, International Trade Numbers, Jobless Claims, and to cap off the week, GDP Numbers as well. Treading lightly here, some RSI-based supply and demand zones to keep an eye on in the interim, bearish and hedged-
--Previous Charts Attached Below--
Weekly TimeFrame
Testing Key Levels From 2020
--Previously Charted--

Bearish head&shoulder in IEX short it Short IEX bearish head&shoulder has been made in this chart sell it out or short it's future.
Sell IEX at below 150
Target 145 138 128
Sl 155
Short it don't need to buy it

SPY- Bearish Megaphone - UpdateJust posting another update here on the SPY- Bearish megaphone is playing out as previously charted. The SPY rejected its 200day SMA the other day and now the 50-day SMA has crossed under the 200-Day SMA (Death Cross). The SPY formed a bearish butterfly harmonic pattern on the Hourly timeframe as well as a big head and shoulders on the weekly timeframe (See Attached Chart Below).
Some FIB levels and RSI-based supply and demand zones to keep an eye on in the meantime, bearish and hedged- (Previous Charts Attached Below)
-- Weekly Timeframe --
-- Hourly Timeframe --
-- Previously Charted --

RIGHT PREDICTION!!!ANT FULFILLS ALL GIVEN CONDITION BY ME FOR A HnS PATTERN
Guys 10 Days ago I said without any visible right shoulder that Ant may form a head and shoulder pattern and it did exactly the same
Hits the TP with 23% Profit
Thats why I say to follow me for profitable ideas
Even I Updated the idea when got Confirmation of HnS pattern
Link of the first idea-
Link of Confirmation and entry idea-


General Pattern Failure Explained on BitcoinWhat is General Pattern Failure?
General Pattern Failure occurs when a chart pattern breaks out, fails to hit target, quickly reverses then rejects off that same breakout level back inside the pattern continuing in the opposite direction of the breakout.
Pictured above in the original chart is a normal breakout on a Inverse Head And Shoulders Pattern while the lower very right examples show General Pattern Failure on the same pattern. Note how the first example has a Bullish Retest (A) where price actually increases at the breakout while the second example is coming back inside that area and finding resistance back inside of the pattern, (Bearish Retest, (B) this then leads to price falling back inside with strong volume/momentum.
General pattern failure can also be considered a Liquidity Grab or can be referred to as a “Fake Out”.
-----------------------------------------------------------------------------------------
Other Examples:
The below image shows General Pattern Failure occuring in the opposite direction on #Bitcoin at $11000 on a Head & Shoulders Pattern.
The below image shows General Pattern Failure occuring on BNB Binance Coin (Great Example, Click the image to see the trade play out)
-----------------------------------------------------------------------------------------
Final Thoughts:
So by using the above methodology we have a potential clue here for Bitcoins next movement, I am watching the 49-50k area to see if we continue to fall or see a short term push (if we get back above the Inverse Head & Shoulders Pattern, $53000 is the next area of interest).
Learning to trade patterns such as these can provide great opportunities if you understand price action and how to identify the key areas of the pattern that other traders and investors may be focusing on too, these areas become important psychological levels on the chart that allow us to map out potential trades.

ETH- Sitting at Supply Level- UpdatePosting a quick update on ETH here as it's currently sitting at a make-or-break spot. ETH is holding quite a large symmetrical triangle here on the daily timeframe but also is rejecting both its 20 and 50-Day EMAs. ETH is also currently hugging a big RSI-Based supply level & bouncing off the .236 FIB level.
Additionally, something certainly worth noting and keeping an eye on the 4-Hour timeframe- Big Head and Sholders formed along with a bearish bat harmonic pattern (See Attached Chart Below). On a slightly different note, with pending regulations rolling out I personally would expect some further downside as the panic selling begins. Heikin-Ashi candles already depict a decrease in bullish momentum. Just some FIB levels to watch along with some RSI-based supply and demand zones to keep an eye on in the meantime- Bearish in the short-term but bullish in the long-term so will be watching closely for potential long entries, all previous charts are attached below.
- Symmetrical Triangle on the daily timeframe
- Hidden Bearish divergence on the RSI on the 4-Hour Timeframe
- Head & Shoulders on the 4-hour
- Bearish bat harmonic pattern on the weekly timeframe (See Attached Chart Below)
- Declining volume on the weekly timeframe (See Attached Chart Below)
--4-Hour Timeframe--
--Previously Charted--

Symmetrical Triangle - Gap Fill- UpdateCHWY still looking quite nice here- Big symmetrical triangle on the daily timeframe as well as what appears to be an inverse head and shoulders forming. Bullish and will be looking for a breakout from this wedge- Just some support and resistance levels to keep an eye on along with some RSI-based supply and demand zones in the meantime
- Reclaimed the 50-day EMA and seemingly looks like it will reclaim the 100 and 200-day EMA's as well
- Symmetrical Triangle on the Daily Timeframe
- Bollinger Bands Squeezing (Not Pictured)
- Falling Wedge on the Hourly Timeframe (See Attached Chart Below)
- Gap fill on the upside
PT1- $75.89
PT2- $77.94
PT3- $79.38
PT4- $80.53 + Gap Fill
Hourly Timeframe
Previously Charted

0916.hk China Longyuan Head & Shoulders breakoutAnother head & shoulders pattern breakout. While this stock has made a small retracement last week, it is still possible for this stock to retrace to the 16.50 level before making the final plunge. As of Nov. 19, 2021, this currently sits at the 100 EMA and also an important support zone.
Intermediate Price Target: 14
Final Price Target: 12

0968.hk Xinyi Solar Head & Shoulders patternXinyi Solar (0968.hk) completed a 3 month long Head & Shoulders pattern. We already have a breakout last week. We are now in the retracement phase. As this is now at a good entry-level, we're set to get in on the next red candle.
Intermediate Price Targets: 12.50, 10 ==> important support levels
Final Price Target: 8.94
Good luck!

Symmetrical Triangle - UpdateARKK catching my eye here, in somewhat of a make or break spot- Will be watching closely for a breakout from this symmetrical triangle, Just some support and resistance levels to watch along with some RSI based supply and demand zones to keep an eye on in the meantime- Bullish and looking for a breakout from this triangle
- Inverse Head and Shoulders Formed (Not Pictured)
- Slight hidden bullish divergence on the RSI
- Bullish Cypher Formed
- Reclaimed the 200-day EMA
- Buyer volume picking up relative to seller volume
- Bollinger Bands Starting to Squeeze (Not Pictured)
PT1- $120.79
PT2- $121.24
PT3- $122.45 + Breakout
Previously Charted

Ascending Triangle Forming- BullishTTD looking really nice here- Big ascending triangle forming along with a falling wedge on shorter timeframes (not pictured). Will be looking for a breakout from this triangle (Broader Markets Permitting) - Just some support and resistance levels to keep an eye on along with some RSI-based supply and demand zones - Bullish & looking for a breakout
- EMA's consolidating- sitting right on the 200day EMA
- Inverse Head and Shoulders formed on the weekly timeframe (See Chart Below)
- Bollinger Bands Squeezing on the weekly timeframe as well
- Bullish Gartley formed on the daily timeframe (Not pictured)
- Slight bullish divergence on the RSI
PT1- $74.33
PT2- $76.55
PT3- $78.33
PT4- $83.34
Weekly Timeframe-

Falling Wedge- BullishCHWY really catching eye here, big falling wedge on the daily timeframe and finally starting to break out of a long downtrend it has been holding for quite some time. Bullish and will be looking for a breakout from this wedge- Just some support and resistance levels to keep an eye on along with some RSI-based supply and demand zones in the meantime
- Reclaimed the 50-day EMA and seemingly looks like it will reclaim the 100 and 200-day EMA's as well
- EMA's all starting to curl upwards as well
- Gap fill on the upside
- Buyer volume picking back up relative to seller volume - Finally not hovering in oversold territory
- Inverse head and shoulders formed on shorter timeframes (Not Pictured)
PT1- $75.89
PT2- $77.94
PT3- $79.38
PT4- $80.53 + Gap Fill

Update | Inverse H&S- BullishVery bullish on SEDG here along with many others in the sector- while certainly a longer-term play, will be watching for a breakout. ICLN & TAN look ready for a breakout as well (attached below along with previous chart)- some bigger support and resistance levels to watch along with some RSI based supply and demand zones to keep an eye on- Bullish all the way and looking for a breakout here
- Inverse Head and Shoulders formed (Orange Neckline)
- Ascending triangle forming on its yearly chart
- Sitting right on its 100-day EMA with the rest starting to curl upwards
- Bollinger bands are starting to squeeze (not pictured)
- Slight hidden bullish divergence on the RSI accompanied with buyers volume starting to pick up relative to seller volume
PT1- $279.50
PT2- $287.52
PT3- $294.32 + Breakout
ICLN
TAN
Previous Charts

WOO has just formed a #head$shoulder at the bottomIn 1h time frame, the downtrend line in major pivots has been broken, the head is just lying on the support2 zone of the #PIVOT_POINT_STANDARD and the shoulders on the S1.
So after all I expect 25 to 30% pf profit if the black line breaks strongly.
The SL may be the head, if you are midterm and the shoulders if running a short term strategy.
Attention: It's better to have the risk and property management according to the main market situation now

XRP Head and ShouldersXRP has possibly leveled out a shoulder pattern on the 1 hour chart. I'm not sure its 100% because the right leg of the head triangle dips down. We could wait and if we do an angled head and shoulders we'd still need more downward corrective action for completion.

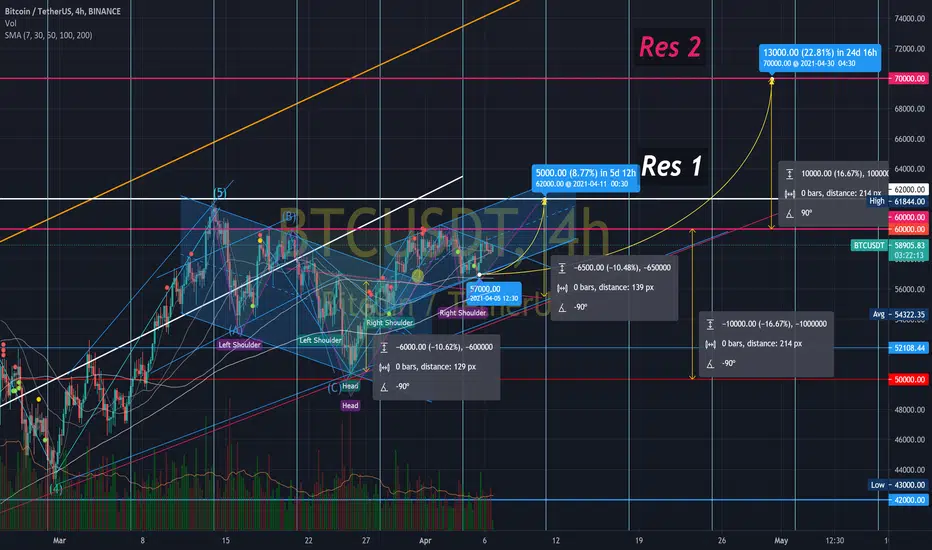
Fasten your seat belt!Fundamental Bitcoin is in great shape and new companies are embracing the currency and joining the rally.
The bitcoin chart also sends powerful pump signals.
Green Head-and-Holders brings Bitcoin to $ 62,000; Then another head-and-shoulders will be formed, which I marked in purple. The purple head-and-shoulders are $ 10,000 high and should push the price to around $ 70,000 in less than a month.