NZDUSD Head & Shoulders Buys??As I explained in my previous post, everything seems to be working out fine, and in profit.
We are looking for a break above the neck and possible retest to add more longs.
Headandhsoulders

NVDAPossible head and shoulders set up. I think we bounce here off the neckline back to around 460. This is just from a technical view news could possibly alter this but I was right on the recent drop to 420 so I think a move back to 465 should be appropriate and NVDA makes large 20pt moves like nothing so its really not that big of a move in reality.

TSLA: Bearish Harmonic Test of Neckline To Bring it Down to $25TSLA after bouncing back up thanks to a Bullish ABCD with Bullish Divergence is now backtesting the Neckline area of a Bearish Head and Shoulders while Filling a Gap at the PCZ of a now Bearish ABCD that it's formed on the way back up a leading into this zone and now it may make its way back down to about $25.00

ADBE - Good 'Ol Head & Shoulders ADBE is forming a Good old classic Head and Shoulders pattern at the top.
I would wait for the that tiny little gap to fill on the top and build short position.
Short Entry between 535-540
Downside Target#1 - 440
Downside Target#2 - If you are really lucky, 395

ANKRUSDT Inverse Head And Shoulder!ANKRUSDT Technical analysis update
Buy zone : Below $0.0206
Stop loss : $0.0197
Take Profit 1 : $0.0214
Take Profit 2 : $0.0228
Take Profit 3 : $0.0246
Take Profit 4 : $0.0275
Always Keep Stoploss
Thanks
Hexa

NZDJPY PRICE ACTION TRADING INV. HEAD AND SHOULDERS Hello Trader,
I hope you've had a successful trading week so far!
Let's have a closer look at NZD/JPY.
It's displaying a price action reversal pattern, specifically an inverse head and shoulders, on its hourly chart. Currently, the price is trading near the neckline breakout at 86.939.
Stops are set at the mid-right shoulder:
ST: 86.550
Target 1:
- 62%: 87.662
- 79%: 87.852
Target 2:
- 127%: 88.413
- 162%: 88.815
All traders, if you find this idea valuable, please support with a like and follow for more insights!
Best wishes for your trades!

How to trade head and shoulder pattern? As a forex trader, it's essential to have a robust arsenal of technical analysis tools at your disposal. One of the most powerful and reliable chart patterns you can use is the "Head and Shoulders" pattern. This pattern is prized for its ability to signal potential trend reversals, allowing traders to make informed decisions and capitalize on market opportunities. In this comprehensive guide, we'll delve deep into the Head and Shoulders pattern, breaking down its components, identifying its variations, and learning how to trade it effectively.
Understanding the Head and Shoulders Pattern
The Head and Shoulders pattern is a classic reversal pattern that forms after an extended uptrend, signaling a potential change in market direction from bullish to bearish. It consists of three peaks, with the middle peak (the "head") being higher than the other two peaks (the "shoulders"). The pattern typically unfolds as follows:
1. The Left Shoulder
- The left shoulder represents the first peak after a strong uptrend.
- This peak is typically followed by a minor retracement, creating the first trough.
2. The Head
- The head forms after a brief rally from the left shoulder's low point.
- It represents the highest peak in the pattern and usually exceeds the previous peak.
- After reaching this peak, the price retraces again, forming the second trough.
3. The Right Shoulder
- The right shoulder is the third and final peak in the pattern.
- Like the left shoulder, it is lower than the head and forms after a minor rally.
- The right shoulder's high is followed by a retracement, creating the third trough.
Key Characteristics of the Head and Shoulders Pattern
To effectively identify and trade the Head and Shoulders pattern, it's crucial to understand its key characteristics:
1. Symmetry
- The left and right shoulders should be roughly symmetrical in terms of height and width.
- The head should be the highest point in the pattern.
2. Volume
- Volume plays a vital role in confirming the pattern.
- Volume should generally decline as the pattern forms and then increase as the price breaks below the neckline (more on this later).
3. Neckline
- The neckline is a trendline drawn horizontally connecting the low points of the left and right troughs (the shoulders).
- The neckline serves as a critical level of support. A breach of this level confirms the pattern.
Trading the Head and Shoulders Pattern
Trading the Head and Shoulders pattern involves two main steps: identification and execution.
Identification:
1. potting the Pattern: Begin by identifying a well-defined Head and Shoulders pattern on your forex chart.
2. Volume Confirmation: Ensure that volume decreases as the pattern forms and increases upon breaking the neckline.
3. Neckline: Draw a neckline connecting the lows of the left and right shoulders.
Execution:
1. Entry Point: Place a short trade when the price breaks below the neckline. This serves as a signal that the pattern has confirmed.
2. Stop-Loss and Take-Profit: Set a stop-loss order above the right shoulder and a take-profit order based on your risk-reward ratio.
3. Risk Management: Be mindful of risk management, and never risk more than you can afford to lose on a single trade.
Variations of the Head and Shoulders Pattern
While the classic Head and Shoulders pattern is powerful, variations can offer additional insights:
Inverse Head and Shoulders:
- An inverse Head and Shoulders pattern signals a potential bullish reversal.
- It comprises three troughs with the head being lower than the shoulders.
- The pattern is confirmed when the price breaks above the neckline.
Complex Head and Shoulders:
- Complex variations may have multiple heads or shoulders, making them harder to spot.
- Despite their complexity, they follow the same principles of confirmation through neckline breaches.
Conclusion
The Head and Shoulders pattern is a valuable tool in the forex trader's toolkit. By mastering its identification and execution, you can gain a competitive edge in the market. Remember that no pattern is foolproof, and risk management remains paramount in forex trading. As with any technical analysis tool, it's essential to combine the Head and Shoulders pattern with other indicators and analysis methods for a well-rounded trading strategy. So, start practicing, keep refining your skills, and always stay informed about the latest market developments to become a successful forex trader.

GBPUSD: head and shoulders patternThe GBP/USD has broken a long-standing upward trendline and formed a head and shoulders pattern. Therefore, I expect the price to fall to the next significant support level.
Daily:
If you find it useful, like, follow, share!
Good trading!

S&P 500 Head & Shoulders on the DailyThe SPY (S&P 500 Index) resembles a quite clear Head & Shoulders Pattern which is generally bearish. The daily candle chart shows a right shoulder forming with a rejection from the $445 area. With this rejection and a continuation downwards, we could see a harder fall if this aligns with the left shoulder and follows the pattern.
The other main indices also follow a similar pattern formation and could follow with a market downturn. Watching that $445 level is key to see a confirmation retest and rejection downwards. Following the lower levels, some price targets would first be the neckline as shown on the chart posted. A break below the neckline could result in a fall of the S&P 500 and if following the complete Head & Shoulders we could be seeing a realistic price target of the $410-$420 area.
Other than technicals fundamentals are definitely quite alright for the market as of now. But maybe a little too alright in my opinion. We have seen a market melt up with interest rates still sky-high resulting in more risk-ON investing rather than investing in CD's or Treasuries offering up to 5.5%.
The Greed being shown in this market is definitely visible and is something to keep note of if we break the neckline. Fear & Panic Selling could most definitely occur in this type of situation especially considering the market rally we've seen this summer.
Seasonally the fall has been quite bearish for the markets overall, and as we head into September & October we could see a similar trend to the past, but nothing is sure.
Lastly, in September / October Student Loan Repayments are resuming which could suck out millions if not billions of dollars from the United States economy as young adults chip away at debt and sacrifice spending on goods & services. This will most definitely be a crucial effect on the economy and could send markets downwards.
Keep an eye out for this pattern to play out... Definitely something to watch as we move in to Fall!
Thanks

🔥 SOL Weekly Inverse Head & Shoulders Break Out: Path To $200SOL has seen some incredible gains recently, gaining 100% in 4 green weeks. My most recent SOL signal was a great success, congratulations if you took the trade.
In this analysis we're going to zoom out and take a long-term look. As seen on the chart, SOL has broken out of a bullish inverse head & shoulders pattern.
In my eyes, this could very well be the start of a new bullish phase where SOL will shine.
I'm looking at a long-term target of 200$, stop just below 20$. This gives us an amazing long-term trade with great risk to reward. Consider taking some money off the table around 100$ or so.

CADJPY, SHORT term sell opportunity Price action is failing to break above a critical area which is showing bearish movement. We can see price has approached a double top level that has been rejected and impulsively pushed downward printing a possible H&S pattern within a larger corrective structure.
Looking for a short opportunity to bottom boundary around 103.00
Trade Safe

BluetonaFX - GBPUSD HEAD & SHOULDERS IDEAHi Traders!
We have a Head & Shoulders trade setup here on GBPUSD 1D chart.
The market looks to be approaching the neckline and we are now looking for a break and close to the neckline with momentum to target lower levels.
If we get a break and close of the neckline, we have the profit target level at 1.21761 and if you want to hold on for a larger risk reward trade, our second target level is at 1.20156.
The ideal entry point is to either wait for a break and close to the neckline or to wait for a break with a retest of the neckline.
On the other side of the trade, if we fail to break and close below the trendline, we will most likely stay in the range as there is a current lack of bullish momentum.
We will keep a close eye on this and will update you if we get any further action on this setup.
Please make sure you give us a like, follow and comment.
Thank you for your support.
BluetonaFX

ADA GREAT Long OpportunityAs shown in the chart this is an inverted head and shoulders pattern.
Most often price will reach the 1:1 extension of the distance between the Head and the neck line (shown by the yellow line) taken from the top of the right shoulder.
The stop loss is placed below the tip of the right shoulder.
Entry = 0.3748
Take Profit 1 = 0.4755
Take Profit 2 = 0.5543
Stop Loss = 0.2921
The fundamentals at the moment are really bearish, so I won't be taking this trade, but it could be a good option to enter this to hedge some risk if you are shorting other coins at the moment.
Not financial advice, intended for educational purposes only

$BTCUSD - Inverted head and shouldersHi guys! 👋🏻
🔔 I've been tracing and waiting for the formation of the right shoulder of this Head and Shoulders formation.
🔔 At this stage, Bitcoin may return to levels near $22770 - $22400 and continue the uptrend up to $29900 - $32000
✊🏻 Good luck with your trades! ✊🏻
If you like the idea hit the 👍🏻 button, follow me for more ideas.

Bitcoin is Simply Retesting Previous Support, Now ResistanceTraders,
I am hearing many, if not most, technical analyst now swinging back to the bullish side. But there are a few things that cause me to be wary of such sentiment just yet:
#1 - The attempt by the bears to reach our target down on that H&S pattern, was weak. 25,8k was NOT the final target. I expect 25.2k at least. Maybe even a wick down to 24.2k before we get any kind of green flag again.
#2 - Every new high on the daily is simply a lower high, which means that the trend is still our friend. And since mid-April, the trend has been to the down side.
#3 - We are now testing the underside of the neckline to our H&S pattern. This is to be expected and only confirms the validity of the H&S pattern. Unless/until the bulls were to break back above that neckline and confirm, the H&S pattern would not be invalidated.
#4 - The recent move up this past week or so simply looks like a bear flag to me, indicating we still have further to travel down.
We'll see how alts continue to fair with BTC expected continuation to the down side. If they remain strong, I will continue to enter trades as we approach our BTC retest target of 25,200.
Best,
Stew

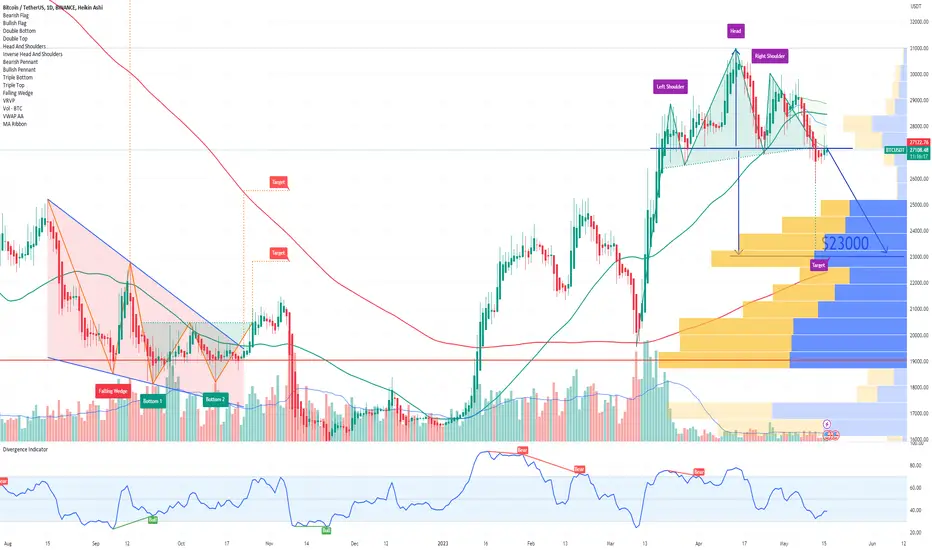
BTC Bitcoin Head and Shoulders Chart PatternIf you haven`t sold the Big Head and Shoulders Chart Pattern:
Now BTC Bitcoin is in a similar situation with a smaller regional H&S of which Price Target is $23000.
Looking forward to read your opinion about it!
BTC: Head and ShouldersDrop on the horizon.
Volume is looking so bad.
Weekly RSI pointing down.
Head looks like Bart Simpson formation.
Twitter full of moonboys at the moment.

🔥 PEPE Potential Inverse Head & Shoulders: Bottom Is In?After a massive decline, and corresponding pump from the 100 area, PEPE has yet again found resistance around 210 (omitting the zeros for readability).
I think that the bottom is in, for the short-term at least. Potentially, PEPE will form an inverse head & shoulders pattern, which is a bullish reversal pattern.
Ideally, the price will move back towards the yellow area, which is the same area where the left shoulder bottomed las week.
If the yellow area holds, the probability of this pattern playing out increases by a lot. Patient bulls will wait for price to break through the neckline around 210. Aggressive bulls will buy in the yellow area.

BTC 1D Head and Shoulders formedI tried to explain this the other day, but I made a mess, being tired and sleep deprived.
First, I noticed the H&S forming on the 1W timeframe, shown by VWAP.
Although it's an intraday indicator, I also leave it on bigger timeframes for this purpose. It showed a pattern IN the candles.
I tried at that point to draw it on 1D, but the pattern wasn't so obvious, so I did it on 2D, where it was more pronounced.
When I published the idea, I left the 1D chart on and started talking about 2h instead of 2D.
But, If you look at that idea now, You will see that the pattern is fully formed and clearly visible on 1D.
The idea from the other day is linked below.
Targets remain the same.
If the 27k resistance doesn't hold, we have a hole on VPVR down to 25k, and the full potential of the pattern corresponds with the bottom of the 23k-25k range.
On my trend waves indicator at the bottom, the ribbon turned bearish (purple), the selling aggression is intense (grey wave), and Binance has problems with withdrawals...
If we don't get rejected at 27k, which is possible, judging by the smaller timeframes, we could have quite a pullback.

Potential Quasimodo Reversal hereSecond shoulder wicked above the first shoulder high so may be invalidated but heavy rejections off this shoulder could mean a little reversal here.

BTC 15m Head and Shoulders with neckline on VWAPHead and Shoulders fully formed in 15 min timeframe. Neckline is a VWAP that is being broken and retested at the moment. The target price of the formed pattern is below 28650, which is the beginning of a VPVR gap on the right. Fibonacci 1.618 regression support is at 28300, a target price of the bear flag I posted about yesterday. You can see it in the link below.

BTC 15m Head and Shoulders and 1H Double Top on the Trend WavesWe can use candle patterns on the oscillators too. On 1h my waves oscillator, we have a double top, ideally rejected from the 70 lines, and it broke down the neckline.
A pullback in strength could go below a zero line. In that case, aggression (grey wave) would be rejected in the area of -50 to -70.
The head and shoulders pattern formed on a 15m timeframe, and it retests the neckline at the moment of writing this, with a possible drop to 30300 right through the hole on VPVR on the right.
Again, the fact that I remain bearish should not change the fact that trading against the trend is a big NO-NO.

AUDUSD, SHORTPrice action is setting up for sellers to take control as we could see a potential H&S pattern printing within the bear flag structure stsrting from the strong impulse down at the double top range.
Wait for bearish confirmation before entering a sell position.
Thanks
Trade Safe
