EURJPY: Classic Bullish Pattern 🇪🇺🇯🇵
There is a high chance that EURJPY will continue growing.
A bullish breakout of a neckline of an inverted head & shoulders
pattern leaves clear bullish clues.
Next resistance - 171.9
b]❤️Please, support my work with like, thank you!❤️
I am part of Trade Nation's Influencer program and receive a monthly fee for using their TradingView charts in my analysis.
Head and Shoulders

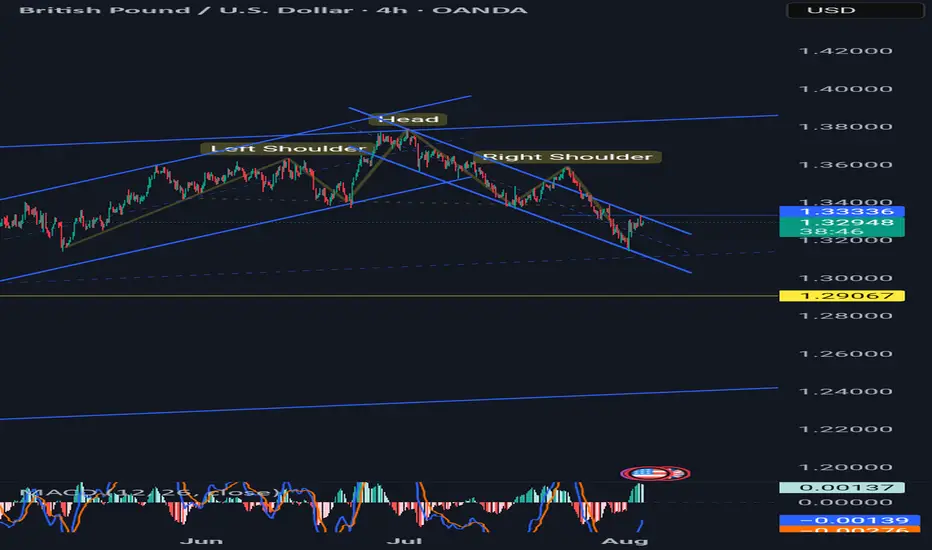
GBPUSD 4H: retest done - bearish continuation beginsOn the 4H chart, GBPUSD has completed a textbook head and shoulders pattern. The neckline has already been broken, and the price is now finalizing a retest around 1.3365–1.3380, where the 0.5 Fibo level also lies. This confirms a trend reversal, with the market preparing for the next leg down.
MA and EMA are above the current price, adding pressure to the downside. RSI remains neutral, and volume is shifting in favor of bears. The key resistance zone at 1.3365 has been tested from below, and the price is beginning to roll over - a classic bearish continuation signal.
Targets: 1.3240 first, then 1.3150 and potentially 1.2 870 if momentum builds. The invalidation point is a close above 1.3365, which is not likely at this stage.
Fundamentals support the move: the dollar remains strong as the Fed holds its hawkish stance, while the UK economy continues to show weakness across services and manufacturing.
Neckline broken ✅
Retest done ✅
Momentum building ✅
The setup is complete — time to follow the structure.

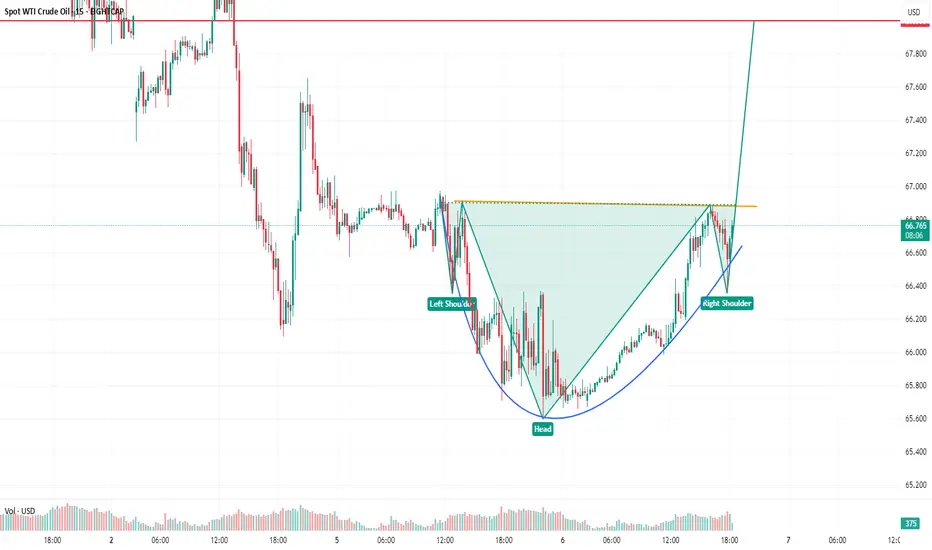
WTI Spot crudeinverted head and shoulder observed if breakout given target too in chart. Not a sebi registered analyst . No buy, sell and hold recommendation personal view.
EURJPYBroke out of a strong daily/H4 resistance zone, retested multiple times with inverse head and shoulder forming on the H1.

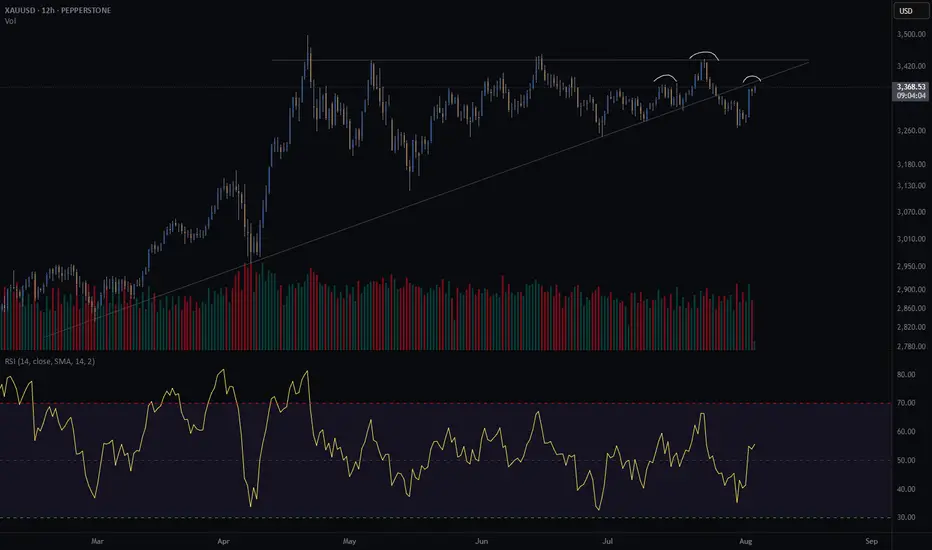
Gold crash (SHORT) - head and shouldersGold is at an interesting crossroad.
It broke through its diagonal support on Friday the 25th of July.
Price is retesting previous support. Does it turn into resistance?
Further confluence is a head and shoulders of the H8 and H12, with the right shoulder coinciding with the retest of the diagonal.
Since I am long gold with my investments, I am hesitant to short gold through my trading business. However, if my pattern is available, I take the trade. This will be a very short term trade - a few days at most if the trade goes in my favour.
Risk/reward = 12.6
Entry price = 3382.5
Stop loss price = 3396.2
Take profit level 1 (50%) = 3230
Take profit level 2 (50%) = 3181
The risk reward is exceptionally high. However, I have taken a more conservative approach with my entry because of my apprehension to short gold. For this trade I will enter at the extreme end of the range in which I will look for entries. This is the reason for such a high RR. It might result in me missing an entry.

Many attempsInverse HS forming to break out the 67 resistance area. More than a year trying to break it, and now is forming a super bullish pattern to get over with it. Once it breaks it, will just go up. Hold this for a few months. SL if a weekly candle closes below the support area.
Waaree energyies ready for warWaaree energies forming head and shoulder pattern waiting for neckline to break.After that target will be 1200 points atleast. This target is long term target it may take atleast 13 weeks after break out.
So target is 4400
Neckline 3200
Wait for 3400 for safety after that take the trade for the target of 4400.

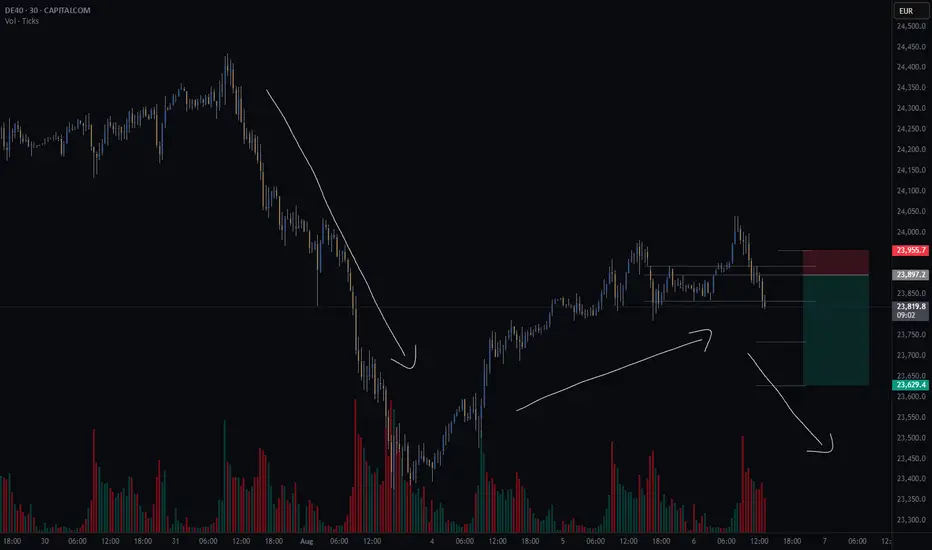
GER40CASH (DE40) - potential short - HSThere is a potential head and shoulders continuation pattern.
What I like about this setup is the GER40 is potentially creating a bear flag.
Finding a continuation pattern within the bear flag, like the head and shoulders, is a great entry point for the second part of the downward move.
Still waiting for my system to confirm some variables before I take the trade.
Risk/reward = 4.3
Entry price = 23 905.3
Stop loss price = 23 955.4
Take profit level 1 (50%) = 23 733
Take profit level 2 (50%) = 23 628
HEROMOTOCO accelerating into a bullish breakout– momentum trade!This is the Daily chart of HERO MOTOCORP LTD.
Hero MotoCorp has formed a Head & Shoulders pattern, and the stock has recently given a breakout above the neckline. It has also retested the shoulder zone, confirming the breakout and it's shoulder pattern target is 4800 and head pattern target is 5750.
HEROMOTOCO having a good support zone near at 4100-4200.
If this level is sustain then we may see higher prices in HEROMOTOCO.
Thank You !!

Next predictions for ZoraI see two scenarios for Zora on the chart, one scenario is a head and Shoulder pattern , which pushes Zora down .
and the next scenario is the possibility of another bullish wave.

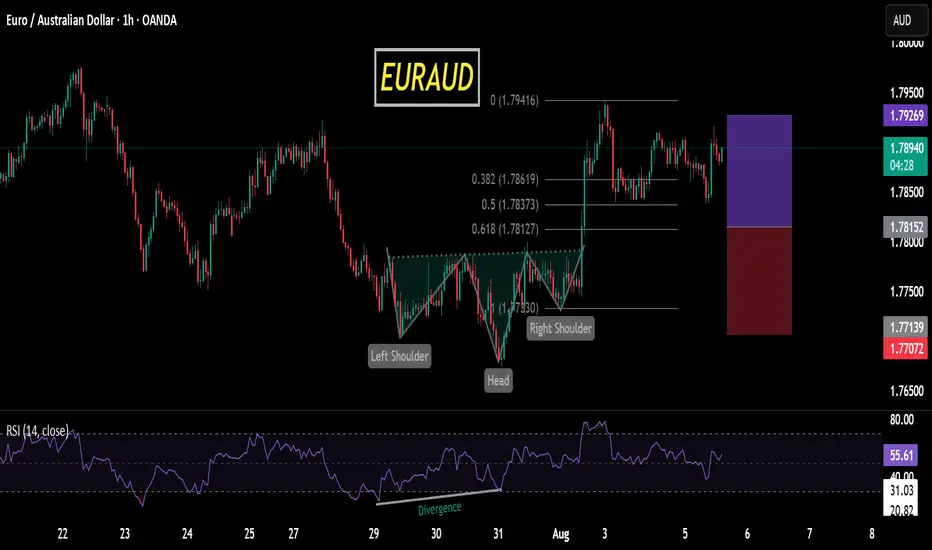
GBPUSD SHORTFibonacci retracement on the daily. Looking for two entries here. One at 38.2%, as it has retested this zone and didn’t break through. Another at 50% (resistance zone) where it broke through the H&S

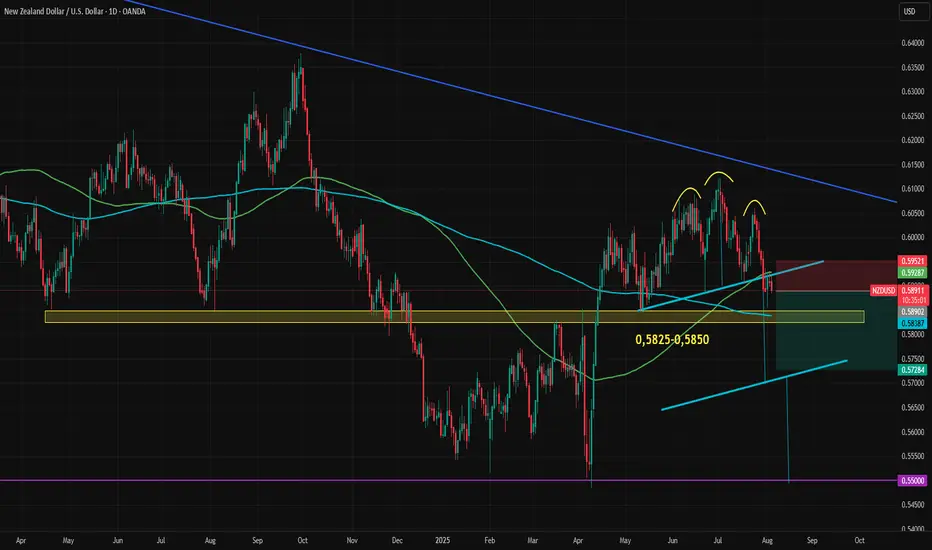
NZDUSD Stuck with Conflicting SignalsNZDUSD is at a key technical junction. The previously broken and retested head and shoulders formation is exerting downward pressure, but the important support zone between 0.5825 and 0.5850 is holding for now. The 100-day and 200-day moving averages have also formed a tight support-resistance range, causing the currency to remain trapped in a narrow range.
Both the Federal Reserve and the Reserve Bank of New Zealand are expected to cut rates twice this year. Growth expectations for 2025 are closely aligned, with only a 0.3-point advantage for the U.S., and the gap is narrowing. Inflation expectations are also similar, with U.S. figures slightly higher, mirroring the GDP trend.
The 2-year bond yield spread between the U.S. and New Zealand has remained flat since April. During that time, NZDUSD climbed from 0.55 to 0.61 before pulling back to the current level near 0.5890.
Similar fundamental statistics and conflicting technical signals have caused NZDUSD to form an uncertain range between 0.5930 on the upside and the 0.5825–0.5850 support zone on the downside. If either of these key levels breaks, volatility may return quickly.
A break above 0.5930, which coincides with both the broken neckline and the 100-day moving average, could push the price toward the descending trendline from the 2021 top (highlighted in blue on the chart). On the other hand, a break below the 0.5825–0.5850 zone which also includes the 200-day moving average, could trigger a move toward the head and shoulders pattern target, currently near 0.57.
The first two weeks of August will be crucial for the dollar index, following the sharp downward revision in payrolls data. Market reaction, revisions to expectations, commentary from Federal Reserve members, and the release of July inflation data will provide greater clarity. This wave of information could finally break NZDUSD out of its current indecisive range.
ETH - next 10 days longHello traders :) My technical analysis according to market sentiment.
~~~ 4000 USD for ETH is crucial to cross and stay above
(ratio for this price is 0.035 BTC/ETH and BTC 115 000k ~~~
BTC.D -> going down 61.66% (we touch PoC 65% and now going slowly down, we need to go down below 60% for real altcoin season )
BTC/ETH is going up (currently we reached PoC - 0.032, targets 0.05-0.08),
USDT.D -> going down (PoC - 4.25 %, should be arround 2.2% when we peak bull market - can be extended to 2026)
BTC.D
ETHUSD
USDT.D
ETHBTC
If ratio for BTC/ETH is arround 0.05 and BTC has value 135000 USD , then ETH can reach 6800USD which is very reasonable price to reach.
BTC goes sideways 110k-118k , ETH need to go up and cross main resistance 4000 USD.
We can continue bull market for next 2-4 months.
Write me if you want what do you think about this progress ?
Best regards
Norbert

The next big moveMarket would be all way down soon, head are shoulder was identified at the chart, identifying a market reversal confirmation, further down moves are to be seen
Another formation of head and shoulderSolano possibly forming a head and shoulder weekly pattern. Watching the support is critical which confirms the head and shoulder pattern and a reversal opportunity to a lower target such as the trendline support or even lower. An invalidation of the left shoulder open opportunity to break out the ATH and target higher. The weekly moving average holding a support at the moment and price didn't dip lower. Keeping major economics in mind the higher highs and expectation of cutting interest rate could invalidate the head and shoulder pattern.

Bearish Divergence on Bigger tf
CMP 105228.47 (02-06-2025)
Bearish Divergence on Bigger tf (Cautious
approach should be taken).
However, if 109350 is Crossed, we may
witness 115000 & then 120000 - 121000.
and if 112000 is crossed & sustained, be ready
to get New Highs :-)
Lets be more cautious & dig out 3 Important
Support Levels.
S1 around 103000 - 102500
S2 around 97800
S3 around 93400 - 93500.

Choppy week NZDUSD BuyHello traders I hope you are doing well
As you can see the inverted head and shoulders.
Multiple touches on the top trendline.
Lets just be patient and let the market come to us.

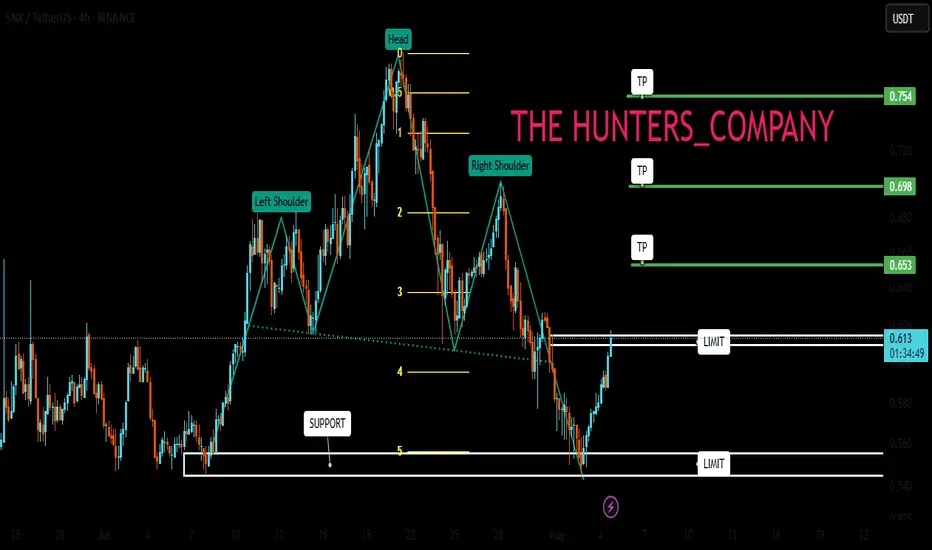
SNX : Has the climb started?Hello friends🙌
👀According to the shoulder and shoulder pattern that was formed and then the price fell in the support area that we identified for you with Fibonacci, buyers entered and provided good support for the price, which also broke our resistance, which creates a good opportunity to buy, of course with risk and capital management.
🔥Follow us for more signals🔥
*Trade safely with us*
Short Volatility during rare spikes using leveraged ETF $UVXYOverview
Volatility represents how greatly an asset’s prices swing around the mean price. Historically there are rarely brief volatility flare-ups that present trading opportunities. Trying to anticipate volatile events can be costly, because other market participants generally expect the same well known events, and one never knows how big a volatility spike might arise from a given event. Instead if one merely awaits extreme volatility events, which historically are ephemeral, there's a higher probability trade in shorting it. I've thought about this previously, and took the opportunity with Liberation Day to successfully short volatility.
Volatility Instrument Selection
Choosing an appropriate instrument can aid in the likelihood of a successful short position. Among the options CBOE:UVXY looks attractive for the trade, because it's a leveraged ETF, is highly liquid, and provides options with granular strike prices and expiration dates. Leveraged ETFs are known to decline over time due to
Daily rebalancing and compounding effects
Volatility drag
Cost of leverage
Management fees and expenses
Path dependency
These characteristics of leveraged ETFs provide a structural tailwind to a short position, because the instrument naturally declines over time. This phenomenon easy enough to see on a CBOE:UVXY weekly chart
Moreover selection of a liquid product is prudent. At the time of writing CBOE:UVXY has an average daily volume north of $22 million dollars for the past 30 days.
Trade execution
Execution of the trade starts with recognition of a highly volatile event, this is both technical and discretionary. From there a trader is advised to use their preferred tactics to select entry, stop-loss and exit points. Personally I like to use chart patterns across different timeframes in tandem with Relative Strength Index, and to a lesser extent volume to identify trading setups. I use longer term charts to identify a trend, and shorter timeframe charts to determine entry and exit points. The timeframe(s) depend on the particular instrument and what the charts look like at the time of the trade.
During the Liberation Day Volatility Short trade, I've been using 1W, 1D, 4H and 1H charts.
The 1H chart has been suitable for entering an exiting trades. Head & Shoulders patterns have manifested both on price and momentum alongside declining volume. I've posted a couple CBOE:UVXY minds along the way.
Additional Thoughts
Volatility can also be used generally to anticipate moves in other asset classes, such as stocks, bonds, crypto and commodities. Using the levels from that last chart fed into successful NASDAQ:TQQQ & NASDAQ:SQQQ trades in the aftermath of Liberation Day.

dxy (long)
we have an inverse head & shoulder and we have currently retested the neckline to push futher to the upside.
