ADM | Inverse Head & Shoulders + Parallel Channel = Reversal📍 Ticker: NYSE:ADM (Archer-Daniels-Midland Company)
📆 Timeframe: 1D (Daily)
📉 Price: $48.74
📊 Volume: 2.82M
📈 RSI: 54.80 (Momentum building)
🔍 Technical Setup:
NYSE:ADM is completing a textbook Inverse Head & Shoulders at the bottom of a rising channel, hinting at a structural reversal.
🟢 Green arrow signals current buying opportunity
🔺 Red arrows highlight expected resistance zones on the way up
🟣 Channel provides a clean roadmap for a stair-step recovery structure
Pattern Highlights:
Well-defined L–H–R shoulders
Price reclaiming the midline of the channel
RSI recovering above 50, signaling shift in momentum
🧠 Trade Plan & Price Targets:
✅ Entry Range: $48.50–$49.00
❌ Stop-Loss: Close below $46.00 (invalidation of channel + pattern)
🎯 Target 1: $52.50
→ 📈 Return: +7.7%
🎯 Target 2: $56.50
→ 📈 Return: +15.9%
🎯 Target 3: $63.00
→ 📈 Return: +29.3%
⚠️ Technical Notes:
Pattern is visible across multiple timeframes — weekly structure aligns with daily bullish reversal
RSI breakout + neckline test = potential breakout confirmation
Earnings volatility in rear-view mirror – momentum favored near-term
💬 Is ADM finally turning the corner after months of weakness?
📌 Like & Follow for more structured swing setups!
#TargetTraders #ADM #HeadAndShoulders #ChannelBreakout #SwingTrade #InverseHnS #TechnicalSetup
Head and Shoulders

HE | Inverse Head & Shoulders Breakout Setup / target +13%-56%📈 Ticker: NYSE:HE (Hawaiian Electric Industries)
📆 Timeframe: 1D (Daily)
📉 Price: $10.59
📊 Volume: 1.23M
📈 RSI: 50.96 (Neutral, ready for breakout)
🔍 Technical Setup:
A classic Inverse Head & Shoulders has formed just above the lower boundary of a multi-month parallel ascending channel.
🟩 Key Features:
Symmetrical reversal structure (L–H–R Shoulders)
Horizontal neckline around $12.00
Trading just above channel midpoint with supportive RSI action
🟢 Green arrow marks support near $10.50
🔴 Red arrows signal likely resistance areas
🧠 Trade Plan & Price Targets:
✅ Entry Zone: $10.50–$10.70
❌ Stop-Loss: Below $9.90 (channel breakdown + structure failure)
🎯 Target 1: $12.00
→ 📈 Return: +13.3%
🎯 Target 2: $13.80
→ 📈 Return: +30.3%
🎯 Target 3: $16.50 (upper channel resistance)
→ 📈 Return: +55.8%
⚠️ Technical Notes:
RSI at 51 – neutral zone, ready to build momentum
Volume declining — watch for breakout surge above $11.50
Channel provides structure for swing trades and scaling
💬 Is HE about to energize a trend reversal or flicker out?
📌 Comment your thoughts and follow for more high-conviction setups!
#TargetTraders #HE #Utilities #InverseHnS #BreakoutTrade #SwingTrading #TechnicalAnalysis

TATAMOTORS | Buy above 755 | SL below 700 | 1st Target 940Disclaimer:
This is not financial advice. Please do your own research or consult with a financial advisor before making any investment decisions. Investments in stocks can be risky and may result in loss of capital.

SHORT ON SPY (SPX/USD)SPY has failed to create higher highs and given us a head and shoulders pattern.
I will be selling spy to the next level of demand looking to catch 50-60 points.

INFY | Buy @LTP | SL below 1525 | Targets 1880, 2000Disclaimer:
This is not financial advice. Please do your own research or consult with a financial advisor before making any investment decisions. Investments in stocks can be risky and may result in loss of capital.

EURAUD: Pullback Trade From Support 📉EURAUD appears to be bullish following a test of significant daily/intraday support.
An inverted head and shoulders pattern has formed on the 4-hour chart, and strong bullish momentum observed this morning suggests positive movement.
I believe the market may retrace to the 1.7600 resistance level.

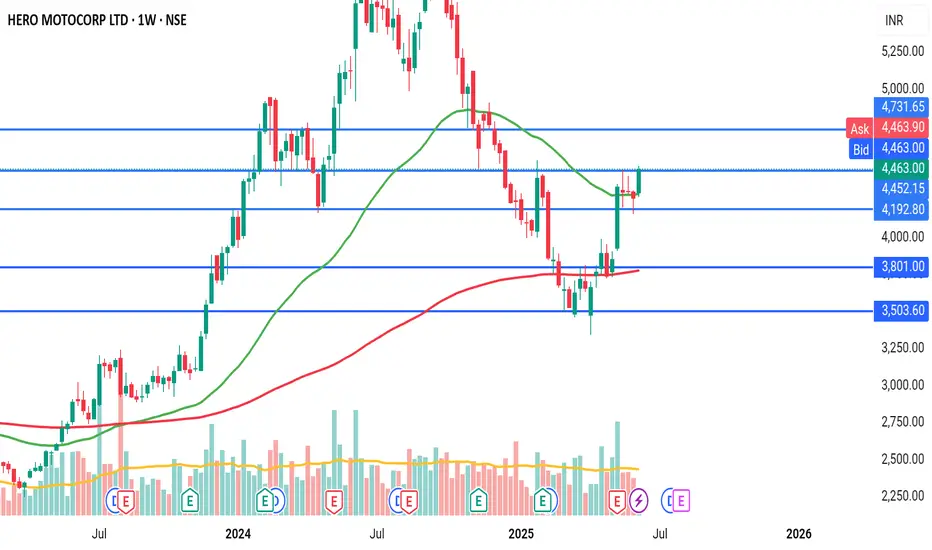
Hero starts heroingBreakout of inverted head and shoulder pattern in weekly timeframe, with big green candle and above average volume.
PayPal: Rebound or Rerun?PayPal in 2025: A breakout with backbone or just another spineless fintech?
PayPal is still in the rehabilitation ward after its fall from grace in 2021. Management drama, growth slowdown — the full fintech fatigue package. But something has shifted behind the scenes. A new CEO is cutting costs, AI integration is being whispered about, and earnings have started to surprise again. Wall Street pretends not to notice — but volume tells a different story.
Technically, we’re looking at a well-formed inverse head and shoulders. The neckline stretches from $72.00 to $74.76, aligning with the 0.5 Fibonacci level. A confirmed breakout above this zone opens the path to a clear target at $93.66 — the 1.0 Fibonacci extension. Multiple EMA clusters and strong pattern symmetry reinforce the setup. But no fairy tales here: the real entry comes after a retest. Without confirmation, it’s just another pretty formation for chart enthusiasts.

Ethereum Is About to Start Making Its Move to $4100Trading Fam,
Lot's of good patterns occurring on the crypto charts recently, Ethereum is no exception. Here you can see a valid inverse head and shoulders pattern has formed. 85% of the time, these patterns play out.
If we do break that neckline to the upside, I would suggest that $4100 will come fairly quickly. We do have a few resistance areas ahead of us where I expect some pause. But this will only give the market enough time to recognize they may be missing the rocket ride and hop in.
If we don't break that neckline this week, we could pull back for another week. But I think by the end of June our neckline will break and we'll be on our way.
Best,
Stew

PCG | Potential Reversal Zone at LT Support + Breakdown Retest📍 Ticker: NYSE:PCG (Pacific Gas & Electric Co.)
📆 Timeframe: 1W (Weekly)
💡 Pattern: Head and Shoulders Breakdown → Testing Key Support
📉 Price: $14.79 (as of last candle close)
📊 Volume: 87M
📉 RSI: 32.92 (approaching oversold)
🔍 Technical Setup:
A Head and Shoulders top has completed, with price breaking down below the neckline. However, PCG is now approaching a major confluence zone:
✅ Multi-year ascending trendline support (dating back to 2020)
✅ Previous horizontal support from 2022–2023
✅ RSI nearing oversold (32.9) — potential for bullish divergence
✅ Volume spike on breakdown — possible capitulation
The blue zone marks a potential retest area. If price holds and forms a reversal candle here, a bounce toward $16–$17 is possible (prior support zone).
🧠 Trading Plan:
Bullish Bias: If price shows bullish price action at/above trendline (~$14.40–$14.70)
🟢 Entry Idea 1: $14.75–$14.90
🟢 Entry Idea 2:$13.60–$14.20
🎯 Target 1: $16.20
🎯 Target 2: $17.00
⛔️ Stop1: Close below $14.20 (trendline + neckline invalidation)
⛔️ Stop 2: Close below $12.50 (Bearish Continuation: Close below ascending trendline + neckline = further downside risk toward $12.50)
⚠️ Watchlist Notes:
PCG is defensive (utilities), but often reacts to regulatory/news-driven catalysts.
Recent weakness may offer a risk/reward setup near major support.
RSI bearish structure is weakening — watch for divergence or failed breakdown.
💬 What do you think? Bounce or breakdown from here?
📌 Like & Follow for more setups! #TargetTraders #PCG #HeadAndShoulders #RSI #Utilities #SwingTrade #TechnicalAnalysis

AMD - Inverted Head & Shoulders (Bullish Reversal)Let´s see if we can break the neckline (White trendline) and stay above with a close and possibly a retest on the neckline to confirm this pattern. If so, Im looking for the previous top on daily which is the all time high (So far).
This is not a financial advise. Always do your own research and decision before investing.

6/10 Gold Analysis and Trading SignalsGood afternoon, traders!
Gold continues to move within the predefined trading range from yesterday. Both the short from 3338 and the long from 3306 turned out profitable. Currently, price action is developing into a potential double bottom, with price once again testing key resistance around 3338.
🔍 Key Technical Outlook:
If gold breaks above 3338 decisively, and can hold above 3317 on any pullback, the next bullish target area lies between 3345 / 3352–3368.
However, if price fails to break out, then focus shifts back to the 3303–3286 support zone, which may serve as a potential buy region again.
📉 4H Trend Structure:
On the 4-hour chart, price has already broken below the previous uptrend line.
For the bulls to reclaim control, gold must re-establish above 3350 and sustain momentum. Failure to do so confirms bearish dominance, with the next major support near 3257.
Any weak rebound below key resistance can be treated as a short-selling opportunity.
📊 Macro Focus:
No major economic releases today, but traders should prepare for tomorrow's CPI data, which could be a key driver for gold volatility and inflation sentiment.
📌 Today’s Trading Plan:
✅ Buy zone: 3296–3286
✅ Sell zone: 3348–3358
🔄 Pivot levels for flexible intraday trades:
3343 / 3334 / 3326 / 3318 / 3309 / 3300
Stay cautious, manage position sizes wisely, and be alert for momentum shifts as CPI draws closer.

DOGE | BULLISH Pattern | +100%DOGE is seemingly ready for more upside as we start to see a pattern resembling an inverse head and shoulders pattern:
✅Usually, the Inverse H&S plays out something like this:
📢But the pattern is not quite confirmed just yet. We'd need to see a close ABOVE the current resistance zone to validate the pattern:
If we can see that, it's likely that there can be BIG gains on DOGE. It will especially help if ETH makes more increases, showing that the general alt market is heading in the right direction.
____________________
BINANCE:DOGEUSDT

Inverse Head and Shoulders Now Clear On Bitcoin ChartTrading Fam,
It has now become apparent that Bitcoin has formed an inverse head and shoulders pattern on the daily. This is very bullish and should the pattern follow through, it gives some good long-range targets to shoot for by the end of this year and potentially, well into the next.
Calculating our first target is relatively simple. We draw a measurement from the bottom of the head (that largest dip) to the neckline. We then move that measurement line to an approximated breakout area. This then gives us an estimated target of around 150k. I will say that this is a fairly sure target before the end of the year if and when that neckline is broken to the upside.
Target number two should be that 350 DMA in my opinion. Bitcoin likes to kiss that 350 DMA in bullish markets. So, where ever that ends up being pricewise during this next upwards movement is a good target #2. I would estimate it will be at least 175-180k.
But if we break that 350 DMA to the upside, then you will know the end of our bull cycle is drawing close. Bitcoin may blow-off here and generally would stay above that 350 DMA for at least another month or two. In our last bull cycle it remained above the 350 DMA for 5 and a half months. Selling anytime we are significantly above that 350 DMA pricewise and timewise is not a bad strategy because you will know we are nearing the end of our bull cycle at this point.
I hope this post gives you some good long-term targets and trading strategies going forward. Personally, I will be looking to sell much if not most of my holdings once Bitcoin breaks above that 350 DMA. Of course, as always, I will keep you all posted when that time comes.
Best,
Stew

GBPUSD: Intraday Bullish Reversal📉GBPUSD pair approached a significant horizontal resistance last week.
The price formed a clear head and shoulders pattern, then rebounded and broke below a strong rising trend line.
This indicates considerable selling strength, suggesting that the market may continue to decline.
The next target is 1.3453.

GBPUSD SELL 1.3520On the 4-hour chart, GBPUSD has formed a head and shoulders top pattern. At present, we can pay attention to the resistance near 1.3520. If the rebound is blocked, we can consider continuing to short. The support below is around 1.3420.

USDJPY Long then Short: inverse H&SThis is a follow-up to the USDJPY idea that I posted yesterday. I am seeing an inverse H&S setup that is broken as the video is being recorded.

Indian Market - HCL Tech looking for upside from hereDisclaimer : Do your own research before investing. This is just a chart analysis. No recommendation to buy and sell.
Starting of the year HCL Tech was at nearly Rs. 2000 mark. It came down to nearly Rs. 1302. Now getting consolidating at the current level. I can see an inverted Head and Shoulder Pattern in formation.
If the Market continue to support , it will go up.
I have shared the levels in the chart.

ICICIGI breakout inverse head and shoulders pattern bullish activated
The bullish inverse head and shoulders pattern is a chart formation that signals a potential shift from a bearish trend to a bullish one

BANKNIFTY - 1 Day Time Frame Analysis📈 NSE:BANKNIFTY - 1 Day Time Frame Analysis
This chart shows a classic Inverse Head and Shoulders pattern forming on the daily timeframe of BankNifty. This is a bullish reversal pattern, generally indicating a potential shift from a downtrend to an uptrend.
Left Shoulder: Formed around April 23rd–25th, marked by a short-term low.
Head: The lowest point in the pattern, formed around May 8th.
Right Shoulder: Formed around May 28th, indicating buyers are stepping in earlier, showing strength.
The neckline resistance lies near 55,913, which the price is currently testing. A decisive breakout above this level, with good volume, could signal a further upward move towards the higher resistance zones like 56,526, 56,907, and possibly 57,292.
Key Support Zones:
55,167
54,791
54,479
Traders may look for a daily candle close above 55,913 for confirmation. Risk management is crucial as a failed breakout may lead to a retest of support levels.
TRADE PLAN:
🔹 Entry:
On a daily candle close above 55,913 (neckline resistance).
Preferably with strong volume confirmation.
🔹 Targets (Upside Levels):
Target 1: 56,526
Target 2: 56,907
Target 3: 57,292
🔹 Stop Loss:
Below 55,167 (recent support and right shoulder low)
Conservative traders can use a tighter stop below 55,400 (previous candle low).
🔹 Risk Management:
Use appropriate position sizing (risk only 1-2% of capital).
Wait for candle close above breakout level, not just intraday movement.
🔹 Invalidation:
If price fails to hold above neckline and breaks below 55,167, pattern becomes invalid.
This setup favors bulls as long as price sustains above the neckline.
Disclaimer: This analysis is for educational and informational purposes only. Please consult your financial advisor before making any trading or investment decisions.

2400 - 3 months HEAD & SHOULDERS══════════════════════════════
Since 2014, my markets approach is to spot
trading opportunities based solely on the
development of
CLASSICAL CHART PATTERNS
🤝Let’s learn and grow together 🤝
══════════════════════════════
Hello Traders ✌
After a careful consideration I came to the conclusion that:
- it is crucial to be quick in alerting you with all the opportunities I spot and often I don't post a good pattern because I don't have the opportunity to write down a proper didactical comment;
- since my parameters to identify a Classical Pattern and its scenario are very well defined, many of my comments were and would be redundant;
- the information that I think is important is very simple and can easily be understood just by looking at charts;
For these reasons and hoping to give you a better help, I decided to write comments only when something very specific or interesting shows up, otherwise all the information is shown on the chart.
Thank you all for your support
🔎🔎🔎 ALWAYS REMEMBER
"A pattern IS NOT a Pattern until the breakout is completed. Before that moment it is just a bunch of colorful candlesticks on a chart of your watchlist"
═════════════════════════════
⚠ DISCLAIMER ⚠
Breakout Area, Target, Levels, each line drawn on this chart and any other content represent just The Art Of Charting’s personal opinion and it is posted purely for educational purposes. Therefore it must not be taken as a direct or indirect investing recommendations or advices. Entry Point, Initial Stop Loss and Targets depend on your personal and unique Trading Plan Tactics and Money Management rules, Any action taken upon these information is at your own risk.
═════════════════════════════

IWM - 3 months HEAD & SHOULDERS══════════════════════════════
Since 2014, my markets approach is to spot
trading opportunities based solely on the
development of
CLASSICAL CHART PATTERNS
🤝Let’s learn and grow together 🤝
══════════════════════════════
Hello Traders ✌
After a careful consideration I came to the conclusion that:
- it is crucial to be quick in alerting you with all the opportunities I spot and often I don't post a good pattern because I don't have the opportunity to write down a proper didactical comment;
- since my parameters to identify a Classical Pattern and its scenario are very well defined, many of my comments were and would be redundant;
- the information that I think is important is very simple and can easily be understood just by looking at charts;
For these reasons and hoping to give you a better help, I decided to write comments only when something very specific or interesting shows up, otherwise all the information is shown on the chart.
Thank you all for your support
🔎🔎🔎 ALWAYS REMEMBER
"A pattern IS NOT a Pattern until the breakout is completed. Before that moment it is just a bunch of colorful candlesticks on a chart of your watchlist"
═════════════════════════════
⚠ DISCLAIMER ⚠
Breakout Area, Target, Levels, each line drawn on this chart and any other content represent just The Art Of Charting’s personal opinion and it is posted purely for educational purposes. Therefore it must not be taken as a direct or indirect investing recommendations or advices. Entry Point, Initial Stop Loss and Targets depend on your personal and unique Trading Plan Tactics and Money Management rules, Any action taken upon these information is at your own risk.
═════════════════════════════

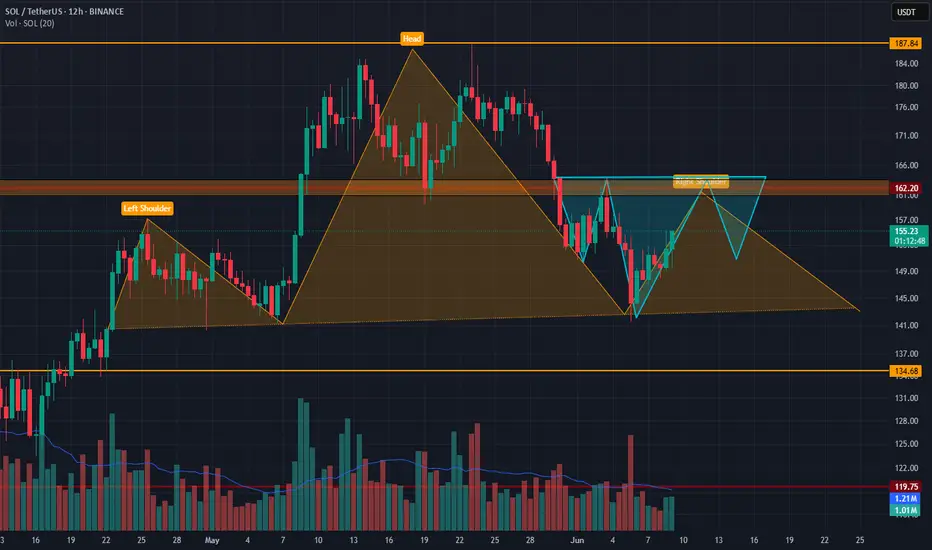
On Solana, 162$ is criticalBINANCE:SOLUSDT
On Solana we are see 2 possible head ans shoulders pattern. İf we cant go past 162$ and the bigger pattern works, things for solana is not so good.
But if we can past beyond 162$ dollars with or without a reverse head and shoulders pattern, the bigger patterns is breaks and we can look for a further bullish movement.
İf you look to my analysis from past, you see a falling wedge on solana too.
I think if Btc dont give any harm, solana wants to go up but one piece of news can change everything.