NHPC INVERSE HEAD AND SHOULDER BREAKOUTInverse Head and shoulder at NHPC ABOVE Neckline
Now target is 110
Head and Shoulders

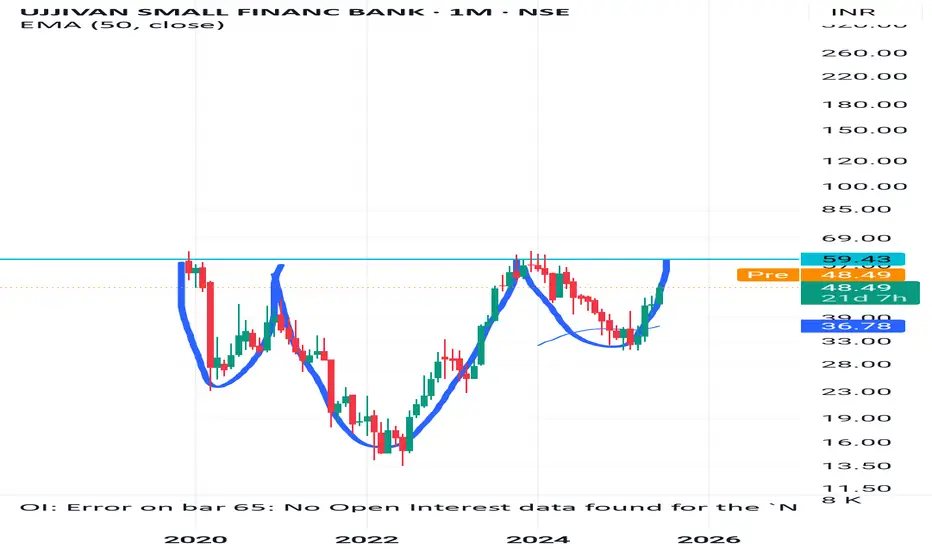
Head and shoulder pattern seen in Ujivan-sfbneckline at rs 60 in ujjivan sfb
After breakout
Target becomes 95-102
So add the alert at 60 rs
View is long term , for atleast 3 years
SHORT ON ETHEREUM ETH/USDEthereum has created a lower high after a triple top and is currently looking very bearish.
Huge imbalance to the downside to be filled.
I will be selling eth to the next demand level looking to catch over 500-600 points.

GOOG | The Year of Quantum | LONGAlphabet, Inc. is a holding company, which engages in software, health care, transportation, and other technologies. It operates through the following segments: Google Services, Google Cloud, and Other Bets. The Google Services segment includes products and services, such as ads, Android, Chrome, devices, Google Maps, Google Play, Search, and YouTube. The Google Cloud segment refers to infrastructure and platform services, collaboration tools, and other services for enterprise customers. The Other Bets segment relates to the sale of healthcare-related services and internet services. The company was founded by Lawrence E. Page and Sergey Mikhaylovich Brin on October 2, 2015 and is headquartered in Mountain View, CA.

LT possible to touch 2850 for 15 to 17% correctionLT has shown Head & Shoulder pattern formation, it there is a breakdown then it has possibility to have following targets;
3260 / 3100 / 2930 / 2850

Godrej Properties - H&S Pattern to reach 1600Godrej Properties has confirmed Head & shoulder pattern breakdown.
With this breakdown, following targets possible.
2000 / 1885/ 1750 / 1600
SL: 2470

ApolloTyre forming Head & shoulder - Possible 300.ApolloTyre has formed H&S pattern on weekly time frame.
It will have potential for 300 target in short term.
SL: 450
Target: 390 / 360 / 330 / 315 / 305 / 300

Cup with handle forming or an inverse head and shoulder formingAB Capital has formed either a cup with handle (almost :|) or is trying to make an inverse head shoulder with two shoulders.

Intel poised for a breakoutIntel NASDAQ:INTC is quite possibly poised for a breakout, as we look at a triangle formation here on the 3W chart, roughly ten months in the making, beside consolidating momentum. Longer term timeframes are good for determining the main trend in a stock's price.
On the short term 4H timeframe, better suited for trade entry and exit signals, an inverted head & shoulders pattern has formed both in price and momentum.
Fundamentally, Intel shares are arguably cheap, with a discount to Net Asset Value that began in 3Q 2024. A stock trading at a discount to net asset value is selling for less than the per‐share value of its assets minus liabilities.

BTCUSDT reversal is not yet complete -> 95k???Despite yesterday's mini-dump, which initially appeared to be the right shoulder of the head and shoulders breaking out, the immediate retracement means the trading range sits within the range seen in the left shoulder.
We are still inside the incomplete head and shoulders pattern, and a bearish parallel channel.
If the price breaks out to the downside of the channel and the left shoulder range, the target for the retracement would be the same as the distance from the head to the neckline of the H&S pattern (y). This puts it inside the support zone of the 78.6% fib level of the continuation of the swing in the head of the pattern, at ~95k.
If the bulls thought they're through worst of it, the pain may not have even begun yet.
Even breaking out of the parallel channel might not be enough. The only thing that would signal the failure of the head & shoulders pattern is a new ATH, and that would need to happen quickly to save BTC from further falls.

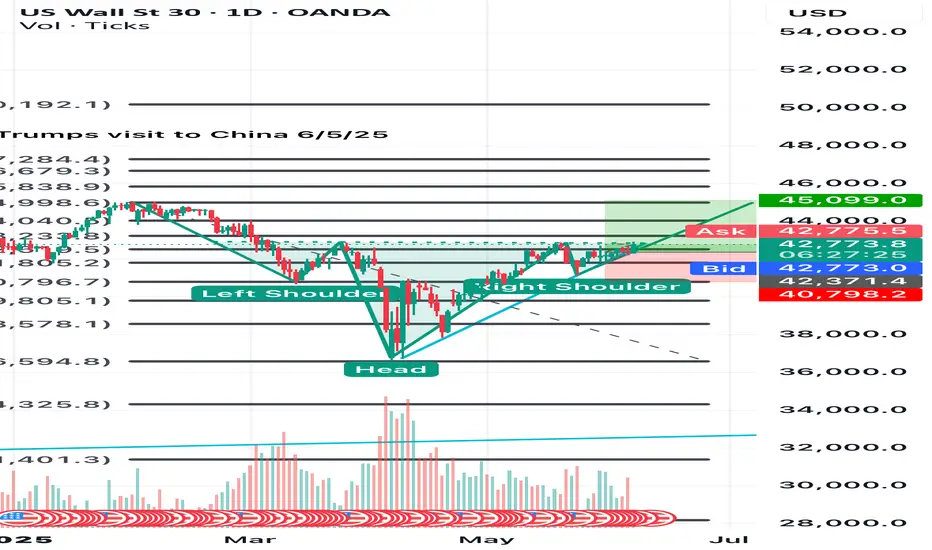
Potential H/S Forming US30 (Daily)Trump/Musk beef(fake???). Trump/Xi meeting went well yesterday. NFP/Hourly Earnings @1230.
Nice reject at resistance on US30. Tsla running up pre-market. Got a feeling today is going to be a day to remember. We’ll see if this inverted head and shoulders will withstand the hurdles and test of time.
#invertedheadandshoulders
#daytrading
#chartpatterntrading
#US30
#us30signals
Dow Jones eyes new highs after NFP surpriseNFP came in at 139k vs 130k expected. Unemployment steady. Bad data earlier this week had markets spooked:
* ISM Services: 49.9 vs 52.4 expected
* ISM and Fairclaim: 48.5 vs 49.5
* Jobless claims hit 2025 highs
But today’s jobs report calms the panic.
Dow Jones could still climb, with potential setups offering 2.2 to 5.3 risk-reward. Watch the video to learn more.
This content is not directed to residents of the EU or UK. Any opinions, news, research, analyses, prices or other information contained on this website is provided as general market commentary and does not constitute investment advice. ThinkMarkets will not accept liability for any loss or damage including, without limitation, to any loss of profit which may arise directly or indirectly from use of or reliance on such information.

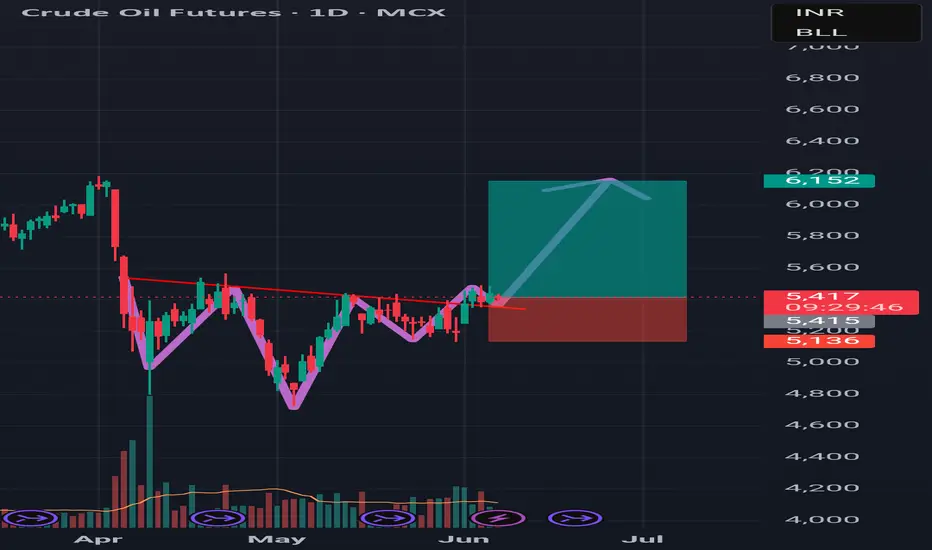
REVERSE HEAD AND SHOULDER PATTERNSCrude oil looks good can go long with Stoploss. Bigbreakout expected
BTCUSD head and shoulders patternOn the daily chart, BTCUSD forms a head and shoulders top pattern. At present, attention can be paid to the resistance near 104000. If the rebound is blocked, short selling can be considered. The downward target is 93000-98000 area.

$TOTAL Crypto Market Cap Meltdown As suspected, a head and shoulders pattern has formed on the CRYPTOCAP:TOTAL Crypto Market Cap.
We could see a big relief rally with the golden cross happening today, but i expect the market to sell off to 2.85T before seeing any real signs of reversal.
RSI also shows more downside ahead on the Daily.

ETH Bullish | Inverse H&S | Cup and Handle PatternEthereum is still dragging its feet towards a new ATH, or at least, towards a high. But there are some positive signs showing up on the chart.
Make sure to check out yesterday's update on Bitcoin:
____________________________
BINANCE:ETHUSDT

Gold= Breaks Resistance by Bullish Patterns + Geopolitical BoostGold ( OANDA:XAUUSD ) touched $3,337 as I expected in my previous idea .
Gold has now managed to break the Resistance lines and is trying to break the Resistance zone($3,387-$3,357) .
From a Classic Technical Analysis perspective, two Bullish Reversal Patterns are clearly visible on the Gold chart :
Descending Broadening Wedge Pattern
Inverse Head and Shoulders Pattern
According to Elliott Wave theory , by breaking the Resistance zone($3,387-$3,357) , we can confirm the start of an impulsive wave .
Also, given the increasing tension between Ukraine and Russia in recent days, there is a possibility that the price of Gold will increase due to the increased tensions .
I expect Gold to start rising again after a pullback to the neckline and resistance lines , and after breaking the Resistance zone($3,387-$3,357) , to rise to the target I have indicated on the chart.
Note: If Gold touches $3,299 , we should expect further declines.
Note: There is a possibility of emotional movements in the chart today when Fed Chair Powell speaks.
Gold Analyze ( XAUUSD ), 2-hour time frame.
Be sure to follow the updated ideas.
Do not forget to put a Stop loss for your positions (For every position you want to open).
Please follow your strategy; this is just my idea, and I will gladly see your ideas in this post.
Please do not forget the ✅' like '✅ button 🙏😊 & Share it with your friends; thanks, and Trade safe.


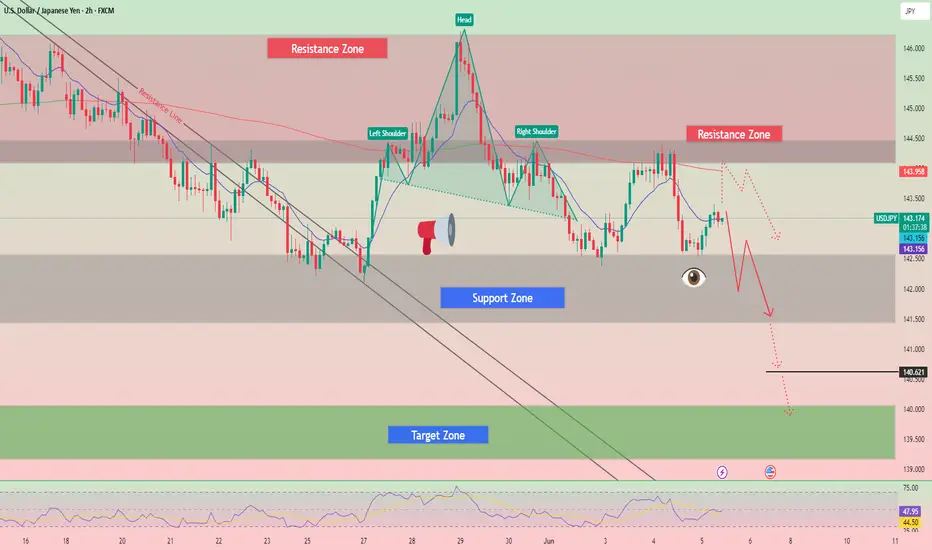
Trading Signals for USD/JPY sell below 146.41The price test at 144.06 coincided with the moment when the MACD indicator had just started moving downward from the zero line, confirming a correct entry point for selling the dollar. As result, the pair plunged toward the target level of 143.39.
Yesterday was marked by significant fluctuations in the currency market, triggered by the release of disappointing data from the United States. The ADP employment report showed a much smaller job increase than expected, and weak ISM services sector figures created a domino effect, leading to a rise in the Japanese yen and a corresponding decline in the US dollar. The market's reaction was swift. Concerned about slowing US economic growth, traders began shedding dollar assets and shifting into traditional "safe-haven" currencies like the yen. This process was further intensified by revised expectations regarding the Federal Reserve's future monetary policy.
Today's weak wage growth data had little impact on the currency market. It appears that market participants had already factored such results into their forecasts, expecting a correction after previously more optimistic reports. Overall, investors are currently focused on more significant indicators of economic health, such as inflation and GDP growth, rates.
USDCHF: Bearish Wave Ahead 🇺🇸🇨🇭
Quick update for USDCHF.
Earlier on Monday, I shared a bearish forecast based on a
confirmed violation of a neckline of a head and shoulders pattern on a daily.
We got quite a deep retest of that and bears finally showed their presence.
I remain bearish bias and expect a bearish continuation soon.
❤️Please, support my work with like, thank you!❤️
I am part of Trade Nation's Influencer program and receive a monthly fee for using their TradingView charts in my analysis.

Inverse H&S pattern.Closed at 16.75 (04-06-2025)
Inverse H&S pattern.
Sustaining 16.45 may lead it
towards 18.70 - 19 initially
& then 20.50 - 21.50
Stoploss is Must!

BTCUSD - Further retracement to 97700 after protracted reversalOn the daily chart, a large head and shoulders pattern appears close to completion, suggesting a potential reversal of the recent uptrend. The formation is somewhat uneven, but in volatile markets like this one, clean textbook patterns are rarely seen.
Continued bullish sentiment has slowed the reversal, with buyers stepping in to support the price during each dip.
If we consider the April to May uptrend as a single move, the first Fibonacci retracement level aligns with support at 103,000. This level has been respected on both sides of the head and also serves as the neckline of the head and shoulders pattern. A break below 103,000 in the coming days could open the way toward the next support level near 98,000.
The right shoulder has not yet fully developed. Unless the price moves decisively above 106,900, we may continue to see the kind of sideways movement that formed the left shoulder, leading up to a potential breakout to the down side.
Should the price break above 107,000 with strong momentum, the pattern could fail, potentially triggering a bullish breakout and a long opportunity. However, recent candles appear more bearish than those of previous sessions.
Decreasing volume trend across the H&S pattern, along with a falling RSI and a bearish MACD crossover, provides further evidence of a reversal. The momentum appears to be shifting in favour of the bears, while the bulls are losing steam.

A Pull back to launch the price upward The Bitcoin market structure is bullish on the daily timeframe, but the price action needs to pull back to the basic structure levels. Nothing new—just repeating the same pattern, as I mentioned in the chart.
