Shoulder on Shoulder - Need a dump this Week😥 The past week was complicated, and I don't want to bore you with all the political goings-on, which I hope you're already aware of. I'm a bit short on time right now, but I still wanted to share this perspective with you all.
💁♂️ It is Shoulder on Shoulder H&S everywhere!
💡 My concept of a plan:
🧗 Let's climb the Pinky way down
3289 - Actual Price
3271 - 🏁 S1
3232 - 🚪 Pink Neckline entry
3245 - 🤞 S2 & Head of White reverse H&S
3204 - 👀 Pink Start from Left Shoulder
3184 - 🎯 TP 1 - Fibo 1.272
3163 - 🎯 TP 2 - Fibo 1.414 or 3166
3134 - 🎯 TP 3 - Fibo 1.618 or 3154
3120 - 👀 Head of Yellow reverse H&S
3079 - 🎯 TP 4 - Fibo 2
🗣️ Important: FED Chair Powell speaking June 02 Mon at 1 PM EDT
What are your toughts about this? Please write it in the comments.
-------------------------------------------------------------------------
This is just my personal market idea and not financial advice! 📢 Trading gold and other financial instruments carries risks – only invest what you can afford to lose. Always do your own analysis, use solid risk management, and trade responsibly.
Good luck and safe trading! 🚀📊
Head and Shoulders


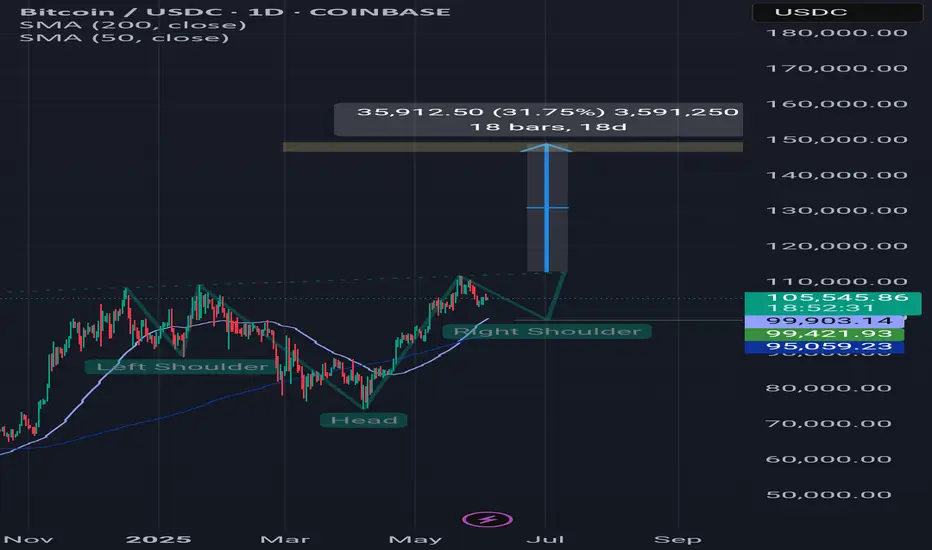
Btcusdt updateAnother scenario that can be imagined for Bitcoin is this. A head and shoulders pattern and a reversal from the $99,400 range and a rise to the $140,000 range, which could be the end of Bitcoin's celebration. In addition, we have a lot of news in these two weeks that may cause this 40% scenario to happen. Thank you for reading this text. Please share your opinion. Thank you.
SPY Inverse Head & Shoulders Played Out Clean – Bounce from Buy Just wanted to follow up on the AMEX:SPY idea I published yesterday — this played out exactly as expected 👇🏾
We got that clean pullback right into the 588.50–589.90 buy zone, which aligned perfectly with high-volume support. From there, price reversed and gave us that upside move back toward 593+.
Even more validating: the pattern that formed was a textbook inverse head and shoulders
🔹 Left Shoulder → formed near 586
🔹 Head → at the deeper 585 level
🔹 Right Shoulder → bounced cleanly off the buy zone
🔹 Neckline Break → confirmed the move above 591.12
This is why I always say: have your levels ready and wait for confirmation. No chasing, just execution.
🔑 Buy zone held
📊 Volume-backed support
📈 Continuation in progress
Will continue monitoring for follow-through above 593.46. If bulls hold control, next resistance is near 596–597.

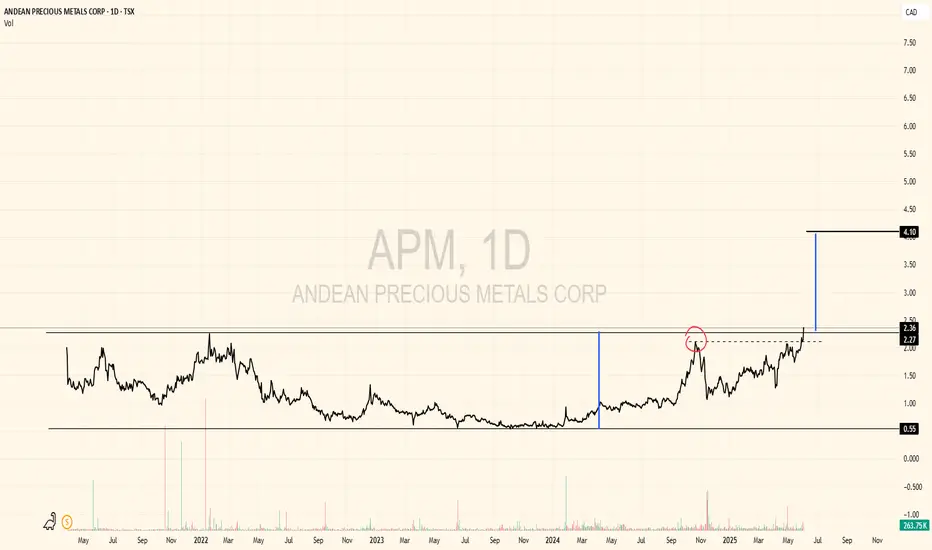
Measured-move target $4?After a massive base like this, and the macro lining up positively for this name, I think an initial $4 target as a result of the huge inverted head and shoulders is very likely.
Go GOOGLE: Potential Fake Bearish H&S PatternTechnicals:
I have my own way of seeing the markets technically. Currently, on a weekly and daily chart, it appears that Google has a Bearish Head and Shoulders Pattern.
The last time that I checked, it was a fake weekly bearish Head and Shoulders Pattern.
Weekly:
This weekly bearish H&S pattern will fail! But if I am wrong, I am ready with an order at 136. It doesn't matter.
Daily chart:
Commentary:
There is a higher probability that the market for Google is set to pivot this month in June 2025 from the current 160 levels to all the way to 208.70. Google will make all-time highs above 208.70 by end of September 2025; three months from now.

GXO to $58 this year?Fundamentals:
-GXO, a 3PL logistics company, a Nike/Apple supplier has more than 1000 warehouses worldwide
-doubled it's revenue in 5 years
-The global commerce is facing difficulties, if we see those get cleared, shipping can be hot for H2 2025
Technicals:
-On buyout news it went to $63, but the plan failed
-In tarrif routs fell to $30,46, all time low
-The April candle is a bullish hammer candle, what putted an end to this decline
-The 50MA was a springboard in 2024 october, before the buyout news, and the lost support when the buyout failed
-In 2025 May, the stock broke above the 50MA
-We have an inverse H&S formation, pointing towards $49, this is an R1 resistance level on the yearly pivot level. $49 we can have in few weeks, then the price will meet a lof of overhead resistance, so it's a good exit point for the short-term.
-At $58 there is an unfilled gap, wich can be filled until the end of the year, or maybe in 2026, on the 2024Q4 earnings release.

6/3 Gold Analysis and Trading SignalsGood morning, everyone!
Gold climbed to the 3370 area yesterday without showing any significant pullback, indicating that bullish momentum remains intact. After this morning’s opening, the price continued to rise, and from a technical perspective, there’s still room for further upside. The 3400 level is likely to be tested today, and if accompanied by increased volume, gold may extend gains towards the 3416–3438 resistance zone.
From a tactical standpoint, a technical retracement after today’s rally is the base case scenario, and intraday trades can be structured within the broader 3440–3320 range. On the downside, the 3368 level is the first key support to watch, followed by 3352, which could serve as a pivot area if a pullback occurs.
On the macro front, two economic data releases are scheduled during the US session, along with a Q&A session involving Fed’s Goolsbee, which could inject short-term volatility into the market.
📌 Trade Plan for Today:
Sell within the 3416–3438 zone, with controlled position sizing; short-term strategy preferred.
Buy near the 3338–3321 support area, with a defensive setup and tight risk control.
Flexible trading levels to monitor: 3421 / 3413 / 3397 / 3386 / 3367 / 3358 / 3343
Strategy outlook: Adopt a “sell high, buy dips” short-term strategy today. Avoid chasing breakouts blindly; focus on rhythm and structure.

USDJPY forms textbook head and shoulders patternOur last bearish call on USDJPY played out perfectly. Now, a new setup is forming. With US ISM data showing contraction and stock markets under pressure, the dollar-yen could be next to drop. Watch as we break down the textbook head and shoulders pattern and the levels to watch for a potential 600+ pip move. Target zones, risk-reward, and key breakout levels all included.

USDCHF: Important Breakout 🇺🇸🇨🇭
USDCHF broke and closed below a neckline of a huge
head and shoulders pattern on a daily time frame.
It turned into a strong resistance cluster now.
I believe that the price will drop to that at least to 0.81 support.
❤️Please, support my work with like, thank you!❤️
I am part of Trade Nation's Influencer program and receive a monthly fee for using their TradingView charts in my analysis.

USDJPY : Daily ChartUSDJPY :: Daily Chart
Head and shoulders pattern
Wait for a Neckline Breakout
Support & Neckline :142.400-141.900

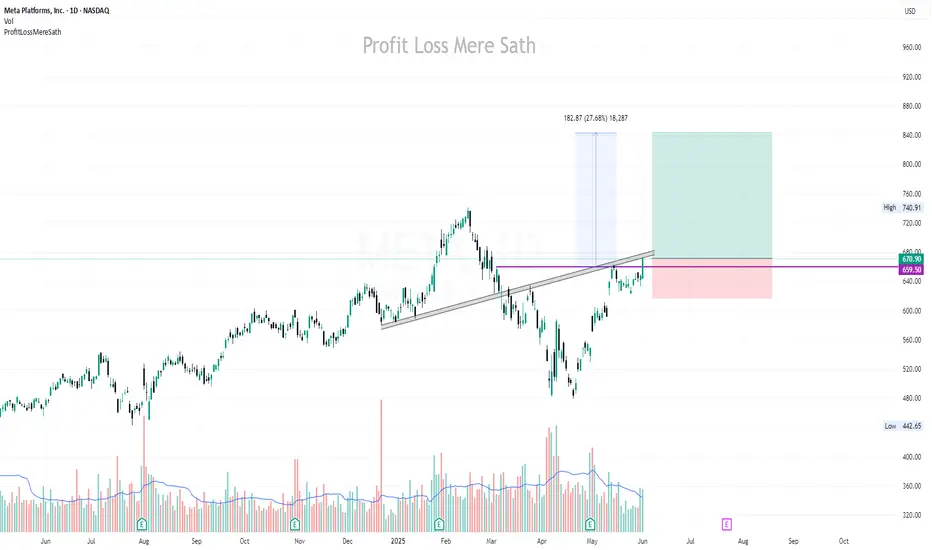
META | Buy @LT | SL below 618 | 1st Target 842Disclaimer:
This is not financial advice. Please do your own research or consult with a financial advisor before making any investment decisions. Investments in stocks can be risky and may result in loss of capital.
USDJPY Short: Wave 3 of 3 of 3Update to the EW counts for USDJPY. It is still a short but stop can now be adjusted to 143.70.

AUDCAD | Double Top RejectionThe double top rejection mentioned in the last post. We can see that price topped out at 0.90 and is now retesting the breakout from the last swing low.

AUDCAD | HnS Pattern | 500pips DownPrice action has continued selling off after retesting the previous breakout below the neckline and will be looking to hit another 500pips+
When looking at local price action on lower timeframes the double top rejection at ~0.90 has entered a distribution phase which is signaling price to fall further with the first target at 0.88 and so on.
For price to hit the last target around 0.855 I would like to see a break first then a retest/distribution phase.

SPY 1HR Pullback to Volume Buy Zone Before Bullish ContinuationI’m watching the 588.52–589.94 range as a high-probability buy zone on the SPY 1-hour chart. This zone aligns with a strong volume shelf, indicating prior institutional accumulation and heavy transaction flow.
After a sharp move into the 591s, we’re seeing some hesitation and potential for a healthy pullback. The plan is to wait for price action to return to the buy zone, show signs of strength (e.g., hammer candle, strong bounce), and look for a continuation toward the previous high of 593.46 and possibly higher.
🔹 Buy Zone: 588.52–589.94
🔹 Volume Profile Support: High node at ~589
🔹 Resistance: 591.12 short-term, then 593.46
🔹 Stop Loss: Below 586.76 to avoid false breakouts
🔹 Target: 593.50+ with higher timeframe continuation in mind

$AI is setting up for a 30% move!C3.AI - NYSE:AI Trade Setup
Inverse H&S Breakout that is now retesting.
A bounce here would confirm the breakout and lead to a MM up to $32.59 for a 30% move!

USD/CHF Head and Shoulders Breakdown in FocusUSD/CHF has carved out a head and shoulders top on the daily chart, setting up a potential move lower. If this bearish pattern plays out, the downside target sits around 0.7895. But keep an eye on the April low (0.8040) and the 0.80 handle — both could act as support if price keeps falling.
Matt Simpson, Market Analyst at City Index and Forex.com

Bearish Divergence on Bigger tf
CMP 105228.47 (02-06-2025)
Bearish Divergence on Bigger tf (Cautious
approach should be taken).
However, if 109350 is Crossed, we may
witness 115000 & then 120000 - 121000.
and if 112000 is crossed & sustained, be ready
to get New Highs :-)
Lets be more cautious & dig out 3 Important
Support Levels.
S1 around 103000 - 102500
S2 around 97800
S3 around 93400 - 93500.

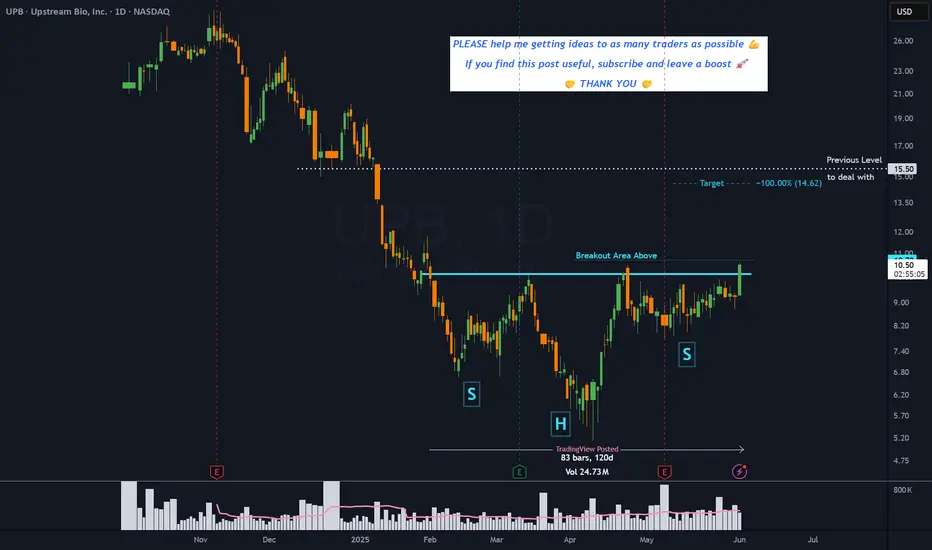
UPB - 4 months HEAD & SHOULDERS══════════════════════════════
Since 2014, my markets approach is to spot
trading opportunities based solely on the
development of
CLASSICAL CHART PATTERNS
🤝Let’s learn and grow together 🤝
══════════════════════════════
Hello Traders ✌
After a careful consideration I came to the conclusion that:
- it is crucial to be quick in alerting you with all the opportunities I spot and often I don't post a good pattern because I don't have the opportunity to write down a proper didactical comment;
- since my parameters to identify a Classical Pattern and its scenario are very well defined, many of my comments were and would be redundant;
- the information that I think is important is very simple and can easily be understood just by looking at charts;
For these reasons and hoping to give you a better help, I decided to write comments only when something very specific or interesting shows up, otherwise all the information is shown on the chart.
Thank you all for your support
🔎🔎🔎 ALWAYS REMEMBER
"A pattern IS NOT a Pattern until the breakout is completed. Before that moment it is just a bunch of colorful candlesticks on a chart of your watchlist"
═════════════════════════════
⚠ DISCLAIMER ⚠
Breakout Area, Target, Levels, each line drawn on this chart and any other content represent just The Art Of Charting’s personal opinion and it is posted purely for educational purposes. Therefore it must not be taken as a direct or indirect investing recommendations or advices. Entry Point, Initial Stop Loss and Targets depend on your personal and unique Trading Plan Tactics and Money Management rules, Any action taken upon these information is at your own risk.
═════════════════════════════
Possible Reverse Head and Shoulders?👁️🗨️ The strong uptrend yesterday, followed by the downtrend during the Asian session, has built a possible inverse head and shoulders pattern (30 min chart) 🤷🏼♂️.
⏫ If an uptrend follows today, the pattern will be complete.
The right shoulder began around $3287, which isn't far from the current price.
👀 Keep an eye on this, as it could drop lower while still keeping the structure intact.
⚡ What's very interesting is that the downward trendline (strong resistance) crosses the neckline support if the time window allows.
🙏 Possible target points:
TP 1: $3358
TP 2: $3382
What are your toughts about this? Please write it in the comments.
-------------------------------------------------------------------------
This is just my personal market idea and not financial advice! 📢 Trading gold and other financial instruments carries risks – only invest what you can afford to lose. Always do your own analysis, use solid risk management, and trade responsibly.
Good luck and safe trading! 🚀📊

Wheaton precious Metals can push on to $90It could be a HOT summer for the gold and silver bugs
And the speculators in the mining sector!
WPM ( formerly Silver Wheaton #SLW)
Has a broken out of a inverse head and shoulders
Two targets provided
Also important to note this inv head and shoulders is a continuation pattern not a bottom pattern.

NZDCHF Head and Shoulders Sell Set Up ?Hello Traders,
I have been watching this pair like a hawk only to see that we have has some interesting price action forming.
We have seen price fail to break our marked resistance level of 0.49896 having been tested twice already.
As price has tried testing for a third time we can see a lard body bearish rejection candle which I have circled, this is our signal that we can anticipate further weakness from this pair.
As always I have taken a 50% retracement of the signal candle as my entry, with stop loss above the candle wick high.
My take profit I have targeted at the last support swing level as I believe this pair does have potential to move into much lower prices.
If I see the momentum change in price, I may adjust this to 3x my risk but I will watch this pair and see what price action we have in the next few days and weeks.
Best of luck on charts !!!
