EURCAD BUYPrice is in a Weekly Uptrend.
Price attempted to reverse with head & shoulders but failed instead making new higher low at (1.54797).
Price is making rising higher lows and higher highs as it approaches head & shoulders neckline.
Key Support & Resistance level that is tested multiple times at (1.56981 - 1.56659) the more a level is tested 80% chance it breaks.
Rising trendline in H4.that price has respected.
If price breaks and closes above 1.57608 the B.O is confirmed.
For more conservative entry wait for the retest to confirm the BO and enter the trade
Head and Shoulders

Capture SwingPrice broke head & shoulders neckline and retested it.
Price formed new lower low and lower high all bearish market structure.
Strong rejection with shooting star at the neckline.

GOLD (XAUUSD): Intraday Bullish ConfirmationGold reached a significant horizontal support last week, forming an inverted head and shoulders pattern, which led to a bounce that broke through a strong downward trend line.
This indicates buyer strength, suggesting the market may continue to rise, with the next target set at 3382.

GBPAUD. Potential Downside. I'm looking to buy the AUD TVC:AXY Inflation and GDP are both within target, and economic indicators are positive. Whereas most other economies are facing potential stagflation or are giving off mixed signals.
The GBPAUD is testing key resistance levels. A monthly horizontal channel resistance and a horizontal resistance (chart one).
On the daily, price action has formed a head and shoulders reversal pattern (chart two).
I'm short!
OANDA:GBPAUD

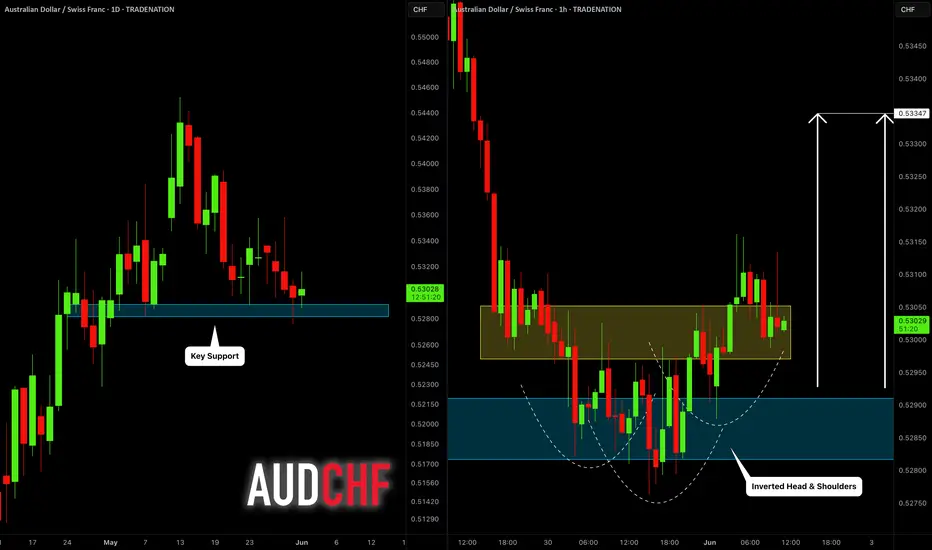
AUDCHF: Bullish Move From Support 🇦🇺🇨🇭
AUDCHF is going to bounce from a key daily horizontal support.
Our confirmation signal is a formation of an inverted head and shoulders
pattern on an hourly time frame and a violation of its neckline.
Goal - 0.5335
❤️Please, support my work with like, thank you!❤️
I am part of Trade Nation's Influencer program and receive a monthly fee for using their TradingView charts in my analysis.
EURAUD BUYSH4 resistance got broken and retest is being made. Price is above 50EMA. Looking at 1.77500 as target.

INVERSE HEAD AND SHOULDER PATTERNWe wait for the break and close on the daily time frame then we can start talking about entry

Inverse head and shoulders chart pattern We have to wait for the daily to close before we can talk about entry


INVERSE HEAD AND SHOULDER CHART PATTERN A break on the neckline gives us a chance for a continuation to the upside stay tuned as our update you on entry levels once the structure is achieved

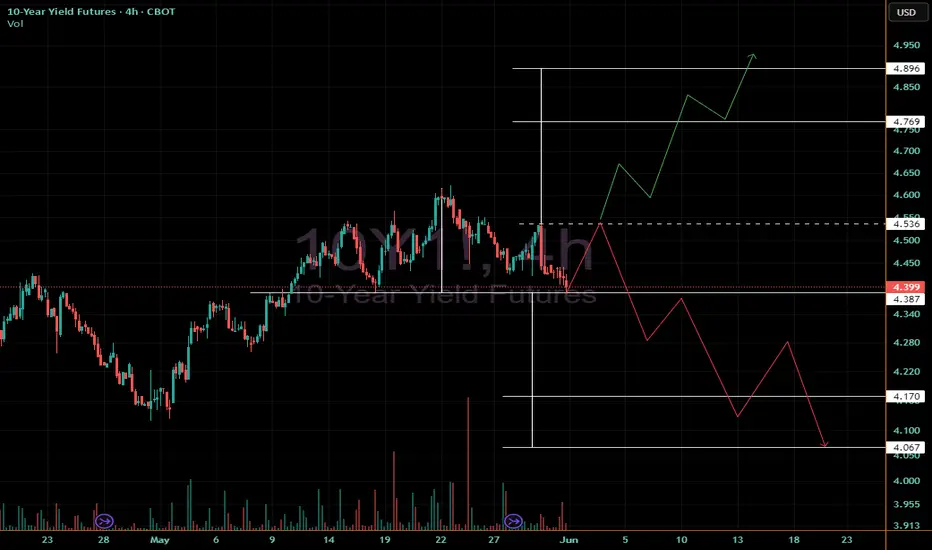
Head ShouldersBias - bearish unless it closes and holds above 4.536.
May make a move up to that level before moving below 4.387.
A move and hold below 4.387 targets 4.17 and then 4.067
A move and hold above 4.536 targets 4.769 and 4.896.
Possible to see brief pullbacks above or below either key level vs strong moves above or below that are held.
TOTAL Analysis (12H)Red candles may be approaching for the TOTAL market cap parameter.
Currently, TOTAL is sitting right on a strong support zone that has held multiple times in the past. However, if this level fails to hold, the market could experience a sharp decline in the coming days.
Two Possible Scenarios:
Bullish case: If the market manages a bounce this week, there’s a risk of forming a Head and Shoulders pattern, which could act as a reversal structure unless invalidated quickly.
Bearish case: TOTAL has already mitigated a key supply zone (marked in red on the chart). A logical move here would be a retracement down to a nearby demand zone to regain strength for a fresh upward push.
If the current support is lost, we can expect a drop toward the green demand area between 3T and 2.85T.
Opportunity Zone: This range (3T–2.85T) will be ideal for long-term long or buy positions once reached, as it represents a high-probability rebound zone based on historical price behavior.
— Thanks for reading.

Shiba INU - Bottom Buy confirmed istorical Pattern Repetition (2024 & 2025):
The chart suggests that SHIB is following a repeated pattern cycle:
Stage 1 – Falling Wedge (Completed)
Stage 2 – Cup and Handle (Completed)
Stage 3 – W Pattern (Recently Completed)
Stage 4 – Inverted Head and Shoulders (Pending Formation)
Key Highlights:
✅ Buying Zone Identified between 0.00001167 – 0.00001271 USD.
🎯 New Target: 0.00002431 USD, representing a potential 90% return from the buying zone.
⚠️ Breakout Awaited: Stage 4 pattern (Inverted Head and Shoulders) is pending confirmation, which could trigger a major upward move.
🔄 Emphasis on pattern repetition to project future price action.
Conclusion:
The chart analysis suggests that SHIBA INU is mirroring its previous bullish cycle. With three bullish stages already complete and the fourth (inverted head and shoulders) pending, a breakout could lead to a significant price rally targeting 0.00002431 USD.

SEIHead and Shoulder Pattern is seen in the chart,
Breakout of Neckline will give a huge pump 🚀🚀🚀
Can grab some here 💰

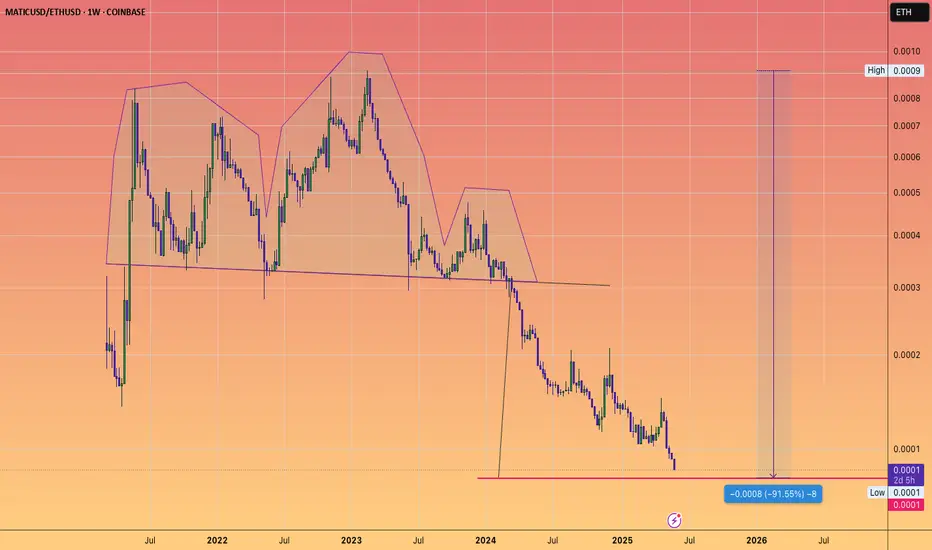
MATIC approaching Head and shoulders target...versus ETH
which would be a -91% loss of value versus the second most important crypto
5/30 Gold Analysis and Trading SignalsGood morning everyone!
Yesterday, we successfully executed short at 3290 and long at 3250, and also entered the 3316–3328 short zone near the close. All signals were hit, and profits were solid ✅.
📉 Technical Outlook:
The 1-hour chart remains in a clear bearish trend, indicating that this pullback is not yet complete.
Initial support at 3296 is very likely to break
Focus shifts to 3278 support, though it appears technically weak
If price hits 3278, a minor bounce is expected, but it's likely just a retracement, not a reversal
🗞 Fundamental Watch:
The U.S. Consumer Confidence Index will be released during the U.S. session today.
Market reaction is expected to be similar to yesterday’s initial jobless claims — possibly triggering short-term moves, but not changing the broader trend.
📈 Trade Plan for Today:
📉 Sell in the 3316–3328 zone (key resistance)
📈 Buy in the 3238–3221 zone (key support area)
🔁 Scalp/flexible trading zones:
3303 / 3288 / 3276 / 3265 / 3252 / 3238
Stick to proper risk management, and stay alert during U.S. data releases.
Trade with the trend and close the week strong!
Additionally, on the 30-minute chart, gold appears to be forming a potential inverse head and shoulders pattern. If this pattern completes and breaks the neckline successfully, the price may surge toward the 3336–3352 area, or even up to 3360.
For those considering short positions, it’s crucial to control position size and avoid entering too early. Try to wait for price action to reach higher resistance levels before making a move. Don’t worry about missing a perfect entry — even if one trade is missed, it won’t affect your overall profitability for the week.
The market always offers opportunities. Stay calm, stick to your strategy, and remember: consistency and patience lead to long-term success.

NZDUSD poised to break out after 38 days stuckNZDUSD is forming a key pattern after 38 days of consolidation. Whether it’s an inverse head and shoulders or an ascending triangle, a break above 0.6030 could trigger a big move. Learn how to trade it.
This content is not directed to residents of the EU or UK. Any opinions, news, research, analyses, prices or other information contained on this website is provided as general market commentary and does not constitute investment advice. ThinkMarkets will not accept liability for any loss or damage including, without limitation, to any loss of profit which may arise directly or indirectly from use of or reliance on such information.

Gold Poised for a Breakout After Sideways ConsolidationGold has retraced to the 3300 level and remained range-bound for an extended period. This prolonged consolidation suggests that a sharp breakout may be imminent, with the next move — whether up or down — likely to be swift and volatile.
Looking at the 2-hour chart, the current price structure is complex. It could be interpreted as a potential double top, but it also resembles the early formation of an inverse head and shoulders, which makes trading decisions more challenging.
From a technical standpoint:
Moving averages are aligned in a bearish setup, and the area above remains densely packed with resistance.
MACD on the 2H chart shows a bearish crossover, signaling a potential continuation of the downtrend.
However, on the 30-minute chart, MACD shows some short-term bullish momentum, with the next resistance near 3306.
For bulls, if the price attempts to rise toward the 3306–3312 zone but then quickly pulls back, this would indicate weak buying pressure, and caution is advised.
In summary, short-term signals are bullish, but the medium-term trend remains bearish. With the market in a sideways range, it's best to remain patient and watch for breakout signals. The two trading opportunities shared yesterday remain valid and worth monitoring closely.

PAXG(XAUUSD) forming a reverse head and shoulders pattern.PAXGUSDT is almost forming a perfect reverse head and shoulders pattern. A risk reward setup of 1.91. A modest target of 2429 is possible if it manages to breakout. Reverse H&S patterns are strong reversal patterns.

2 Bullish Patterns under Construction ;-)APL Analysis
Closed at 460.36 (29-05-2025)
2 Bullish Patterns under Construction ;-)
Imemdiate Resistance is around 468 - 470
which needs to Cross & Sustain on Weekly basis.
It may then easily touch 550.
On the flip side, 441 - 445 may act as a Good Support.
& breaking 440 will bring more selling pressure towards
410 - 415.


NVIDIA 1D — When “Head & Shoulders” Aren’t Just for the GymOn the daily chart, NVDA has broken out of the descending channel and reclaimed the 50-day moving average (MA50), triggering a classic inverted head and shoulders formation. Price is now holding above the key $113–$114.50 zone, confirming a structural shift. As volume picks up, buyers are eyeing the next levels of resistance.
Near-term upside targets: – $119.80 (0.5 Fibonacci) – $127.62 (0.382) – $137.28 (0.236) — primary resistance zone – Extended target — $152.91 (1.0 Fibonacci projection)
Technical setup: — Breakout from channel + above MA50
— Inverted head and shoulders pattern completed
— $114.50–$118.00 now acts as buyer support
— EMA and MA convergence supports trend reversal
— Increasing volume on rallies supports bullish momentum
Fundamentals: NVIDIA remains the AI and semiconductor sector leader. Growing demand for high-performance GPUs in AI and data centers positions NVDA as a core tech play. Expectations of strong earnings and continued institutional accumulation support the bullish narrative.
The confirmed breakout and inverted H&S setup mark a clear structural reversal. As long as price stays above $114.50, the path toward $127–$137 remains the primary target zone, with $152.91 in sight if momentum continues.

BCH Analysis for Scalpers (1H)Bitcoin Cash (BCH) is currently showing multiple technical signals that support a potential bullish continuation.
A reversed Head and Shoulders pattern is in the process of forming, and it aligns well with several key confluences — including the Ichimoku Cloud and volume profile support zones.
A breakout above the $430 level would not only confirm the pattern but also activate a bullish flag formation, adding further momentum to the setup. In that case, the next immediate target would be around $452.4.
This setup remains valid only upon confirmation of the breakout. Until then, caution is advised — a clean break and retest would offer the most favorable entry.
— Thanks for reading.
