NVDA - 140 Quasimodo?Well NVDA has exceeded the 120 PoC from the last year, and other than the head and shoulders developing it looks rather bullish above that 120. But I would sell 140, or at least not buy.
And if I'm buying I'd probably wait for 112. Think I will wait forever? 😂
Will update after we get some more data.
Head and Shoulders

Once Crvusd confirms the invh&s breakout the target is .8737Currently firmly above the neckline of this inverse head and shoulders pattern. Could definitely still find a way back below the neckline but if it does return to the neckline and maintain it as support that is a solid place to go long or add to a position for my own personal strategy. *not financial advice*

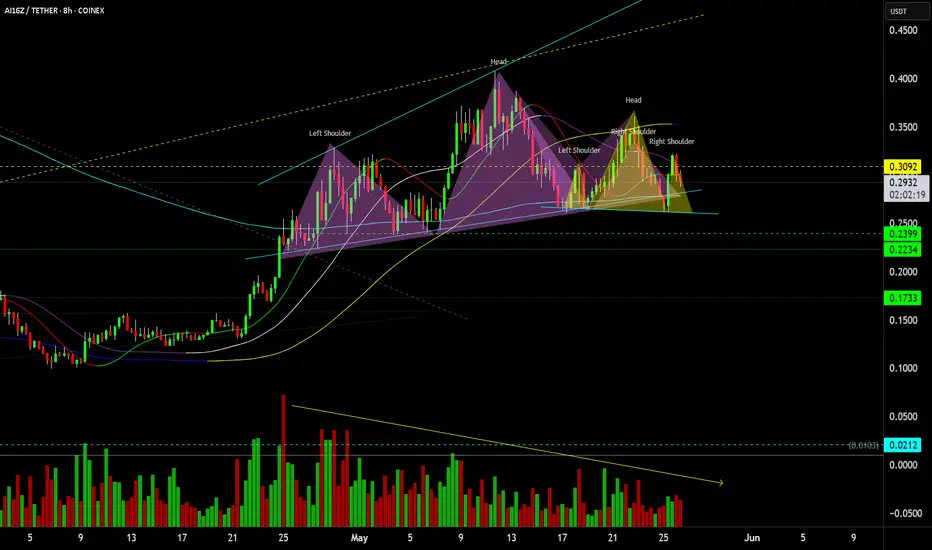
$Ai16z Multi Head & Shoulders top HTFAi16z has formed a HTF Head & Shoulders top with another Head & Shoulders forming within the right shoulder of the HTF H&S with declining volume over the primary formation, all within an Expanding Broadening Wedge top
Infy India is in making of big move ... Disclaimer : This is just a chart analysis based on my understanding. Do your own research before investing.
Looking at daily chart of Infosys, first a chart pattern of M was made in the past which means stock moved up and come down. Now its trying to form a inverted head and shoulder chart pattern. Infosys stock may move up from the current levels.

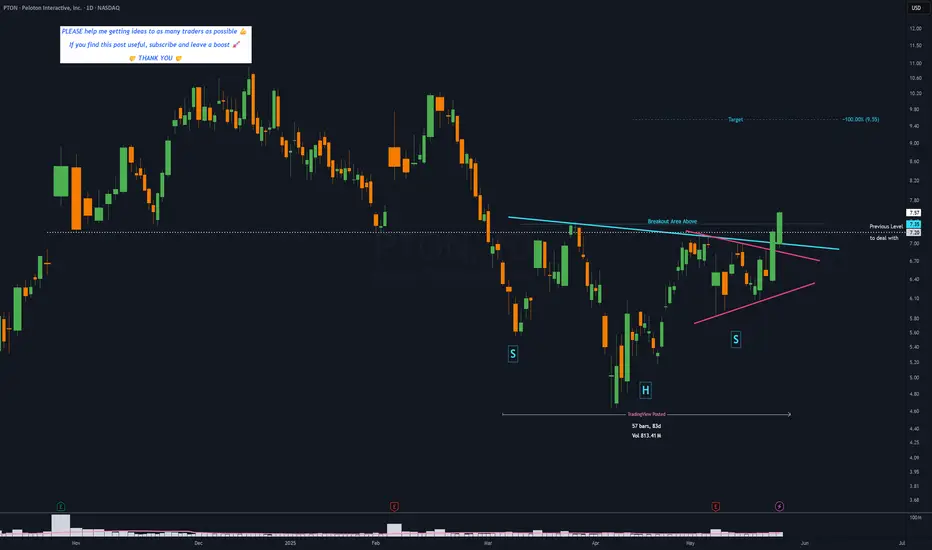
PTON - 3 months HEAD & SHOULDERS══════════════════════════════
Since 2014, my markets approach is to spot
trading opportunities based solely on the
development of
CLASSICAL CHART PATTERNS
🤝Let’s learn and grow together 🤝
══════════════════════════════
Hello Traders ✌
After a careful consideration I came to the conclusion that:
- it is crucial to be quick in alerting you with all the opportunities I spot and often I don't post a good pattern because I don't have the opportunity to write down a proper didactical comment;
- since my parameters to identify a Classical Pattern and its scenario are very well defined, many of my comments were and would be redundant;
- the information that I think is important is very simple and can easily be understood just by looking at charts;
For these reasons and hoping to give you a better help, I decided to write comments only when something very specific or interesting shows up, otherwise all the information is shown on the chart.
Thank you all for your support
🔎🔎🔎 ALWAYS REMEMBER
"A pattern IS NOT a Pattern until the breakout is completed. Before that moment it is just a bunch of colorful candlesticks on a chart of your watchlist"
═════════════════════════════
⚠ DISCLAIMER ⚠
Breakout Area, Target, Levels, each line drawn on this chart and any other content represent just The Art Of Charting’s personal opinion and it is posted purely for educational purposes. Therefore it must not be taken as a direct or indirect investing recommendations or advices. Entry Point, Initial Stop Loss and Targets depend on your personal and unique Trading Plan Tactics and Money Management rules, Any action taken upon these information is at your own risk.
═════════════════════════════
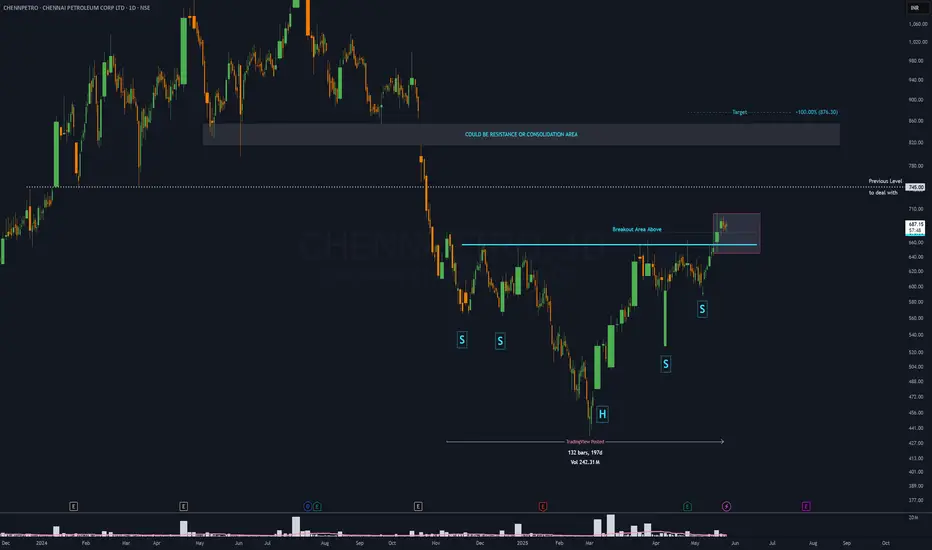
CHENNPETRO - 7 months DOUBLE HEAD & SHOULDERS══════════════════════════════
Since 2014, my markets approach is to spot
trading opportunities based solely on the
development of
CLASSICAL CHART PATTERNS
🤝Let’s learn and grow together 🤝
══════════════════════════════
Hello Traders ✌
After a careful consideration I came to the conclusion that:
- it is crucial to be quick in alerting you with all the opportunities I spot and often I don't post a good pattern because I don't have the opportunity to write down a proper didactical comment;
- since my parameters to identify a Classical Pattern and its scenario are very well defined, many of my comments were and would be redundant;
- the information that I think is important is very simple and can easily be understood just by looking at charts;
For these reasons and hoping to give you a better help, I decided to write comments only when something very specific or interesting shows up, otherwise all the information is shown on the chart.
Thank you all for your support
🔎🔎🔎 ALWAYS REMEMBER
"A pattern IS NOT a Pattern until the breakout is completed. Before that moment it is just a bunch of colorful candlesticks on a chart of your watchlist"
═════════════════════════════
⚠ DISCLAIMER ⚠
Breakout Area, Target, Levels, each line drawn on this chart and any other content represent just The Art Of Charting’s personal opinion and it is posted purely for educational purposes. Therefore it must not be taken as a direct or indirect investing recommendations or advices. Entry Point, Initial Stop Loss and Targets depend on your personal and unique Trading Plan Tactics and Money Management rules, Any action taken upon these information is at your own risk.
═════════════════════════════
JUP/USDT: Classic Inverse Head & Shoulders Breakout!🚀 JUP Inverse Head and Shoulder Breakout – 80% Potential Incoming?! 👀🔥
Hey Traders! If you're all about high-conviction plays and real alpha, smash that 👍 and tap Follow for more setups that actually deliver! 💹💯
JUP is breaking out of a textbook Inverse Head and Shoulders pattern on the 12H timeframe — signaling a strong bullish reversal after a long downtrend.
🟢 Pattern: Inverse H&S
📊 Breakout Confirmation: Neckline flipped into support
🎯 Target Zone: $1.05+
🛡️ Invalidation: Close below $0.534
Momentum is shifting, and bulls seem to be back in charge. If this pattern plays out fully, we’re looking at a potential 70%+ move from current levels.
Let the chart speak. Keep this one on your radar!

INVERTED HEAD AND SHOULDERS!! XRP DAILY!!Consolidation of the left shoulder has formed, the inverted left shoulder has formed, wait for a break-in, once the market closes, wait for retest, then buy to the resistance.

XAUUSD[GOLD]: 1 Hour View Show Extreme Seller Volume Gold in a shorter time frame shows extreme bearish volume kicking in the market, where bulls are failing to push prices higher. Additionally, if you’re someone who analyses patterns, a HEAD AND SHOULDERS pattern has also formed. There are three targets you can aim for.
We extend our best wishes and good luck in your trading endeavours. Your unwavering support is greatly appreciated.
If you’d like to contribute, here are a few ways you can assist us:
- Like our ideas
- Comment on our ideas
- Share our ideas
Team Setupsfx_🚀❤️

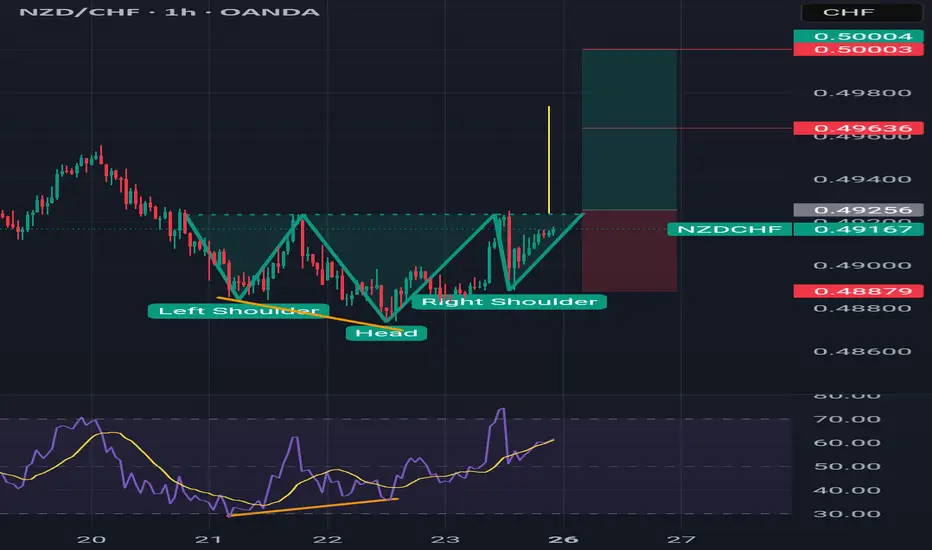
NZDCHF LONG 1HInverse Head and shoulder
Bullish Divergence
Found inverse Head and shoulder at bottomwith bullish divergence
Entry on neckline break
EURAUD – Bullish Breakout from Inverse Head & Shoulders + Target🔍 Pattern Insight: Inverse Head & Shoulders – A Powerful Reversal Formation
On the weekly timeframe, EURAUD has completed and broken out of a textbook Inverse Head & Shoulders (IHS) pattern — a highly regarded bullish reversal setup that often signals the end of a downtrend and the beginning of a sustainable uptrend.
Let’s break it down:
Left Shoulder: Formed in mid-2021 after a strong downtrend, price found support and rebounded, forming the initial shoulder low.
Head: A lower low was established around early 2022, marking the deepest point of the pattern. This represents the last dominant push by sellers before exhaustion.
Right Shoulder: In late 2022 to early 2023, bulls stepped in earlier than before, establishing a higher low — a strong sign of decreasing bearish momentum and accumulation.
Neckline : A descending resistance trendline connecting the peaks between the shoulders and the head. Once broken, it confirms the IHS breakout and trend reversal.
This multi-year formation reflects a major psychological shift: sellers lost control at the head, and buyers gradually regained dominance at the right shoulder, eventually breaking resistance.
📉 Retest in Progress – High Probability Entry Zone
Post-breakout, price action has pulled back for a technical retest of the neckline and curve line support — a dynamic trendline representing growing bullish momentum. This retest is essential for validating the breakout and building the base for a continuation rally.
The convergence of support zones (neckline + curve line) around the 1.70–1.72 area provides a strong confluence zone where buyers may step in again. This is often viewed as a second-chance entry for traders who missed the breakout.
🎯 Measured Target Projection & Resistance Levels
The IHS pattern gives us a clear measured move:
Measured Move Target: Distance from the head to neckline (~2,800+ pips) projected from the breakout point.
Target Zone: 1.92 – 1.95, just above the major resistance zone.
Resistance Zone: 1.85 – 1.87 is a historically significant supply area and may act as interim resistance.
Break and close above the resistance zone would further validate the bullish trajectory and open the door for higher targets.
📌 Risk Management – Defined Parameters
To manage risk effectively, consider:
Stop Loss: Below the recent retest low and curve line support, ideally placed at 1.63848, protecting against a false breakout.
Entry Idea: If bullish confirmation (e.g., bullish engulfing candle, higher low on lower timeframe) appears at retest zone, initiate a long position.
Risk-to-Reward (RR): Targeting 1.92 from an entry around 1.72 offers a 4:1 RR or better — highly attractive for swing and position traders.
🧠 Psychological and Structural Significance
This pattern is not just technical — it represents behavioral change in the market:
The head shows capitulation — a final wave of bearish pressure.
The right shoulder indicates growing confidence in bulls and waning selling interest.
The neckline breakout is where sentiment flips — traders recognize the change and enter long positions, fueling the breakout.
The current retest phase is crucial. Many professional traders wait for this moment to confirm that support holds before fully committing.
🔎 Final Thoughts & Strategy
Trend has shifted bullish on the weekly chart after years of consolidation and decline.
We’re seeing a classic breakout–retest–continuation setup.
A breakout above 1.85 would likely trigger momentum traders and institutions, driving price swiftly toward the 1.92–1.95 range.
Invalidation: Break below 1.63848 would invalidate the pattern and shift sentiment back to neutral or bearish.
📈 Trade Plan Summary:
Pattern: Inverse Head & Shoulders (weekly)
Bias: Bullish
Entry Zone: 1.70 – 1.73 (retest area)
Target: 1.92+
Stop Loss: Below 1.63848
Risk Level: Medium (weekly setup, but long-term play)

Potential Inverse H&S120660 should be Crossed & Sustained
for further Upside (with Good Volumes)
Inverse H&S Potential Target is around 138000-140000

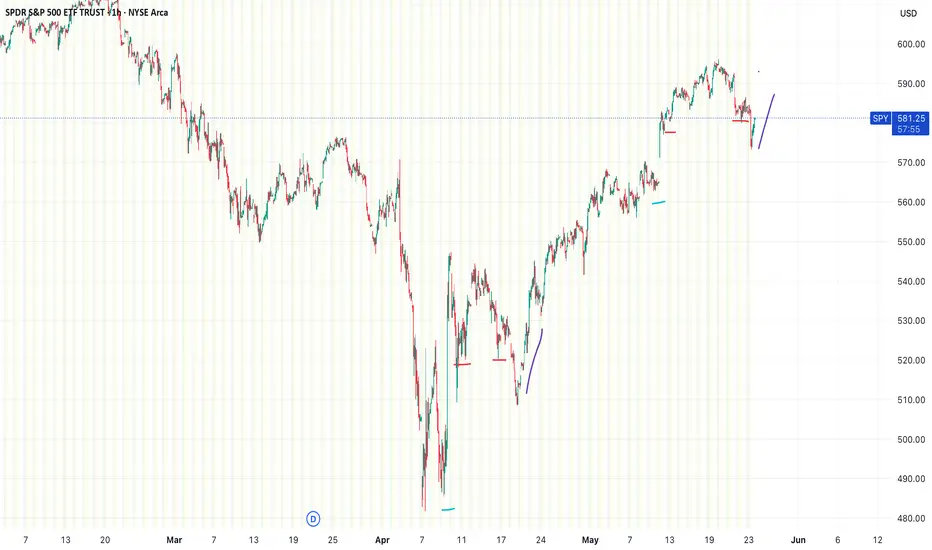
Repeat of Late Apr-May lows & rallyThe chart shows the SPDR S&P 500 ETF Trust (SPY) on a 1-hour timeframe, with a pattern appearing to be repeating itself from late April/May(Liberation day announcements) dip and then boot and rally from trade announcements, all marked by colored lines.
The colored lines (blue, red, purple) highlight a recurring price action setup. Each set of lines seems to mark a sequence of movements:
Blue: Sharp drop, then gap up
Red: Consolidation at a lower higher from gap up, return to high, consolidation back lower at previous lower high
Purple: Breakout & reversal upward.
Walmart Head & Shoulders on Daily and Weekly chartWalmart (WMT) may be forming, or already has formed, a bearish Head & Shoulders pattern.
#WMT #Walmart #bearish #short #headandshoulders #retail #discountstore

Dow Jones breakdown or setup for 15 percent rally?The Dow looks weak but this might be the setup traders dream of. We break down two possible bullish patterns forming — an inverse head and shoulders and an ascending triangle — and explain how Trump’s EU tariffs could shape the next move. Target gains up to 15 percent with risk reward ratios as high as 7.5 to 1.
This content is not directed to residents of the EU or UK. Any opinions, news, research, analyses, prices or other information contained on this website is provided as general market commentary and does not constitute investment advice. ThinkMarkets will not accept liability for any loss or damage including, without limitation, to any loss of profit which may arise directly or indirectly from use of or reliance on such information.

Novo 1h longShould get up and at least break the neckline from the bigger SHS/IHS.
Stop below zone or lower trendline.

GBPUSD Head and Shoulders PatternIf GBPUSD drops to 1.3255, the Head and Shoulders pattern will be confirmed.
This is a bearish signal, and it could be a good time to consider a short position.
Watch this level closely.

BNB Ready for a Major Breakout? Head & Shoulders Pattern in PlayMarket Insight:
#BNB is currently trading in a prime buying zone for spot traders, showing strong price action on the 4-hour timeframe. A Head and Shoulders (H&S) pattern is forming, and we are closely monitoring its breakout for a potential bullish move.
🔹 Bearish Signs? None so far! The market structure remains intact, and buyers seem to be in control.
Trade Plan for Bulls:
🔹 Breakout Confirmation: A clean break above the neckline of the H&S pattern will confirm bullish momentum.
🔹 Entry Zone: After confirmation, a long position can be initiated with proper risk management.
🔹 Stop Loss & Risk Management: Place a stop-loss below the right shoulder to manage risk effectively.
🔹 Potential Target: If the breakout holds, we could see a strong upward move toward key resistance levels.
🔹 Chart Analysis: (Attach a well-annotated chart with clear trendlines, breakout zones, and risk-reward levels)
🔹 What’s Your Take?
Do you think #BNB will break out or face rejection? Drop your thoughts in the comments!
Like & Follow for more real-time trade setups!

Is this Bitcoin’s final push before altcoin season?Bitcoin breakout confirmed. But what if AVAX and other altcoins are where the real profits are hiding? Let’s talk targets, setups, and the coming shift in momentum.
This content is not directed to residents of the EU or UK. Any opinions, news, research, analyses, prices or other information contained on this website is provided as general market commentary and does not constitute investment advice. ThinkMarkets will not accept liability for any loss or damage including, without limitation, to any loss of profit which may arise directly or indirectly from use of or reliance on such information.

5/22 Gold Trading SignalsGood afternoon everyone!
Yesterday's trading session was a bit bumpy, but in the end, we achieved considerable profits.
Today, gold rose to around 3346 and then began to pull back. It is now approaching the 3300 support level.
🔍 From a technical perspective, the candlestick structure and several indicators suggest that bears may still attempt further downside:
Primary support area: 3288–3276 — if this holds, a rebound is expected, with resistance around 3309–3316.
Secondary support area: 3263–3248 — if it breaks lower, watch for a short-term bounce around 3276-3282.
📰 On the news front, Initial Jobless Claims and PMI data will be released today. These could trigger short-term volatility.
📌 Trading strategy for today includes two key scenarios:
If the data is bearish for the dollar and gold drops to 3253, look for buy opportunities.
If the data is bullish and gold rises to 3358, it's a good spot to sell into strength.
📈 Today’s Trading Recommendations:
📉 Sell near 3358–3372 (Resistance zone)
📈 Buy near 3263–3248 (Support zone)
🔁 Flexible intraday levels: 3253 / 3268 / 3277 / 3286 / 3298 / 3309 / 3316 / 3328 / 3348
Wishing everyone a smooth trading day. Feel free to leave a comment if you have any questions—I’ll get back to you as soon as possible.

ElectroCast SteelSwing Trade for existing share holders
Down trend expected with head & shoulder pattern

LTCUSD has formed a head and shoulders bottomOn the daily chart, LTCUSD has formed a head and shoulders bottom pattern, and the short-term market is dominated by bulls. At present, attention can be paid to the resistance near 107.0. If it breaks through, it is expected to continue to rise, and the upper target is the previous supply area of 123.6-140.0.

Zero coupon bonds 🚀This is the most extreme US Treasury bond ETF. Basically pay some amount and get back face value in 25 years. Inflation would kill these, whereas deflation and falling interest rates will send this to the moon.
Interestingly this pays a dividend in line with other bonds, I looked it up and it looks like the fund has to do this for tax purposes, but the underlying security has literally a Macaulay duration of 25 years. TLT by comparison is 17 years (per iShares website), so duration risk is 50% higher.
Using fibs a modest pullback to 78, completing a IHS, would be a great place to start loading up, assuming 1) this thing doesn't just take off right here, and 2) I'm not totally wrong and inflation comes back next year.
