Breakout on Vodafone?Looks like a Head and shoulders reversal, plus breakout this week. Too early to say though as it still needs confirmation. Could still be a fake-out?
This is not a solicitation to trade in Vodafone shares.
Head and Shoulders

NASDAQ (CASH100) SHORT - Head and shoulders H1Risk/reward = 3.8
Entry price = 23 167.9
Stop loss price = 23 232.8
Take profit level 1 (50%) = 22 943
Take profit level 2 (50%) = 22 878
Still waiting on confirmation on some variables in checklist

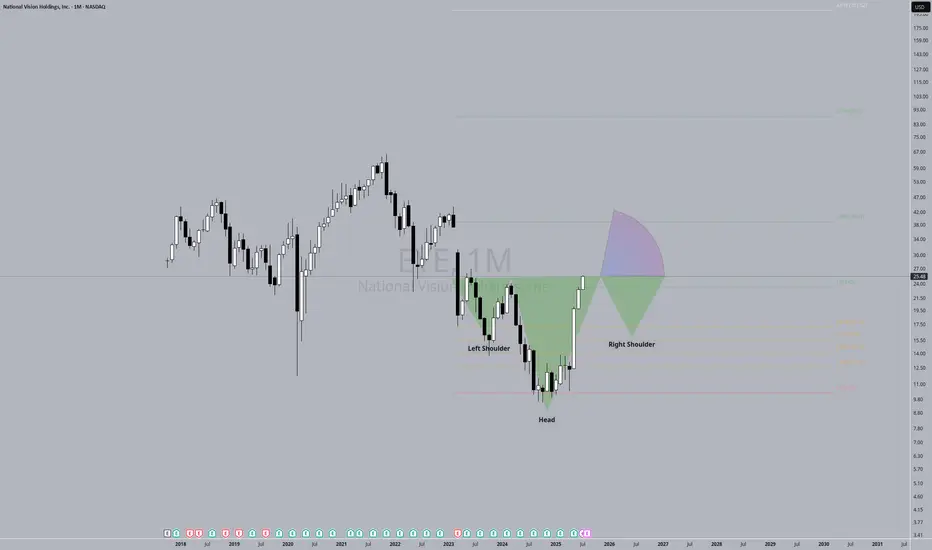
EYE inverted H&STA: I could see a pull back around to around the $17 level. Ultimately I see this going as high as $38.
F: Our eyes are just getting worse, we will only be sitting in front of more screens, and taking more harmful medicines that could damage eyes. I'm long eye care.
HEAD & SHOULDER DAILY TIME FRAME! (DOUBLE WHAMMY!!!!)The market has previously created a left shoulder. Now, it has broken out of the top of the Resistance and broken back into the support and resistance, about to form the right shoulder.
Wait for retest of the resistance then sell to the support, AND THEN BUY IT BACK TTHE RESISTANCE!! DOUBLE WHAMMMY!!

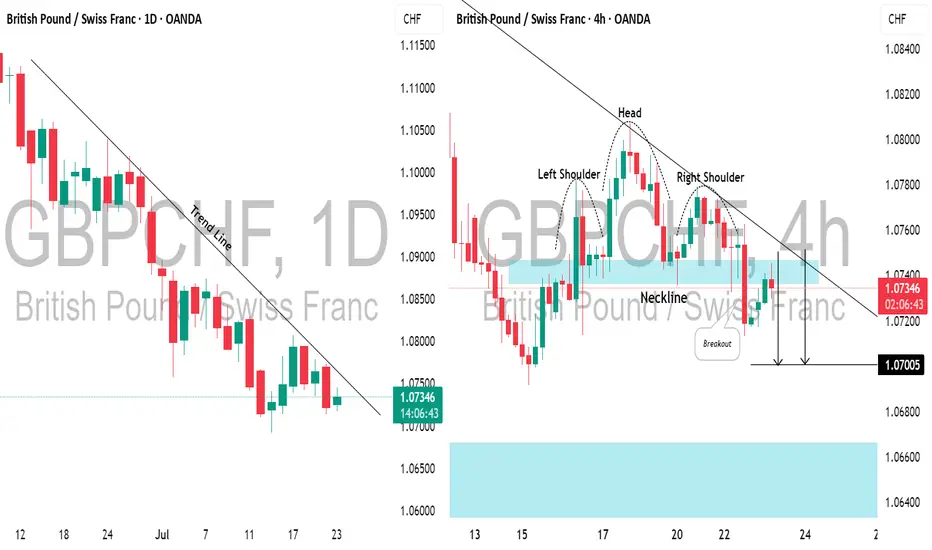
GBPCHF: Bearish Move From Trend LineI spotted a strong descending trend line on 📉GBPCHF, with the price rising to that last week on a daily.
As it tested this level, the pair formed an inverted head and shoulders pattern on a 4-hour time frame.
The neckline has recently been broken and retested.
I anticipate a bearish move towards the 1.0700 level now.
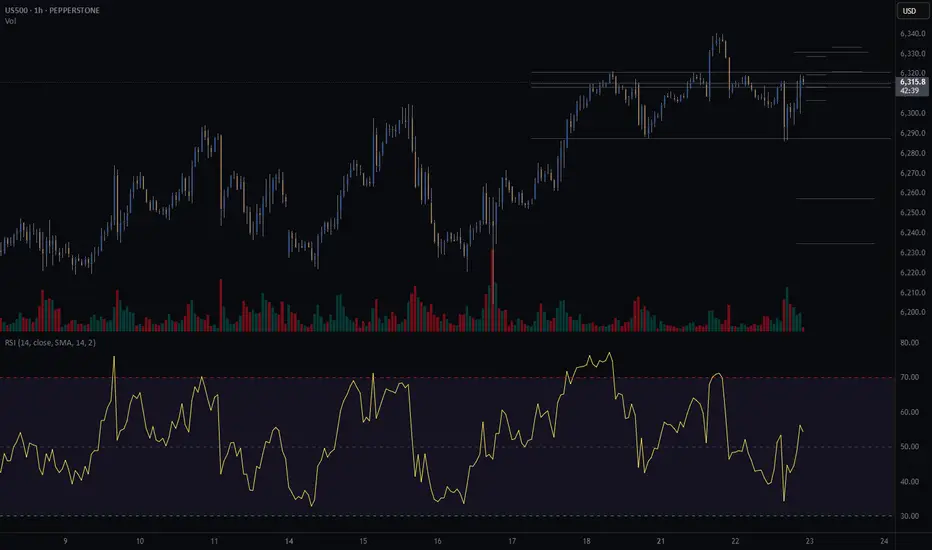
S&P500 (CASH500) SHORT - Head and shoulders Risk/reward = 5.8
Entry price = 6321.1
Stop loss price = 6333.5
Take profit level 1 (50%) = 6257.3
Take profit level 2 (50%) = 6234.9
Still waiting for confirmation on a few variables before I enter the trade.
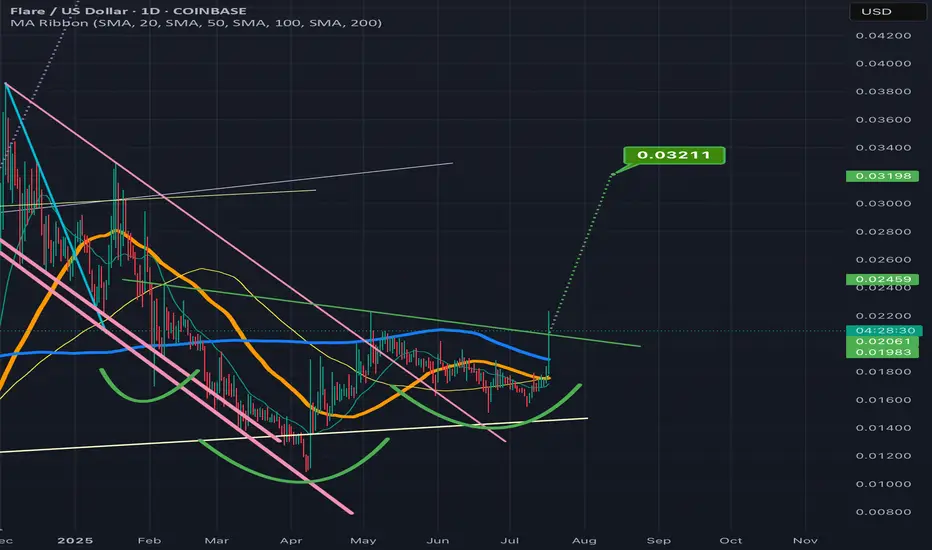
FLRUS breaking above the invh&s necklineNice it confirms the breakout the target is around 3 cents. Could always dip back below the neckline a time or two before that happens, but considering how it feels lke we are finally confirming an altseason here with bitcoin dominance taking a big dump probability highly favors an eventually validation of this breakout on flr. *not financial advice*
Short - AMDTime period for this play : week to months
Analysis : Elliot wave 12345 ABC. Expect hitting .618 and bounce back up to go higher.
Pattern if wave B completed : Head & Shoulder
Price Target: Wave ABC
ETA Timeline for correction. Please refer to the chart.
Upcoming events:
Tariff active on 8/1/25 - Friday
Earning on 8/5/25 - Tuesday
Top is not in yet, so 2 Possible top-in levels:
Top 1 - $163.45 : Retesting to hit 163.45, rejected, and break $158
Top 2 - $173.94 : Breaking 163.45 and reject at 173.94
=> Overall, It begins trading side way and show some weakness now.
The correction may not pull back to .618, which is the best level. Other scenarios:
- 0.5 fib, where it test wave 3
- 0.328 fib, strong bullish level if it doesn't break & go to the upside faster

China A50 Breakout: 14% Opportunity Amid Summer Lull?Markets are quiet, but the China A50 is heating up. A bullish inverse head and shoulders pattern has formed, backed by stimulus hopes. Target upside is 14% with a strong risk-reward setup. Are you ready to trade it, or still on holiday?
This content is not directed to residents of the EU or UK. Any opinions, news, research, analyses, prices or other information contained on this website is provided as general market commentary and does not constitute investment advice. ThinkMarkets will not accept liability for any loss or damage including, without limitation, to any loss of profit which may arise directly or indirectly from use of or reliance on such information.

GBPUSD Long Trade Alert – Inverted Head & Shoulders BreakoutGBPUSD has confirmed a classic Inverted Head & Shoulders pattern, signaling a strong bullish reversal opportunity on the 2-hour chart. Price has successfully broken above the neckline resistance zone (~1.3490) and has now retested that zone, forming a bullish engulfing candle — an ideal confirmation for long entries.
🟢 Trade Plan:
Entry: After bullish engulfing candle formed on neckline retest (~1.3490–1.3500)
Stop Loss: Just below the right shoulder low / retest swing low (~1.3455)
Risk/Reward Ratio: ~4:1 (High reward with tightly controlled risk)
🎯 Target Levels:
Target 1: 1.3555
Final Target (Projected): 1.3620
These levels align with structure resistance and measured move of the pattern
📌 Why This Trade Matters:
Pattern confirmed ✅
Retest successful ✅
Bullish confirmation candle ✅
Clean invalidation and upside potential ✅
This is a textbook reversal play, offering solid structure, clear stop placement, and attractive upside. Perfect for swing traders or short-term position setups.
📉 Trade what you see, not what you think. Let price action lead your execution.
=================================================================
Disclosure: I am part of Trade Nation's Influencer program and receive a monthly fee for using their TradingView charts in my analysis.
=================================================================

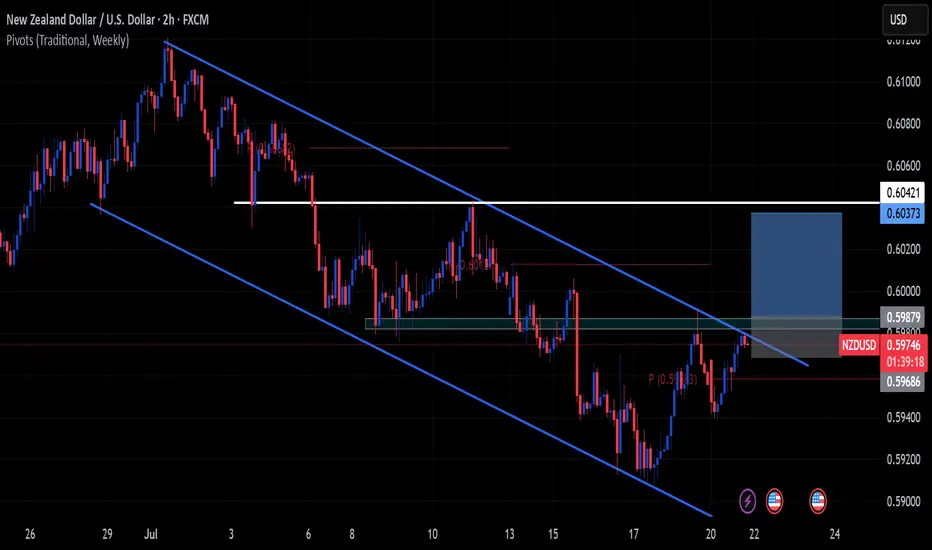
NZDUSD Buy C setupHello traders this is a nice setup but it doesn't have that much confluence!!
Clear!!
Not sweet because of how far the pivot point is from my Sl.
we aslo have a weak Head and Shoulders at the bottom I hope you can see it.
Selling USDCHFHello traders Hope you are having a wonderful week!!
Clear downtrend!!
We can say about 4 touch trendline but technically its 3.
You can see it!!

VRSK - 5 months HEAD & SHOULDERS══════════════════════════════
Since 2014, my markets approach is to spot
trading opportunities based solely on the
development of
CLASSICAL CHART PATTERNS
🤝Let’s learn and grow together 🤝
══════════════════════════════
Hello Traders ✌
After a careful consideration I came to the conclusion that:
- it is crucial to be quick in alerting you with all the opportunities I spot and often I don't post a good pattern because I don't have the opportunity to write down a proper didactical comment;
- since my parameters to identify a Classical Pattern and its scenario are very well defined, many of my comments were and would be redundant;
- the information that I think is important is very simple and can easily be understood just by looking at charts;
For these reasons and hoping to give you a better help, I decided to write comments only when something very specific or interesting shows up, otherwise all the information is shown on the chart.
Thank you all for your support
🔎🔎🔎 ALWAYS REMEMBER
"A pattern IS NOT a Pattern until the breakout is completed. Before that moment it is just a bunch of colorful candlesticks on a chart of your watchlist"
═════════════════════════════
⚠ DISCLAIMER ⚠
The content is The Art Of Charting's personal opinion and it is posted purely for educational purpose and therefore it must not be taken as a direct or indirect investing recommendations or advices. Any action taken upon these information is at your own risk.

Natural gas spotHead and shoulder pattern observed and neo wave wise also appear either neutral triangle , if break neck line good fall and then near another bigger head and shoulder neckline. Let see

GBPAUD: Bullish Movement Continues 🇬🇧🇦🇺
GBPAUD is going to rise more, following a confirmed intraday bullish reversal:
first, the price violated a resistance line of a falling channel.
It started to consolidate within an inverted head & shoulders pattern then.
Its neckline violation is another strong bullish signal.
Next resistance - 2.0685
❤️Please, support my work with like, thank you!❤️
I am part of Trade Nation's Influencer program and receive a monthly fee for using their TradingView charts in my analysis.

Crvusdt buy opportunityCRVUSDT is forming a potential inverse head and shoulders pattern, with price approaching the neckline zone. The marked entry range offers a strategic buy opportunity for early positioning. A confirmed breakout above the neckline would signal strong bullish continuation, with the final target outlined on the chart. Let us know your thoughts on CRV.

SHORT ON USD/CHFUSD/CHF has given a nice head and shoulders pattern on the 2hr timeframe.
I expect price to sweep sell side liquidity below the uptrend line and tap into the next level of support.
Looking to catch over 132 pips to the downside.

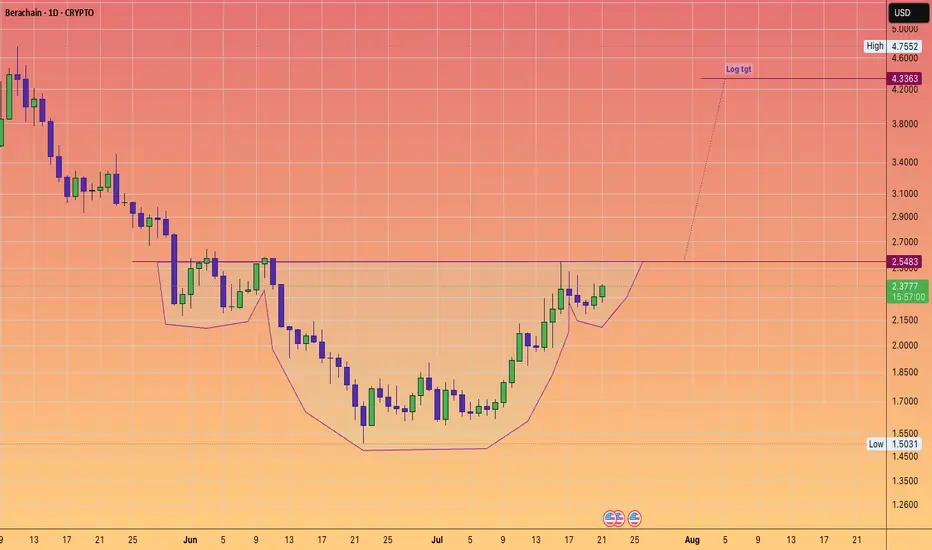
Berachain MOGGING the bears! Back to over $4#InverseHead&Shoulders
clean setup
log tgt provided.
sorry its altseason 100 things going on
no lengthy description needed :)
GBPAUD Bullish BiasPrice has entered the weekly demand zone and formed an inverse head and shoulders.
Price also shows bullish divergence on the RSI indicator.
Recent fundamental news of AUD showed increase in unemployment and father rate cuts are expected in the near future.

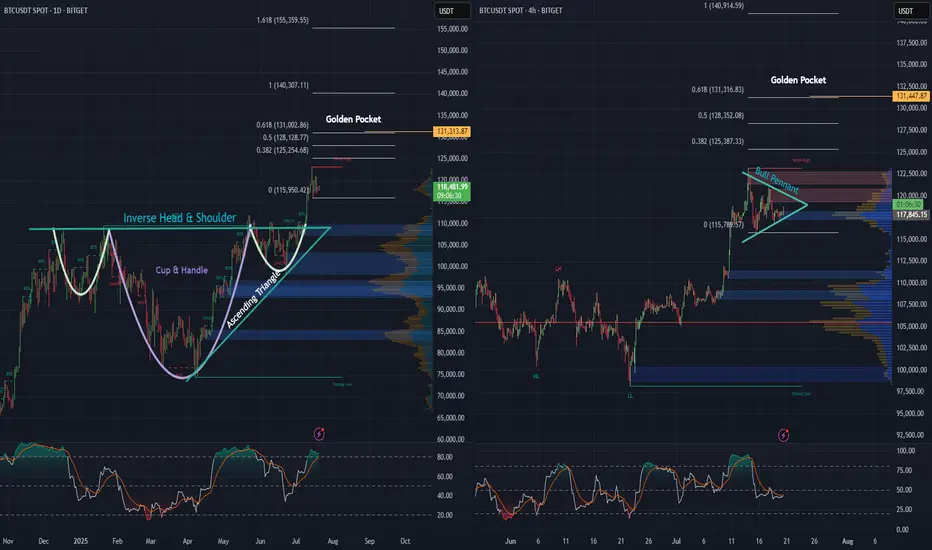
BTC daily, and 4 hr. Bullish Patterns Stack Up!Looking at the Daily and 4-hour charts for BTC, we can see multiple bullish formations unfolding.
An inverse head and shoulders - daily
A cup and handle - daily
An ascending triangle - daily
Price action looks strong, as we’ve begun the breakout from the neckline on the inverse H&S, as well as the cup and handle and ascending triangle simultaneously, and momentum is building fast.
Also, on the 4-hour chart, there’s a pretty substantial bull pennant taking shape. A breakout here could be the next leg up, and the push needed to keep momentum alive.
Zooming out, when we apply the trend-based Fibonacci extension, it reveals a $131,000 golden pocket, on both the the daily as well as the 4 hr. And that could be a major upside target if these bullish structures hold.
Stay tuned to see if BTC continues its move and sets a new all-time high.
Bitcoin: Promising Patterns and Potential BreakoutBitcoin's recent price action has been nothing short of captivating for traders and analysts alike. On the daily chart, we've observed the formation of an Inverse Head & Shoulders and a Cup & Handle pattern, both of which have now transitioned into a Bull Flag. These bullish signals suggest a strong potential for upward movement.
Zooming into the 4-hour and 1-hour charts, we can see prominent Ascending Triangles taking shape. These patterns are often harbingers of significant breakouts, and it appears that Bitcoin is winding up for a substantial move.
Moreover, when utilizing a Trend-based Fibonacci Extension on the daily timeframe, the golden pocket points to a target of $126k, with the next pocket at $185k. This aligns with historical data and technical indicators, suggesting that Bitcoin might be poised to rewrite history once again.
Stay tuned as we monitor these developments and anticipate what could be a historic breakout for Bitcoin!

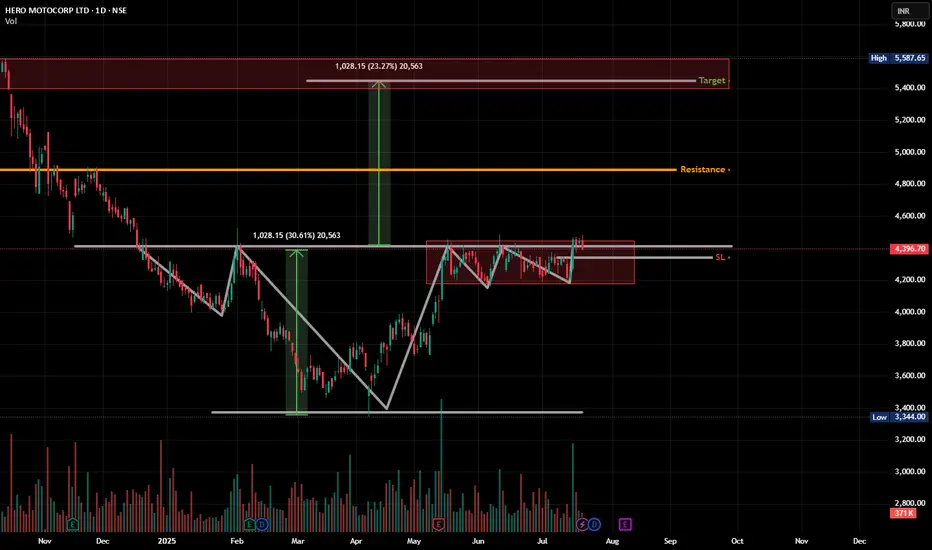
HEROMOTOCO - Multi-Right Shoulder H&S (it works out too much)Pattern Watchers!👀
We usually get one head, one left shoulder, and one right shoulder, right?
But this chart said: "Why stop at one? Let’s bulk up the right side!" 😂
🧠 Head & Shoulders spotted –
✔️ Classic neckline around ₹4390
✔️ Multiple failed breakouts but price holding above range
✔️ Right shoulder has been gymming, forming a clean range
📏 Potential breakout target = ~₹5400
🧱 Resistance zone above (highlighted in red) may act as the next boss level
🎯 Watch for:
Break and hold above ₹4450–₹4480
Volume confirmation
Avoid fakeouts — price needs to STAY above neckline
💡 Bonus thought: This could also be interpreted as an Inverse H&S breakout from March, and this range is just a healthy consolidation.