TRB : FREE SIGNALHello friends🙌
📈Given the price reaching its bottom and the buyers supporting it, you can see that a classic head and shoulders pattern has formed and buyers have entered. For this reason, you can buy with capital and risk management and move with it to the specified targets.
🔥Follow us for more signals🔥
*Trade safely with us*
Head and Shoulders

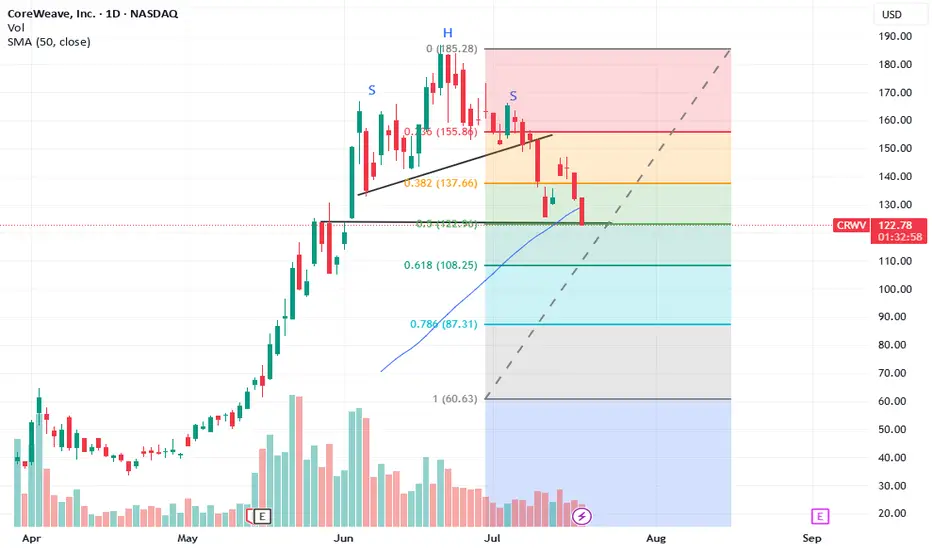
Inverted head and shoulder suspected ..keep an eye on necklineHi dear friends and followers, I suspect this inverted head and shoulders pattern with a neckline around 160 usd. If it breaks in, it can go down toward the inferior support level around 130 usd and the 0.618 Fibo. If it breaks out it can go up until the next resistance and psychological level of 200 usd. As you can see, this 200usd resistance level does match with a large ascending channel.
You all need to DYOR and keep an eye on RSI and volume to confirm the movement and take a trade.
Wishing you the best and success on your decision.

Coreweave retesting supportAfter a recent pop off the support line, it looks like the stock will retest these levels. Also, note the clear H&S pattern over the last several months. I'm expecting a breakdown below support in the next week or two.
NAS100 (CASH100) SHORT - head and shoulders 30minRisk/reward = 3.9
Entry price = 23 137.9
Stop loss price = 23 153.9
Take profit level 1 (50%) = 23 071
Take profit level 2 (50%) = 23 060
Still need to validate a few variables.
Lets goooooo

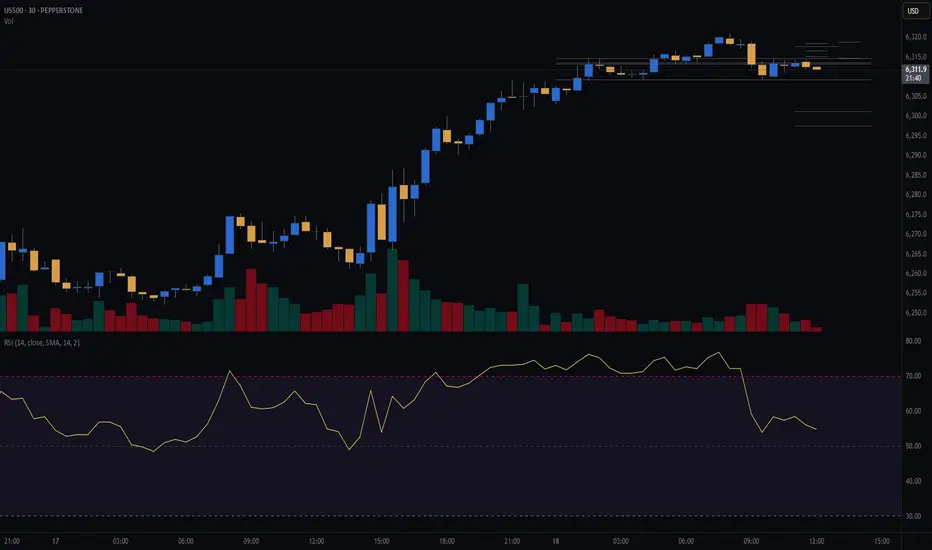
S&P500 (CASH500) (SPX500) SHORT - Head and shoulders 30minRisk/reward = 3.3
Entry price = 6314.8
Stop loss price = 6318.4
Take profit level 1 (50%) = 6301.3
Take profit level 2 (50%) = 6297.5
Waiting on validation from a few other variables.
For example, waiting for the current 30min candle to close in range.
Letssss goooooo
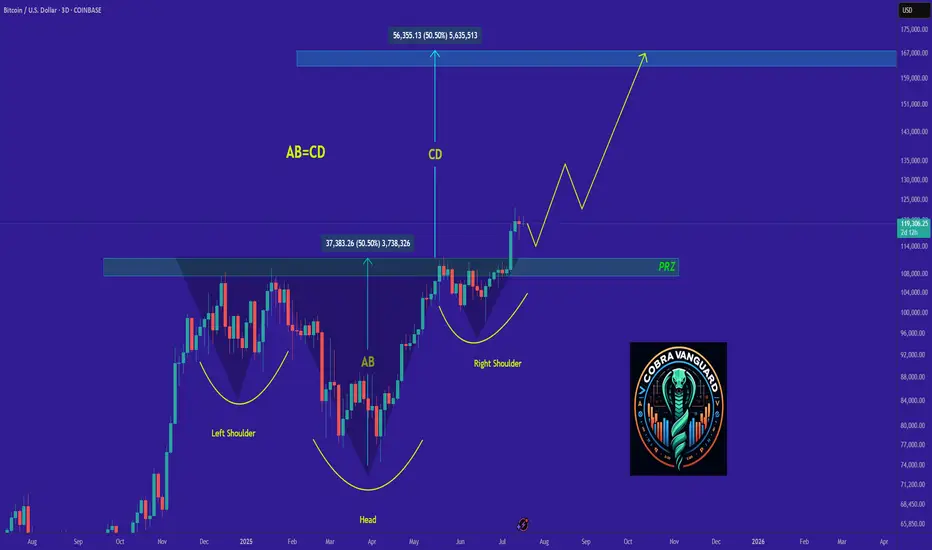
Bitcoin is bullish now & many Traders don't see it !!!I might be wrong and this might never happen, but it might come true From a technical perspective!!!
Remmember
Stay Awesome , CobraVanguard.
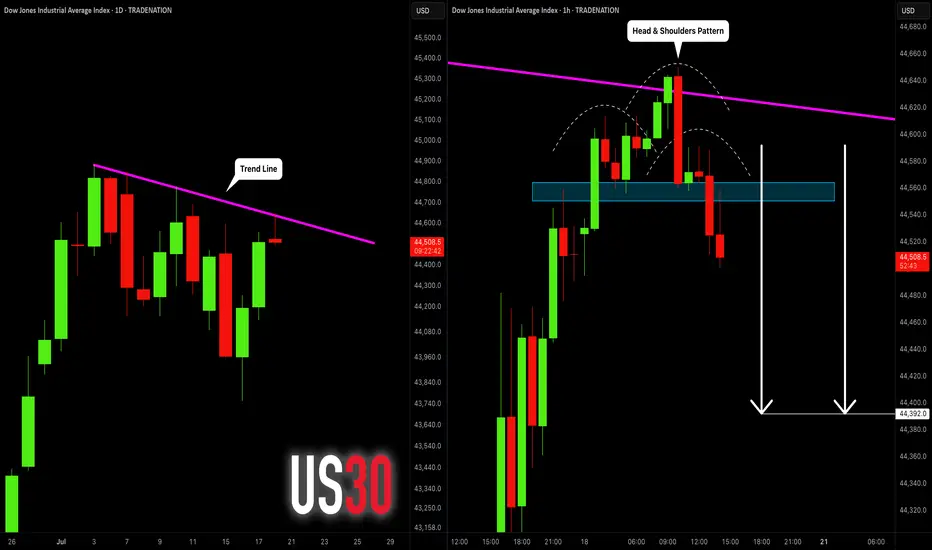
DOW JONES INDEX (US30): Bearish Move From Trend Line
I see a test of a strong trend line on US30.
The price formed a head & shoulders pattern on that
and a breakout of its neckline on an hourly time frame.
I expect a retracement to 48390
❤️Please, support my work with like, thank you!❤️
I am part of Trade Nation's Influencer program and receive a monthly fee for using their TradingView charts in my analysis.
UK100 short - head and shoulders H4Risk/ reward = 4.6
Entry = 8 998.5
Stop loss = 9 034.2
Take profit level 1 = 8 859.8
Take profit level 2 = 8 794
Still need confirmation,
Waiting for H4 candle to close at 23.00 and will need to validate volume.

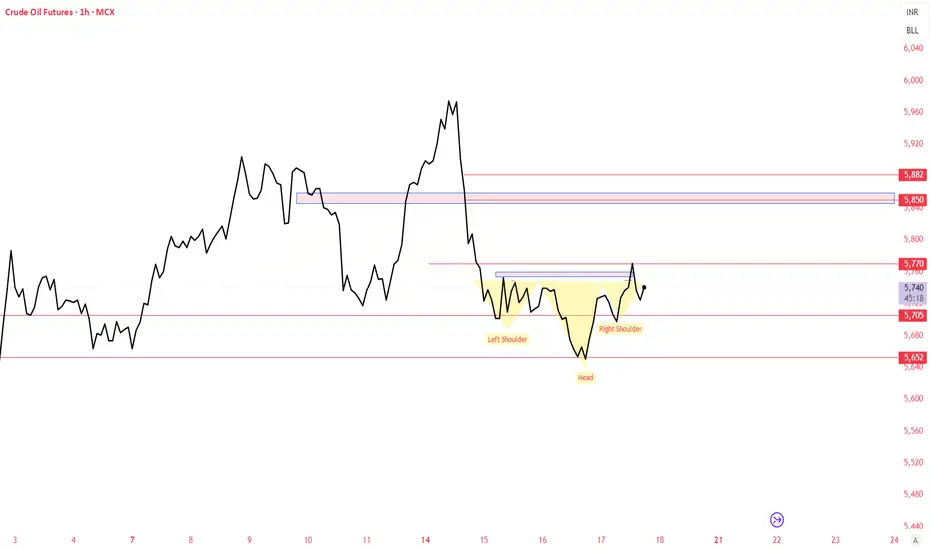
CRUDEOIL - MCX INVERTED HEAD AND SHOULDERCrudeoil on 1 hour time frame forming Inverted head shoulder which is consider as bullish Pattern. Strong Support of 5680 , crudeoil may do 5826-5820-5850
Please do your own research before taking any trading decisions
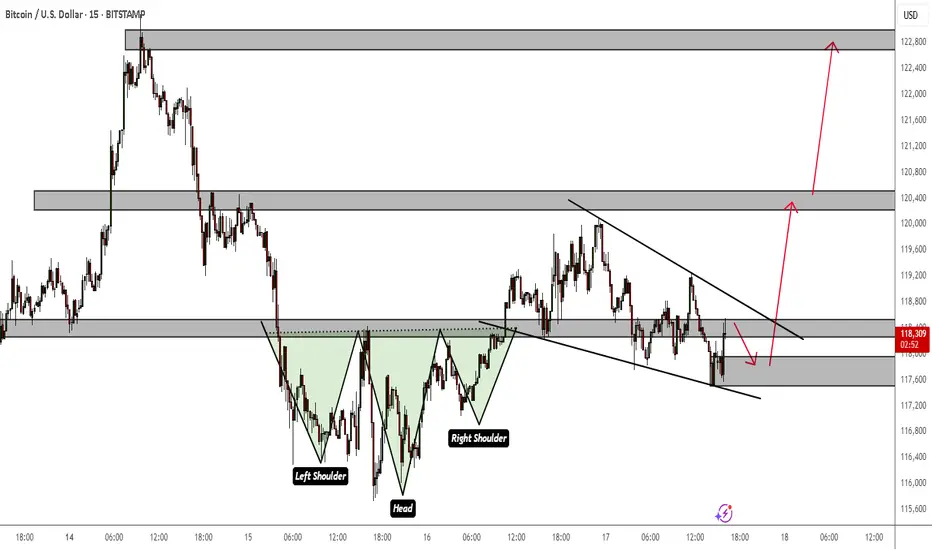
BTCUSD Bullish Continuation Patterns on LTFThe trend is still bullish and the daily bull flag I posted is still at play. This is just a lower TF perspective within the bigger overacharching view.
Inverse head and shoulders and a bullish flag all indicate continuation to the upside. You can use market structure to confirm your entries and your target profit zones if you do not plan on holding until $150k
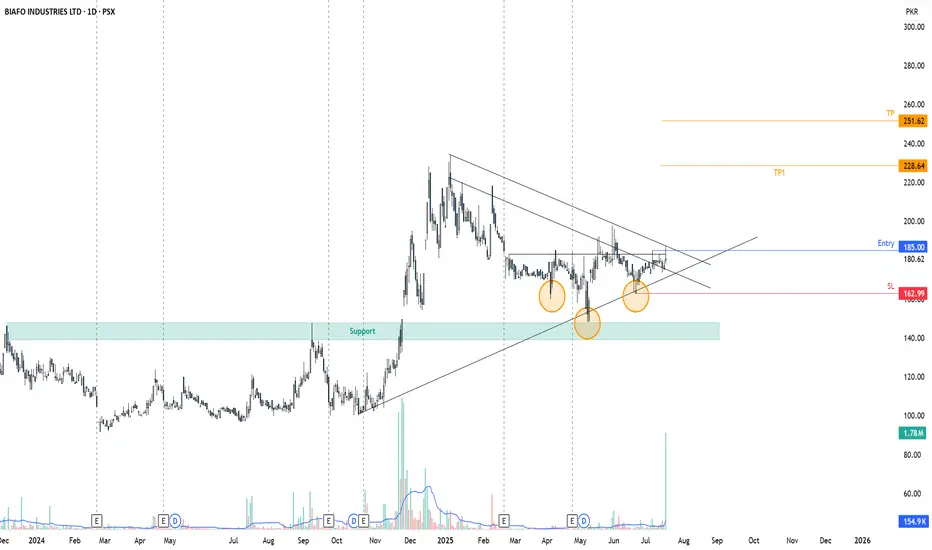
Are you seeing BIFO next Upper cap?BIFO has already shown bullish divergence and formed an Inverted Head and shoulder pattern. On the breakout of Resistance, it can make a fine move.
Are you seeing it next Upper cap?
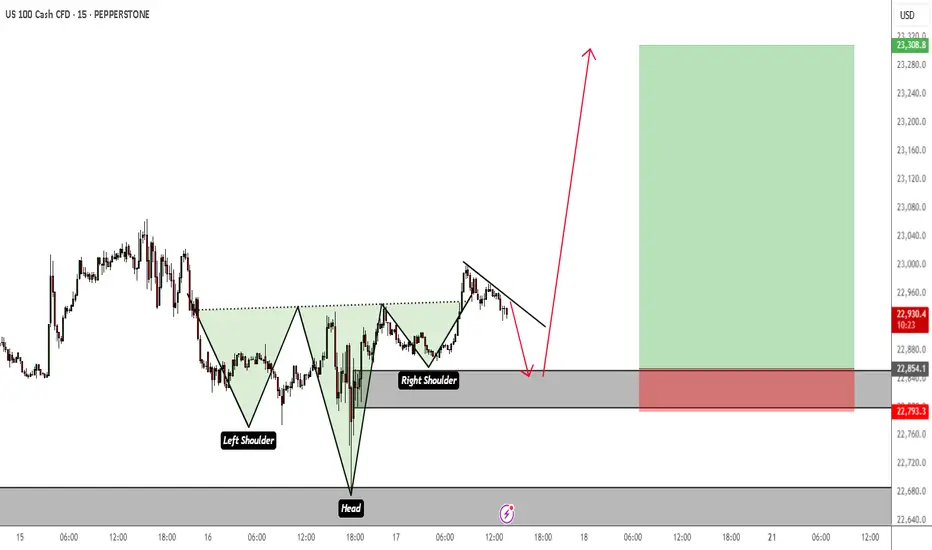
NASDAQ Inverted Head & Shoulders Retest Before Bullish MomentumI see a possible retest of an Inverted Head and Shoulders on M15 TF before the bullish momentum resumes. The SL and TP are just a rough estimation. Price could dip a bit lower than that.
But my overall bias is bullish.
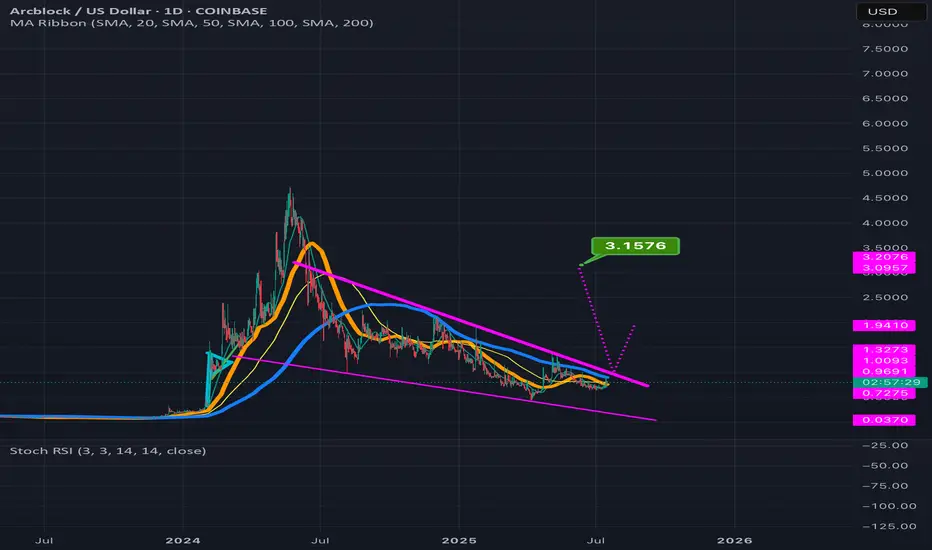
ABT can potentially 4x in value reading up from the wedge its inThe smaller pink dotted measured move line is for the inv h&s pattern its formed inside the wedge with the top trendline of the wedge doubling as the invh&s pattern’s neckline. Hitting that smaller target is more or less a 2x from current price action. If we hit the full falling wedge target that’s a 4x from where it is currently. *not financial advice*
Total2 wants to inv h&s its way into completing its cup’s handleShould break above the neckline of this lemon lime colored inverse head and shoulder pattern in the upcoming 1-3 weekly candles here, and we are likely less than a week a way from the daily chart golden cross (not shown here). The breakout target from this inverse head and shoulder pattern will take price above the rimline of the larger cup and handle pattern and upon triggering the breakout from that we head to the light blue erasure move target which fro where price action currently is is about a 100% gain for the alt racket which should confirm alt season. *not financial advice*

The daily chart for total2 to look at the impending golden crossWanted to also post a daily chart tie frame of my previous idea. I first posted it in weekly to fit the entire cup and handle breakout target in the frame, but wanted to also post the daily time frame to provide both a close up of the inverse head and shoulders pattern as well as the impending golden cross on the daily time frame. Loos very likely that alt season may finally be approaching here. Gonna pay close attention to both this chart and the bitcoin dominance chart btc.d to know for sure. *not financial advice*

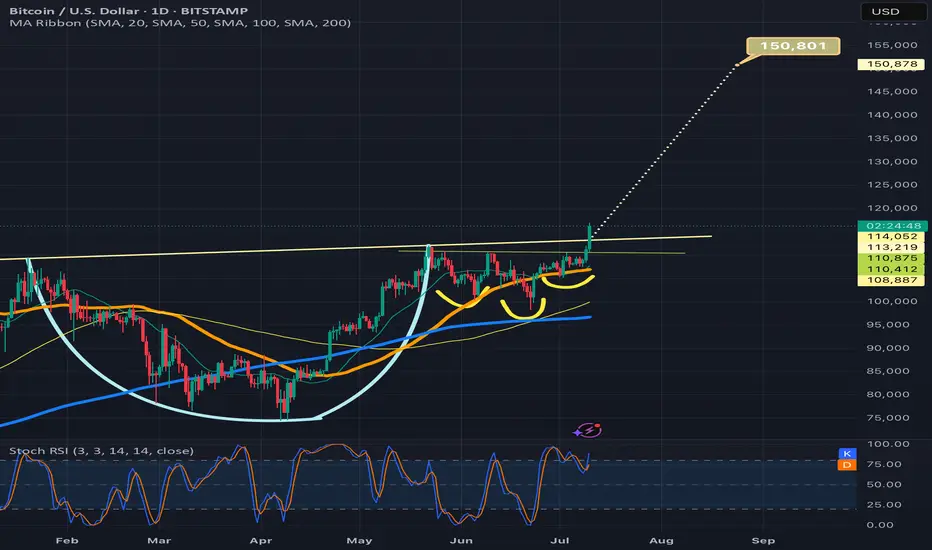
Btcusd breaking above cup and handle necklineIf it confirms the bullish breakout the target is 150k. Also by breaking above 116k and solidifying that level as strong support, we will trigger an even bigger inverse head and shoulders pattern (not shown here) with a breakout target around 208k! I will provide a link below to the chart I posted of that pattern. Thanks for reading, liking, and following. *not financial advice*
Current XAUUSD TradeDate: July 16, 2025
Platform: TradingView (Demo Account)
Timeframe: 15M (Entry), 4H (Bias/Context)
Direction: Long
Status: Entry zone identified, waiting for confirmation
Strategy Type: POI Re-entry after BOS (Break of Structure)
⸻
🔍 Market Context
• On the 4H, bullish BMS is confirmed after sweeping sell-side liquidity.
• Price has aggressively moved upward, showing intent to continue bullish.
• 15M structure now shows break of previous SND zone, shifting lower-timeframe flow to bullish.
• POI zone identified — price likely to return here for a mitigation tap before full continuation.
⸻
🧠 Trade Rationale
• POI marked as a mitigation zone for re-entry after BOS on 15M.
• Confirmation will be valid only after price closes above the wick (shows strength).
• Expecting return to POI to mitigate imbalance or unfilled orders.
⸻
📍 Entry Criteria
• POI zone: between ~3,327 and 3,316
• Watch for:
• Bullish SFP (swing failure pattern)
• Bullish engulfing candle
• 15M BOS + higher low confirmation inside POI
• Entry trigger: Price must close above the wick, then return to POI with bullish reaction
⸻
🧾 Management Plan
• Stop Loss: Below POI (~3,316 or slightly lower)
• Take Profit: 3,492 (upper 4H imbalance zone)
• Trail stop based on 15M structure if price accelerates
⸻
😌 Emotional Reflection
Comfortable identifying refined entry after HTF structure shift. No FOMO — POI must react cleanly and respect my conditions.
⸻
✅ Reflection Questions
• Did I wait for the proper 15M BOS before marking my POI?
• Did I define my confirmation model clearly?
• Will I enter only if the wick is closed above and POI is respected?

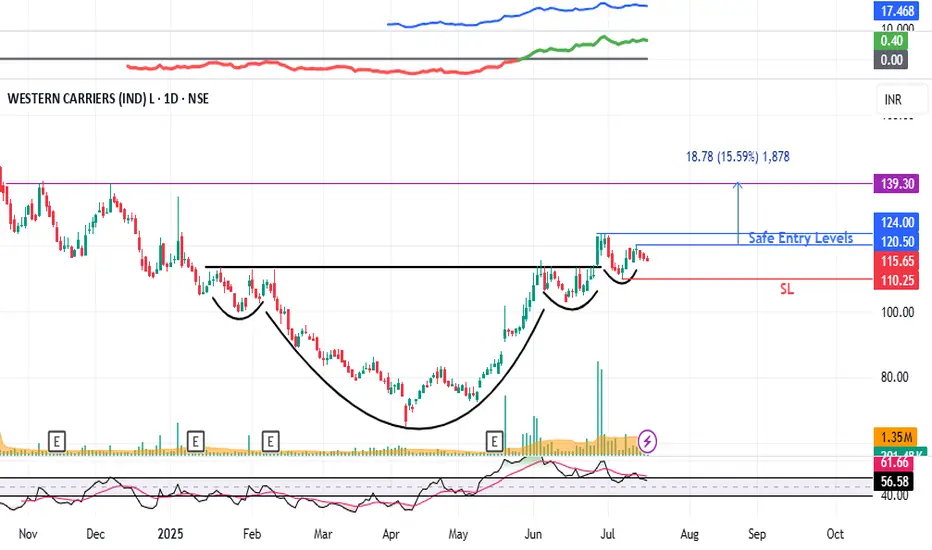
Western Carriers (WCIL) : Breakout Candidate#WCIL #patterntrading #breakout #breakoutstock #inverseheadandshoulder #swingtrading
WCIL : Swing Trade
>> Low PE Stock
>> Inverse Head & Shoulder pattern visible
>> Breakout & Retest Done
>> Ready for New Highs
>> Low Risk High Reward Trade
Swing Traders can lock profits at 10% & Keep Trailing
Pls Comment , Boost and Follow for more such Analysis
Disc : Charts shared are for Learning Purpose and not a Trade recommendation, Consult your Financial afvisor or a SEBI Registered Advisor before taking postion in it.
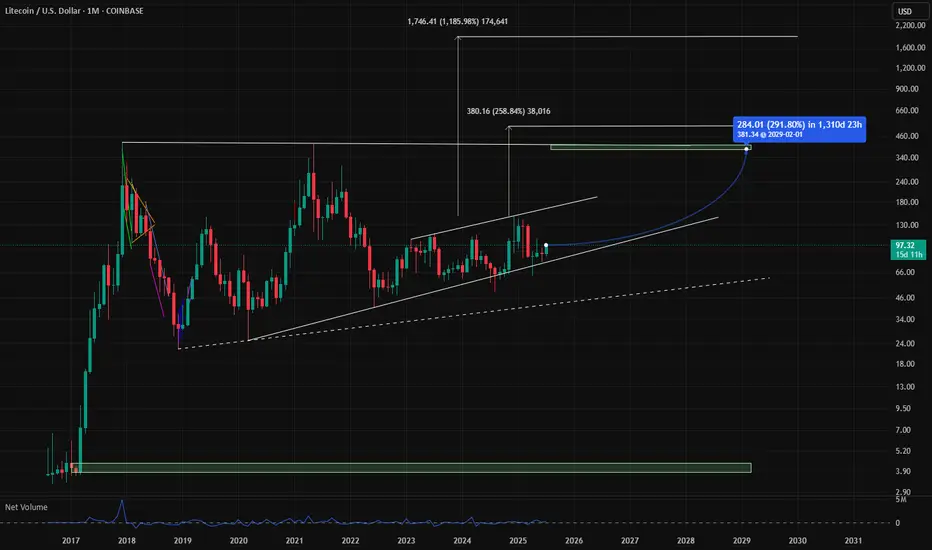
LTC Targets 400$ + 1900$ Litcoin LTC Targets for the next run are atm +290% is a realistic szenario. The addvanced targets at 1900$ are very impressiv but remember there are only 21 Mio. Coins too, like BTC because it is the fork and think about an alternative payment methode like btc, would be a reason for 1900$ pro LTC. So in Crypto is nothing unreal if you could imagine, but first of all approx. 400$ are a good direction. GM
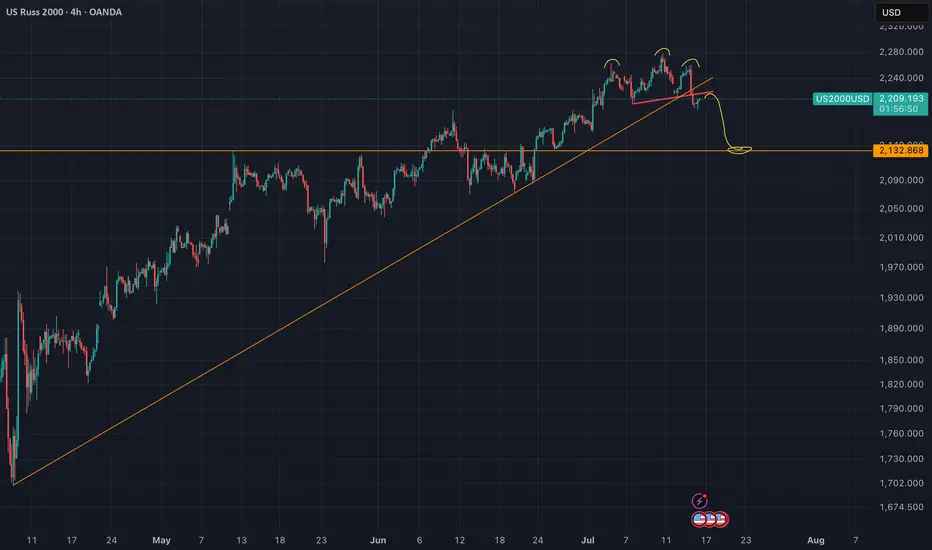
US2000 - Head And Shoulders (Top signal)Reversal in play. The neckline of the H&S got validated yesterday.
Nothing here should be interpreted as financial advise. Always do your own research and decisions.
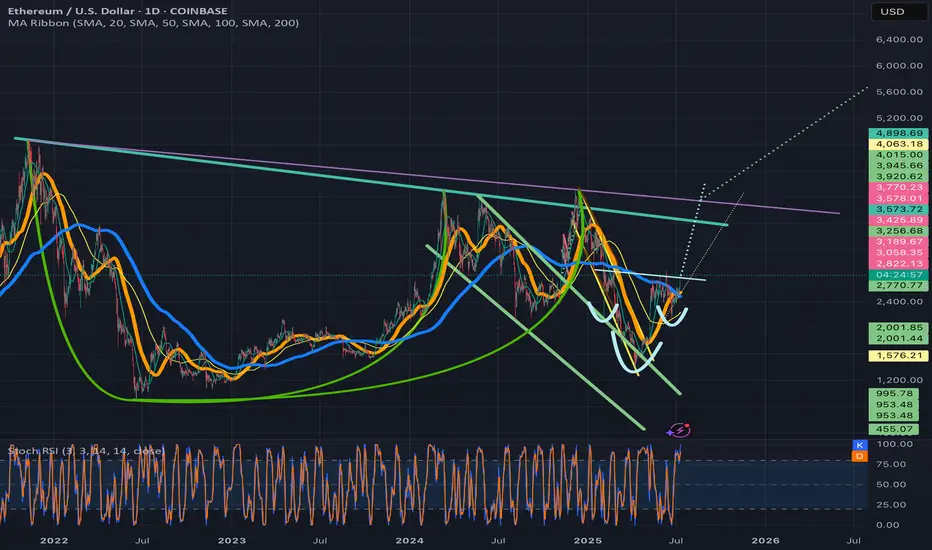
Ethusd breaking above invh&sEthusd chart has a similar set upas the total2 chart, a cup and handle that is breaking up from a smaller inverse head and shoulders that will complete the handle to the cup. Ethereum actually has two potential to trendlines for its cup and handle and I wouldn’t be surprised if both are valid. The breakout target for the inverse head and shoulder pattern will take price action above both of them. Once we solidify the top trendline for the cup and handle patterns as support the breakout target for it is $7161. Ethereum just recently had a golden cross on the daily which adds to the probability the inverse head and shoulder pattern breakout will be validated. *not financial advice*
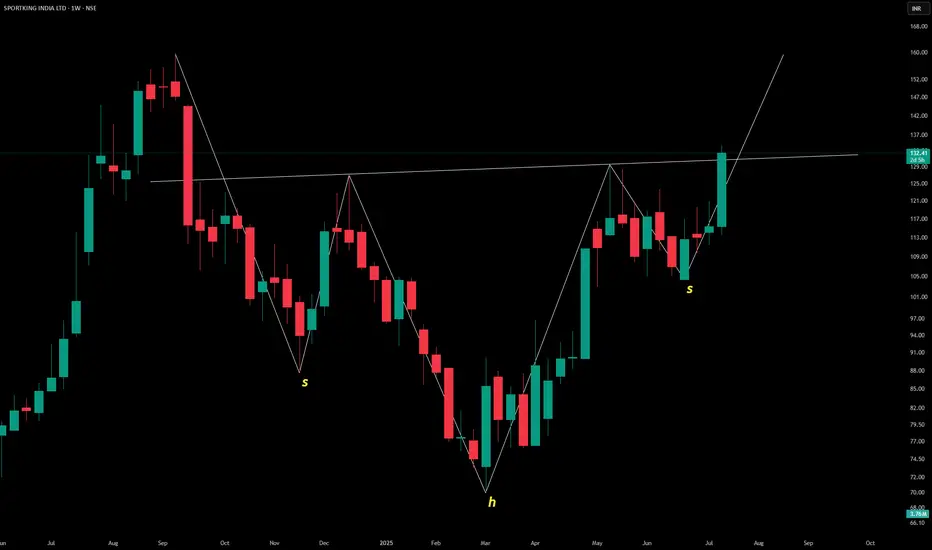
SPORTKING INDIA LTD – Inverted Head & Shoulders Pattern
The weekly chart shows a classic **inverted head and shoulders** formation:
- 👈 **Left Shoulder**: Shallow trough
- 🔽 **Head**: Deep central low
- 👉 **Right Shoulder**: Higher trough mirroring the left
Price action around ₹132.48 suggests a potential **bullish reversal**, indicating that the prior downtrend may be bottoming out. A breakout above the neckline would typically confirm upward momentum—worth watching for volume confirmation and resistance levels.
Let me know if you’d like projected targets or neckline levels next!
Last resort buy’s concept ?Trade Journal Entry – XAUUSD (Gold Spot)
Date: July 15, 2025
Platform: TradingView (Demo Account)
Timeframe: 4H
Direction: Long
Status: Active trade under review / possible re-entry
Key Levels
- Sell-side liquidity tapped: ~3,340–3,345
- Support zone (mitigation block): ~3,316–3,310
- Last resort buy area: ~3,283
Market Context
Clear Break of Market Structure (BMS) confirming bullish bias.
Price swept recent sell-side liquidity above 3,360, failed to hold, and sharply pulled back.
Price is now entering a mitigation zone, sitting above the major buy-side liquidity zone and last resort demand.
Multiple liquidity layers marked below current price — good confluence for a reaction if structure holds.
Trade Rationale
Scenario A: If price respects ~3,316–3,310 zone and forms bullish engulfing/reversal, consider re-entry.
Scenario B: If price breaks deeper into 3,283 zone with SFP (swing failure pattern) or V-reversal, it's a last-chance long from premium demand.
Trade Plan
Watch for bullish reversal candle or lower timeframe BOS (M15) inside 3,316–3,310 zone.
If entered, SL below 3,283. TP remains at prior high ~3,492.
Manage risk carefully — only one more key demand zone below.
Emotional Reflection
Felt confident on initial entry, but market invalidated short-term structure. Now reassessing calmly — waiting for re-entry confirmation without chasing.
Reflection Questions
- Did I exit early enough once price showed failure to hold above 3,360?
- Will I maintain composure and wait for structure confirmation in the new zone?
- Is my risk sized properly for this secondary attempt?
