XAUUSD NEXT WEEK PREDICTION IN 1-HHello Guys Here Is Chart Of XAUUSD in 1-H AT
Resistance: We set RESISTANCE around 3028/32
Target Will Be : 2990
If XAUUSD take resistance level, Then It went to go downward at previous Support zone 2985,
Head and Shoulders

REZUSDT // head and shoulders formationAlthough there is a reverse head and shoulders formation on the chart, the targets are drawn according to Fibonacci.Let's look for closures above the blue line.

C98USDT // reverse head and shoulders formationAlthough there is a reverse head and shoulders formation on the chart, the targets are drawn according to Fibonacci.

ETHUSD – Bullish Quasimodo + iH&S Breakout | Upside Targets!Ethereum (ETHUSD) has completed a textbook bullish Quasimodo pattern in confluence with an Inverse Head & Shoulders (iH&S) on the 15-minute timeframe. Price has broken out with strong bullish momentum, and the structure suggests more upside ahead.
📊 Technical Breakdown
1. Quasimodo Pattern
A well-defined Quasimodo reversal formed at the swing low, providing early signs of a bullish trend shift.
This pattern combines a higher low and reclaimed structure—offering an excellent base for trend continuation.
2. Inverse Head & Shoulders
Left Shoulder, Head, and Right Shoulder clearly structured with neckline breakout confirmed.
Breakout above neckline resulted in a 5.38% rally into minor resistance.
3. Bull Flag Formation
A short consolidation just below the recent highs resembles a bull flag, typically a continuation signal.
Breakout from the flag would trigger the next leg toward the final target.
🎯 Targets
Minimum Target: 2,121.41 — aligns with neckline projection.
Final Target: 2,229.90 — 6.27% projected move based on iH&S measured move.
📌 Trade Idea
Entry Zone: On bull flag breakout above 2,093
Stop Loss: Below 2,060 (flag low support)
TP1: 2,121
TP2: 2,229
🔎 Key Confluences
Pattern Breakouts ✅
Strong Momentum ✅
Clean Structure & Price Geometry ✅
ETH bulls have reclaimed short-term control. If momentum sustains, the upside targets are well within reach.

Gold (XAU/USD) Head & Shoulder Chart Pattern H4Gold (XAU/USD) Head & Shoulder Chart Pattern
**Bearish Breakdown Confirmation (📉 Downtrend Risk)**
- **Head & Shoulders Breakdown:** The price formed a **head and shoulders pattern**, signaling a potential reversal.
- **Sell Zone:** Price is trading below the **21 EMA ($3,027)** and **7 EMA ($3,028)**, confirming bearish pressure.
- **Support Test:** Price is approaching the **50 EMA ($3,000)**, which is a key level. A break below this could accelerate selling.
- **Bearish Confirmation:** If gold fails to reclaim the **$3,028-$3,030 zone**, further downside toward **$2,980-$2,960** is likely.
- **Entry Points:** A rejection from **$3,025-$3,030** is ideal for sellers, while a breakdown below **$3,000** confirms further weakness.
📌 **Conclusion:**
- **Below $3,030 = Bearish outlook toward $3,000 & $2,980**
- **Break below $3,000 = Strong downside toward $2,960**
- **Above $3,030 = Bulls regain control**
Trading Plan:
🔴 Sell near resistance ($3,025-$3,030) with a stop above $3,035.
🟢 Take profit at $3,000, then $2,980 if breakdown occurs.

Bearish Bias Under Head and Shoulders Formation📍Gold is currently leaning towards a bearish trend under the pressure of a well-defined head and shoulders pattern. Therefore, our primary trading approach remains focused on short positions.
📍In the short term, the key resistance to watch is in the 3030-3040 zone. However, it's worth noting that on Friday, gold quickly recovered most of its losses after testing the 3000 level, indicating the presence of strong buying interest and solid support below.
📍From a trading perspective, there is still an opportunity to capture profits from potential technical rebounds. The main support levels to monitor are:
📌3010-3000 as the initial support zone
📌2995 as the secondary support level
🔎Trade Idea:
1. Xauusd: Sell at 3035-3045
TP:3020-3010
SL:Adjust according to risk tolerance.
📎But if gold shows signs of holding support, a short-term rebound could provide opportunities for counter-trend trades.
2. Xauusd: Buy at 3015-3005
TP:3025-3035
SL:Adjust according to risk tolerance.
📩Trading means that everything has results and everything has feedback. I have been committed to market trading and trading strategy sharing, striving to improve the winning rate of trading and maximize profits. If you want to copy trading signals to make a profit, or master independent trading skills and thinking, you can follow the channel at the bottom of the article to copy trading strategies and signals

Gold has reached the TOP? Time to short Gold?Gold has reached the TOP? Time to short Gold?
Gold has been bullish for more than 28 months strike. It has also been topped the 3000 level.
When everybody rush for gold, I think we need to examine our position again.
If we look further on the lower timeframe, let's say H1; we can see vividly gold is creating the perfect Head and Shoulders pattern. I think, it's time to take a reverse position to start shorting the gold.

DOT in coming days ...The pattern has broken, and now I expect the price to rise to $5.3.
Give me some energy !!
✨We spend hours finding potential opportunities and writing useful ideas, we would be happy if you support us.
Best regards CobraVanguard.💚
_ _ _ _ __ _ _ _ _ _ _ _ _ _ _ _ _ _ _ _ _ _ _ _ _ _ _ _ _ _ _ _
✅Thank you, and for more ideas, hit ❤️Like❤️ and 🌟Follow🌟!
⚠️Things can change...
The markets are always changing and even with all these signals, the market changes tend to be strong and fast!!

ETH’s Secret Pattern Exposed! Why Is No One Talking About This ?Hello Traders 🐺
When I opened the ETH chart today and switched to the weekly timeframe, I saw something unbelievable with my own eyes! 🤯 That’s why I decided to share it with you, my friends. I truly believe there’s a very high chance for ETH to explode to a new ATH! Let’s break it down:
Why am I still bullish and not talking about anything bearish these days? 🤔
✅ The BTC.D Chart – The Most Important Factor
BTC.D is sitting at its most critical resistance level. Not just one, but two bearish divergences have already formed on the weekly chart, signaling a potential reversal. I will also update my last idea about BTC.D, so make sure to follow me for upcoming updates! 🔔🔥
Other Reasons to Stay Bullish on ETH & Altcoins 💎
📉 Weak hands are leaving the market
💰 Inflation is falling, which means we could see rate cuts very soon
🏦 Quantitative Tightening (QT) is ending soon
🇨🇳 China is printing money, and the FED will likely turn the printers back on
📍 ETH/BTC is sitting at a key monthly demand area
📊 Binance has increased its ETH holdings by over $600 million just this week!
These are the reasons why I remain extremely bullish on ETH and Altcoins. And now, let’s dive into the ETH chart—because that’s exactly why you’re here!
ETH’s Repeating Pattern – A Bullish Setup! 🔄🔥
As you can see on the chart, ETH has a history of repeating the same pattern over and over again. 🌀 Back in 2020-2021, before the massive ETH & Altcoin rally, we saw a huge weak hands shakeout. Just before the shakeout, everyone thought ETH had formed a double bottom and was ready to fly—but then BOOM! 💥 A huge shakeout happened, followed by a rally to new all-time highs. 🚀
Now, the same pattern is unfolding again! We have an Inverse Head & Shoulders, which is a bullish pattern. Then, we saw a massive shakeout just below the previous low, causing a bullish divergence on RSI—and now, things are starting to change! 🔥📈
✅ Make sure to act accordingly, my friends!
🐺 KIU_COIN 🐺

Golden Signal: Go Short in the 3027-3037 AreaLast Friday, gold rebounded to near resistance. Although the indicator in the 30M level chart shows that there is still some rebound momentum, the space is not very large, because the head and shoulders pattern has appeared in the early stage, and the pressure on the bulls is still very large.
Therefore, in the intraday trading on Monday, we can focus on short trading around the resistance area of 3027-3040. The single needle bottoming provides good support, so TP does not need to be set too large for the time being. The previous rising point of 3007 is used as a reference support, and TP is controlled in the range of $10-$16. Personally, it is expected to be in the 3018-3011 area.
I will update the specific trading information during the intraday, please pay attention to the content of the intraday update. If you have any questions, you can leave me a message, and I will reply to you in time when I see it.
I wish you all a prosperous new week!

XRPUSDT Consolidating at ATHi see the consolidation as very young and it may need both : time and volume to gather serious weight in order to register new all time highs . I see a rare fractalized repetition of H&S patters on the lower timeframes which is up to end a toping pattern in the following days thus granting short term opportunities for shorting with significant R/R ratios

Potenial inverse head and shoulders pattern for Bitcoin This is the scenario I’m believing in for the near term for BINANCE:BTCUSD .
One more leg down to confirm the neckline around 78,300 USD.
Quick reversal price action to retest the 92,300 USD (ish) level.
If the breakout takes place to the upside, then I think we will retest the previous highs, with a higher probability of going much higher. Although I believe the tariffs will have a big impact on the USD (DXY index), which I believe will have a strong effect on BTC for the near term, around the coming 6 months. So, I believe the new high will most likely come in Q4 this year, making this cycle different from the historic crypto cycles. Although, there is still a chance that other countries will start to adopt more crypto-friendly policies for crypto or Bitcoin, making this thesis more uncertain. If the policies come out as positive, then I think there are good chances of reaching new highs earlier than Q4, 2025.

Tesler LT estimationA quick guess at Tesler at the long run, if reality continues against corporate and political manipulation of the stock.

XRP decision time !Hello Traders 🐺
In this idea, I want to talk about XRP, because in my opinion, the price is currently sitting at a critical decision-making area—and any moment could lead to a major move. So let’s take a look at the possible scenarios: 👇🔥
🟢 Bullish vs. Bearish – What’s Next?
First of all, we’re still in an uptrend, and as the saying goes: "The trend is your friend until the end." 📈 However, the current pattern forming on the chart—if it plays out—could mark the end of this uptrend, at least in the short term. 😬
On the flip side, there’s also a bullish scenario at play: a potential bull flag pattern. I’ve drawn it on the chart using the orange resistance line. If the price can break above this resistance, we could expect much higher targets—and I’ll definitely update you on those in my next posts. So make sure to follow me and don’t miss the train! 🚂🚀
and also remember :
🐺 Discipline is rarely enjoyable, but almost always profitable. 🐺

The Bear Awakens: A Perfectly Executed Short on Gold📍Over the past few days, I’ve consistently emphasized that the bear is on the verge of fully awakening, warmly inviting everyone to watch it dance. Today, gold has indeed pulled back to the 3000 level as anticipated, making our short position from the 3035-3045 range a resounding success!
📍Since gold has tested the 3000 level for the first time, a second test is highly likely. Therefore, the primary trading strategy remains focused on selling gold on rebounds. The head-and-shoulders formation continues to exert significant pressure, making a sustained breakout to the upside unlikely in the near term.
📍With this in mind, the resistance zone can be adjusted lower to 3025-3035. If gold fails to break through this region during its rebound, further downside movement is expected. In that case, gold will likely retest the 3000 level and could potentially breach it, extending losses towards the 2995-2985 range.
🔎Trade Idea:
Xauusd: Sell at 3025-3035
TP:3005-2995
SL:Adjust according to risk tolerance.
📩Trading means that everything has results and everything has feedback. I have been committed to market trading and trading strategy sharing, striving to improve the winning rate of trading and maximize profits. If you want to copy trading signals to make a profit, or master independent trading skills and thinking, you can follow the channel at the bottom of the article to copy trading strategies and signals

GOLD (XAUUSD): Selling Now is HIGH RISK
The head & shoulders pattern that I spotted earlier
perfectly played out and we saw a strong bearish move after the
NY session opening.
HOWEVER, be extremely careful.
Many traders started to sell heavily, anticipating an extended bearish reversal.
For now the price nicely respected 3000 psychological support
that previously was a resistance.
I suggest not placing any short trades this week.
Let's wait till Monday and how the market opens.
❤️Please, support my work with like, thank you!❤️
I am part of Trade Nation's Influencer program and receive a monthly fee for using their TradingView charts in my analysis.
Reliance Ind, IHNS Formation on Daily TFafter a down trend Reversal Pattern Found Let`s What Happen In coming Days

The bearish trend will continue📍Since the day before yesterday, I've been sincerely inviting everyone to watch the bear dance.Gold has decisively broken below the recent support zone at 3030-3026 and extended its decline to around 3021. Based on this price action, two key conclusions can be drawn:
1. 3057 is now confirmed as the current high.
2. Gold has successfully formed a head and shoulders pattern in the short term.
📍This indicates that bearish momentum remains strong and far from exhausted. Under the pressure of structural resistance, gold is likely to continue testing lower support levels around 3010-3000, with a possible extension toward 2995.
🔎Trade Idea:
Xauusd: Sell at 3035-3045
TP:3015-3005
SL:Adjust according to risk tolerance.
📩Trading means that everything has results and everything has feedback. I have been committed to market trading and trading strategy sharing, striving to improve the winning rate of trading and maximize profits. If you want to copy trading signals to make a profit, or master independent trading skills and thinking, you can follow the channel at the bottom of the article to copy trading strategies and signals

Gold Perfect Candidate to ShortGold is moving in pattern forming head and should pattern at the top, This is perfect candidate to short

Gold is ready for retracementAs we can witness the current resistance and ATH stands at 3057.
yesterday gold did a strong pullback to the CMP support 3025 however fail to break above ATH support that currently becomes resistance for the current market price today.
I won't be trading at the current support area as in H1 full HNS has formed in this CMP which showing signs of a strong pullback to certain location that gold left a gap for the current bull run to cover it up potentially. only if it broke from current ranging then to decide on the trade with more clarity for gold towards its directions
In the bigger Timeframe for Weekly is still an uptrend. The bias is still buy at certain zones such as 3012-15 which a hidden H1 swap zone of H4 breakout this zone potential a good 80-100pip rejections area. need to monitor thou for this trade as it'll rate as still high risk.
next good zone with higher chance to win is 2998-3002, why, it took gold several touches in H1 and H4 to be able to finally break that resistance before it able to climb to the current ATH. target to win here atleast 100-150 pips. This trade would be rating as medium risk trade.
one more of most gold favourite area to sweep buyers is Daily swap zone which usually can contribute to a homerun trade of swing 1-3 days for a good 300-500pips standing in the area of 2984-2989.This trade would be rating as low risk trade
Last is the no Brainer trade when gold arrive to the location of previous ATH in weekly of 2956-54 area. This even a yolo trader can win atleast 200pips should provide a good rejections however usually it'll go deeper to chase those SL or margin call accounts and usualy can happen on great news week. will not happen today but if does its a sin not to take a trade there.

Nifty Media Index – Strong Reversal from Support! The Nifty Media Index has shown a strong bounce from a crucial support zone, gaining +10.83% in recent sessions. This move indicates a potential trend reversal!
📊 Key Observations:
✅ Support Retest Successful: The index held above the key 1,450-1,500 zone and bounced.
✅ Breakout Confirmation: Price is attempting to sustain above this level, signaling further upside potential.
✅ Next Resistance: The 1,650-1,700 zone could act as the next target.
⚠️ Trading Plan:
A sustained close above 1,550 could trigger further upside.
If the breakout sustains, 1,650-1,700 could be the next target.
Support at 1,450 should hold for a bullish continuation.

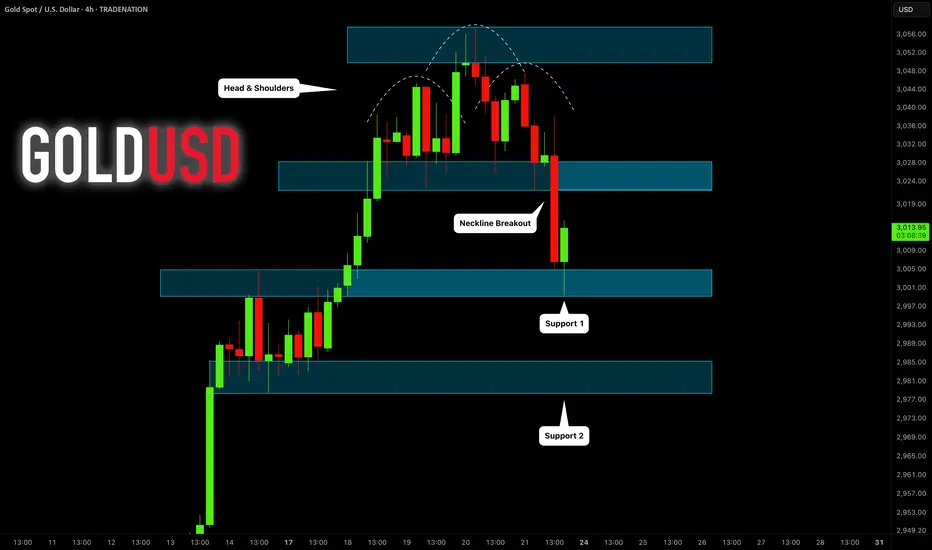
GOLD (XAUUSD): Correctional Movement Ahead?After experiencing a strong uptrend, ⚠️Gold appears to be overbought.
By analyzing the 4H chart, we can see a complete head and shoulders pattern.
A bearish trend will be confirmed if the price breaks below the horizontal neckline.
If a 4-hour candle closes below 3022, we can anticipate a significant pullback to around 3000.

WPP Stock Quote | Chart & Forecast SummaryKey Indicators On Trade Set Up In General
1. Push Set Up
2. Range Set up
3. Break & Retest Set Up
Notes On Session
# WPP Stock Quote
- Double Formation
* Retracement & Inverted Pattern | Completed Survey
* ABC Wave Feature | Reversal Entry | Subdivision 1
- Triple Formation
* (Target Entry Or Gap Fill)) | Subdivision 2
* (TP1) | Subdivision 3
* Daily Time Frame | Trend Settings Condition
- (Hypothesis On Entry Bias)) | Indexed To 100
- Position On A 1.5RR
* Stop Loss At 80.00 GBP
* Entry At 75.00 GBP
* Take Profit At 65.00 GBP
* (Downtrend Argument)) & Pattern Confirmation
* Ongoing Entry & (Neutral Area))
Active Sessions On Relevant Range & Elemented Probabilities;
European-Session(Upwards) - East Coast-Session(Downwards) - Asian-Session(Ranging)
Conclusion | Trade Plan Execution & Risk Management On Demand;
Overall Consensus | Sell
