XAUUSD HEAD AND SHOULDER CHAAT PATTERN BEARISH ⏱ 4H Timeframe | Bearish Bias | Precision Setup
💡 Pattern Formed: Head & Shoulders
🔻 Market rejecting at right shoulder zone with bearish confirmation
---
🔽 Entry Level (Sell):
🟤 3,360 – 3,365 (Right shoulder rejection zone / supply area)
🛑 Stop-Loss (SL):
🔴 3,390 (Above the right shoulder + structure invalidation)
🎯 Take-Profit (TP):
🟢 3,210 – 3,200 (Measured move target + POI support zone)
📊 Risk:Reward Ratio:
✅ Approx. 1:4 — High probability setup
Head and Shoulders

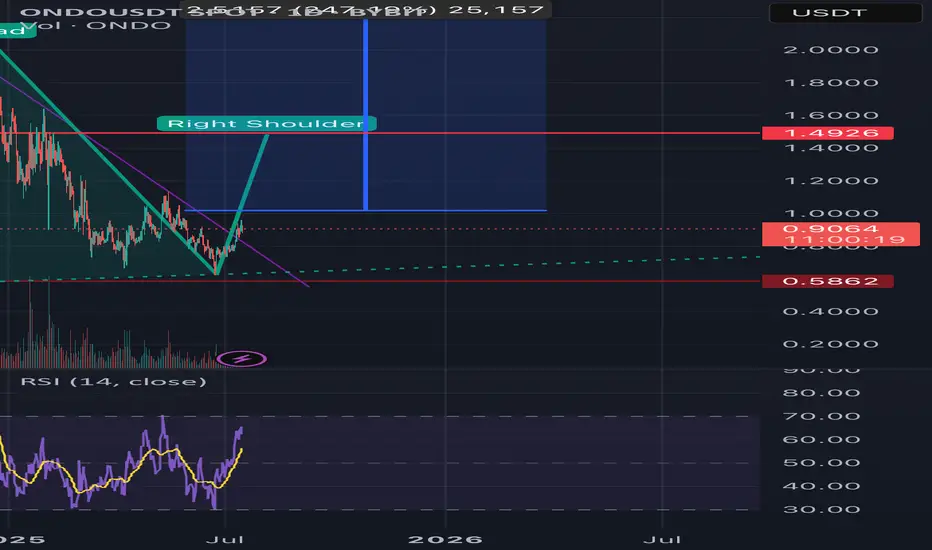
OndoBullish Reversal in Play – ONDO/USDT Weekly Chart
A clear Inverse Head and Shoulders pattern is forming on the weekly timeframe.
Price is currently breaking out of the neckline with strong momentum.
🔹 Left Shoulder: Formed with consistent volume support
🔹 Head: Deep correction followed by strong recovery
🔹 Right Shoulder: Higher low formation with bullish pressure
📈 Potential Target: $2.51 (+247%)
🛡️ Support Zone: ~$0.58
If this breakout confirms with weekly close above the neckline (~$0.90–$1.00),
we could be seeing the start of a major bull wave.
#ONDO #CryptoAnalysis #InverseHeadAndShoulders #Altseason #Breakout
End of trend with Head & Shoulders forming. On the monthly chart the pair has been ranging between 1.2 and 1.43 since 2016 with resistance established 2018. Currently on up leg of third cycle. Ignoring the Liz Truss blip.
Daily chart uptrend established Jan 25 and should continue up to resistance. However possible head & shoulders forming, which would indicate change of character, at most recent cycle but a good trade up to right shoulder still possible and then it will change to down trend to trend line
4H - Price at good quality demand with 4 basing candles. Ready for reversal and long to potential right shoulder at 1.355 or higher all the way to multiyear resistance.
COT Non-com and retail are increasing positions and commercials are reducing. Valuation is cheap.
Plan: waiting for US CPI data and confirmation of direction change and then long with stop at 1.33570 and TP at 1.355 to right shoulder. (I like these as worst that can happen, after up move is confirmed, is H&S doesnt form and it continues to upside increasing R:R). Followed by good short.
Let me know what you think

ANANT RAJ – Breakout From Rounded Base | ₹700+ Swing PossibleANANT RAJ has triggered a fresh breakout above the ₹580 zone – reclaiming its prior breakdown level from Feb 2025. This comes after a rounded base formation lasting 4+ months.
Breakout 1: June 2, on volume, cleared the March–May base
Breakout 2: Now taking out neckline of broader inverse H&S
Volume: Expanding again
RSI: Bullish, no divergence
Structure: Clean higher highs and lows post-Feb low
Measured Move Target: ₹700
Stop-Loss: ₹558
Fundamentals Support Swing Bias:
Low debt, strong solvency
Net profit margin ~21%
FY26 profit growth estimate ~32%
Valuation expensive (P/E ~46), but growth supports it short term
Not a long-term compounding candidate yet – monitor execution
Positioning:
Swing trade, not an investment. Ride momentum. Trail stops. No averaging up. Exit if ₹558 breaks on closing basis.
Disclaimer:
This analysis is for educational purposes only. It is not investment advice. Do your own due diligence. Trade at your own risk.

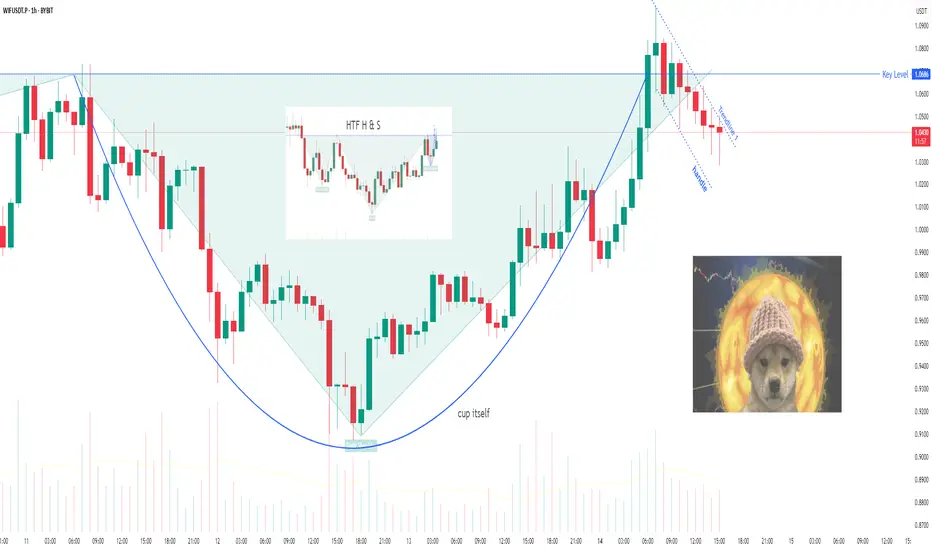
WIF/USDT: Dog back on track?WIF is building a "Cup And Handle" pattern alongside a (hopefully) last trendline, Trendline 1.
That breakout would lead back to the main keylevel, which is also the neckline of a H&S formation on a higher timeframe. To make it even more funny, that H&S is "the handle" of a even bigger cup n handle pattern on the next HTF.
So the break of trendline 1 might bring us to the keylevel, and that might start the H&S being "priced".
NZDUSD Pullback in Play – Head & Shoulders Signals More DownsideNZDUSD ( OANDA:NZDUSD ) is currently trading near the Resistance zone($0.612-$0.605) and has also managed to break the Support zone($0.604-$0.602) . We consider the Support zone as the neckline of the Head and Shoulders Pattern .
In terms of classic technical analysis , NZDUSD has managed to form a Head and Shoulders Pattern .
I expect NZDUSD to decline towards the Support zone($0.5968-$0.5946) after completing the pullback .
Note: Stop Loss(SL): $0.6062
Please respect each other's ideas and express them politely if you agree or disagree.
New Zealand Dollar/ U.S. Dollar Analyze (NZDUSD), 1-hour time frame.
Be sure to follow the updated ideas.
Do not forget to put a Stop loss for your positions (For every position you want to open).
Please follow your strategy and updates; this is just my Idea, and I will gladly see your ideas in this post.
Please do not forget the ✅' like '✅ button 🙏😊 & Share it with your friends; thanks, and Trade safe.

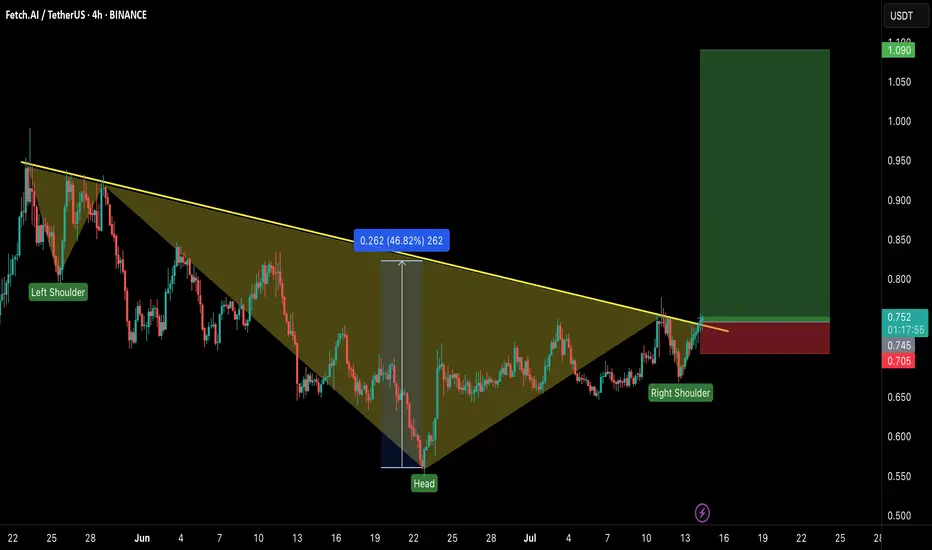
FET/USDT – Head & Shoulders Breakout!Hey Traders — if you're into high-conviction setups with real momentum, this one’s for you.
ONDO is trading inside a falling wedge on the daily chart — a classic bullish structure that often leads to explosive breakouts. 📈
FET just broke out of a classic inverse head & shoulders pattern — a strong bullish reversal structure! The breakout looks clean with a confirmed close above the neckline and volume starting to pick up.
💼 Entry: CMP ($0.75)
🎯 Targets: $0.85 / $0.95 / $1.09
🛑 Stop-loss: $0.705
📈 Risk-Reward: Favorable
🧠 Why it matters:
Clean breakout above resistance
Strong trend reversal structure
Potential for 40%+ move ahead.
💬 Are you in this breakout play or watching from the sidelines? Let’s talk below!
👉 Smash that LIKE and FOLLOW for more real-time setups!
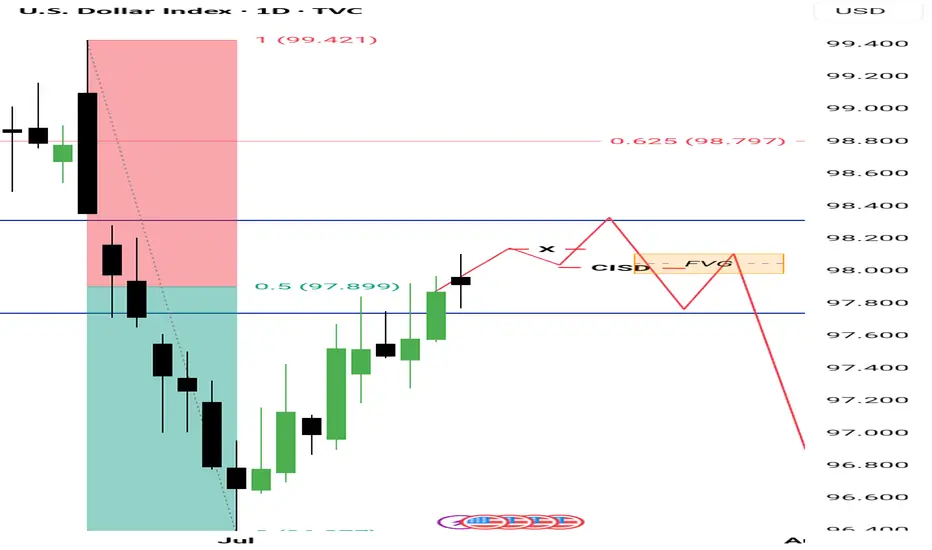
POSSIBLE PLAY FOR THE WEEKHTF KEY LEVEL
1. Premium gap/volume imbalance (DAILY TF)
2. monthly inverted fvg premium marked in Blue lines
I'd be watching the hourly time frame to get a setup as marked in red to engage for the week.
NOTE: CPI Tuesday
Bitcoin Hits First Target: What I Traded and What Comes NextBitcoin just hit my first target. I went long on BTC, XRP, Chainlink, and more. Booked profits and jumped into two new breakouts with better risk-reward. In this video, I break down my trades, the setup, and why I’m still bullish between 116K and 120K. I also explain how crypto deregulation and the Genius Act could fuel the next move.
Let me know in the comments how you traded this breakout.
This content is not directed to residents of the EU or UK. Any opinions, news, research, analyses, prices or other information contained on this website is provided as general market commentary and does not constitute investment advice. ThinkMarkets will not accept liability for any loss or damage including, without limitation, to any loss of profit which may arise directly or indirectly from use of or reliance on such information.

Ascending Inverse H&S on the BTC weekly chartThe longer it takes to break above this neckline the higher the breakout target will be. I have arbitrarily placed the measured move line at July 18th 2025. If the breakout were to happen on that day the measured move target is around 208k, which could take quite awhile to reach or if we entered a truly hyperparabolic blow off top we could reach such a target way quicker than when the dotted measured move line reaches it. *not financial advice*


Crypto 2021-22 Rerun?Crypto ex-BTC looks like an identical setup with high, divergent higher high, dead cat bounce, with the same level of resistance in play (both double top and 'right shoulders')
Shitcoins and crypto are much less popular among retail this time around, which has me thinking a FOMO surge to new highs is off the table this time.
I think there's a short setup here, but posting before a break confirmation has occurred anyway (so technically still neutral today). I dont trade crypto, but follow the trends and this just stood out to me enough to share.

Crypto in July 2025: A Financial Reset from Macromics GroupThe world of cryptocurrencies in July 2025 is experiencing more than just another growth cycle — it’s undergoing a fundamental transformation of the global financial system. Amid geopolitical instability, tighter control over digital assets, and growing interest from institutional investors, digital currencies are once again in the spotlight. Macromics Group shares its latest analytical insights on the key events and trends.
A New Bull Run: Ethereum 3.0 and Bitcoin Network Upgrade
Since the start of summer 2025, Ethereum has shown strong growth, largely due to the launch of Ethereum 3.0, which reduced transaction fees and made the network more scalable. Bitcoin, in turn, has undergone another major security upgrade, attracting new institutional investors, including funds from Japan and Saudi Arabia.
CBDCs and Regulation: Governments Shift Approach
Central banks are actively rolling out central bank digital currencies (CBDCs). China, India, Brazil, and the EU have expanded pilot programs for their national digital currencies. This has led to increased interest in stablecoins backed by fiat currencies and greater demands for transparency on DeFi platforms.
Macromics Group helps clients navigate these new dynamics, offering up-to-date analytical resources and capital protection strategies across both regulated and unregulated sectors of the crypto market.
NFTs Make a Comeback — In the Corporate World
A new wave of interest in NFTs is emerging, not from artists, but from the corporate sector. Companies are using tokens for intellectual property, document verification, and digital rights management. Macromics Group is investing in startups building infrastructure for business-focused NFTs — a clear sign of the technology’s long-term potential.
AI + Blockchain: A Union of Future Technologies
In 2025, two mega-trends are converging: artificial intelligence and blockchain. AI-powered protocols are automating trading, cybersecurity, and even smart contract audits. Macromics Group is already implementing these technologies into its analytical tools and services.
What’s Next? Macromics Group Forecast
According to our data, the crypto market has entered a phase of "conscious growth" — where technology, regulation, and real-world utility are evolving in harmony. In the coming months, we anticipate increased attention toward:
DePIN projects (decentralized physical infrastructure)
Tokenized real-world assets (real estate, gold)
ESG-focused cryptocurrencies
Conclusion: Don’t Just Invest — Understand
Macromics Group urges investors to go beyond participation — to become informed decision-makers. We provide deep analytics, access to unique tools, and expert support at every stage of crypto investing. July 2025 is the perfect time to rethink your strategy and take a step into the future.
Macromics Group — your expert in the world of digital assets.

Algorand breaking up from inverse head and shouldersSeems like most of the cryptos from the iso20022 compliant chains are breaking out right now and algorand is no exception. Most likely in anticipation of Fednow’s migration to it tomorrow. *not financial advice*

usdjpy head and shoulder emergingexperimental !!! it can be a possible scenario , pls feel free to coment and share your ideas with me hop you have green portfolio!!!

XLMUSD inv h&s at the threshold of the necklineNo confirmation yet but market currently feeling very bullish here. Likely to breach this neckline in the next few candles. *not financial advice*

A linear Chart version of the current HBAR bull patternsIt just dawned on me that I had my chart on logarithmic for the previous 2 posts I amde about HBARUSD. As usual, the chart patterns on the log chart tend to have much higher breakout targets than the version of the chart patterns that appear on the linear chart. As soon as I realized this I went back in and adjusted the patterns to their linear chart erosions. The inverse head and shoulders remained mostly the same but the bullflag/desceding channel has now morphed into a falling wedge/bullish pennant. As you can see the breakout target for all 3 patterns is a much lower price than what the price targets were on the logarithmic chart. That’s not to say that the logarithmic targets are invalid, I think what will most likely occur Ike usually is both chart’s targets will be validated, it will likely just take much longer for the logarithmic chart’s targets to be reached as is how things usually pan out. *not financial advice*
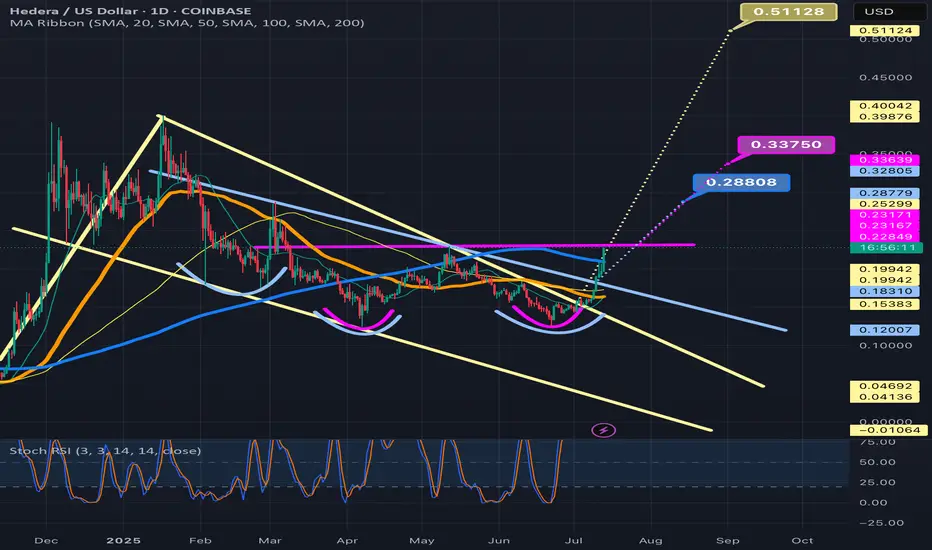
Weekly timeframe version of previous HBARUSD postWanted to show my previous hbar idea which was on the daily time frame on the weekly as well so I could fit the pole of the bullflag in the frame here. I will put a link below to my daily time frame version of this post which goes into slight more detail about each pattern and also the Nvidia hbar news. *not financial advice*

HBARUSD has 3 bullish patterns stacked on top of eachotherThe inverse head and shoulders in the light blue, the light tan is the bull flag, and the pink is the double bottom. Currently price is above the Bullflag and the Inverse head and shoulders pattern. The bullflag also counts as a descending channel pattern as well. We just recently retested the neckline of the inverse head and shoulders as exact wick support which is a good sign. All 3 should provide eachother with the bullish confluence needed for them to be validated, but in addition to this technical bullishness we have some fundamental bullishness occurring just recently too as NVIDIA just announced their new Blackwell chips — claiming them to be the future backbone of AI infrastructure — which are integrating verifiable compute which has its fundamental trust layer built on Hedera. This also provides great bullish confluence and heightens the probability these 3 chart patterns will all be validated and reach their full targets. I will keep updating this post as they do so. *not financial advice*

GBP/JPY Low Risk BUYS - SWINGLOW RISK TRADE
If you prefer not to swing you can scalp buys on the pullbacks throughout the week ahead.
GBP/JPY - BULLISH ENGULFING CONFIRMED
A+ SETUP since it has touched
and respected our area of interest.
SL - 185.599
TP1 - 190
TP2 - 192.799
TP3 - 194.681

EURAUD Weekly Trade Setup(14 to 18th July 2025) - Head&ShoulderThis week, EURAUD (Euro/Australian Dollar) has entered a critical price zone, providing a textbook technical opportunity for traders. A clear Head & Shoulders pattern has formed on the 4-hour chart, pointing toward a potential trend reversal from bullish to bearish.
Let’s explore how to trade this intelligently from both bullish and bearish perspectives.
1. Bearish Setup – Head & Shoulders Pattern Breakdown
This is the primary trade idea for the week.
✅ Trade Logic:
Price has completed a classic Left Shoulder → Head → Right Shoulder formation.
The neckline (support) will be tested.
The current price is will pulling back to retest the right shoulder resistance zone, offering an ideal short opportunity.
🔻 Entry Plan:
Wait for bearish reversal confirmation (candlestick rejection or bearish engulfing) on the 1H or 4H timeframe.
Enter short once confirmation appears near 1.7850–1.7900.
📉 Stop Loss:
Place SL above the right shoulder high, adjusting for volatility and swing high (around 1.7950).
🎯 Targets:
Target zone: 1.7450–1.7500 (profit booking zone marked on the chart)
Potential Risk/Reward Ratio: 1:2, 1:3, or even 1:4+
2. Alternative Bullish Setup – Reversal at Neckline (High Risk)
This setup is for experienced or aggressive traders who spot early reversals.
✅ Trade Logic:
Price may bounce from the neckline and 200 EMA support area.
If this happens, a temporary bullish reversal may push price back toward the right shoulder zone.
🔺 Entry Plan:
Wait for bullish confirmation (reversal candle) near the neckline and EMA support (around 1.7700).
🚨 Stop Loss:
SL must be below the neckline swing low (around 1.7650).
🎯 Targets:
Resistance zone (right shoulder): 1.7850–1.7900
R:R setups of 1:2 or 1:3 possible
⚠️ This is considered a counter-trend trade and should be traded with caution.
3. Technical Confluence and Indicators
Pattern: Head & Shoulders (bearish reversal)
EMA 200: Price reacting around the long-term trend line
Support/Resistance: Cleanly defined horizontal zones
Reversal zones: Highlighted in red (supply) and green (demand)
4. Final Thoughts
This week’s EURAUD setup is a strong example of structure-based trading. With a well-formed head and shoulders pattern and a clean neckline break, the market signals a shift in momentum.
Safe Approach: Trade the short side after resistance rejection.
Risky Approach: Try a long on neckline bounce with tight SL.
Always confirm with your system and maintain strict risk management. Trade what you see, not what you feel.
Ready to trade? Save this setup, monitor price action, and execute only with confirmation.
=================================================================
Disclosure: I am part of Trade Nation's Influencer program and receive a monthly fee for using their TradingView charts in my analysis.
=================================================================

NEAR Breakout Confirmed—But Is This Just a Bull Trap?Yello Paradisers! Did you see that breakout on #NEARUSDT? After weeks of consistent lower highs and a clearly defined descending resistance, price action has finally snapped that bearish structure and completed a textbook inverse Head and Shoulders formation on the 12H chart. This kind of pattern doesn’t appear often at key cycle points, and when it does—especially with confirmation—it becomes a high-probability signal of a trend reversal.
💎#NEARUSDT ,The neckline of the inverse H&S, sitting around the $2.17–$2.23 zone, has now been broken and crucially retested as support. This means the former resistance is now acting as a probable base for bulls, and if price remains above this area, the market is likely preparing for a strong probable impulsive move to the upside.
💎The structure shows clear bullish intent, and from a technical perspective, the first resistance comes in at $2.72. A clean break above that could open the door toward the major resistance zone between $2.97 and $3.05, which would complete the projected breakout target of the H&S pattern.
💎If bulls manage to maintain control above the $2.17–$2.23 support zone, we expect price to slowly build momentum toward $2.72, with increased volatility likely once that level is tested. Should that break occur with volume, the next leg may extend rapidly into the major resistance zone. However, if price fails to hold above this flipped support zone, we will be closely watching the $2.02–$1.89 area as the last major support before invalidation.
💎A daily candle closing below $1.798 would invalidate this entire bullish thesis and put the market back into a neutral-to-bearish range.
💎Adding more probability to this setup, NEAR is now trading above multi-timeframe EMA on higher time frame. This multi-timeframe EMA alignment supports bullish continuation, as momentum begins to shift in favor of buyers. However, continuation depends heavily on how price reacts at each resistance level—especially as we enter the mid-$2.70s.
💎The probable move from here is bullish, with the expectation that NEAR pushes toward the $2.72 level in the short term, followed by a potential rally to $2.97–$3.05 if momentum sustains. This scenario remains valid as long as price holds above $2.17, and especially above $2.02. Below that, the structure weakens. Below $1.798, the bullish bias becomes fully invalidated.
This is the only way you will make it far in your crypto trading journey. Stay sharp and patient, Paradisers. It’s not about chasing pumps—it’s about positioning smartly before the crowd.
MyCryptoParadise
iFeel the success🌴

MBLUSDT //As long as we stay on the green line, the direction is up. The first target is 0.002530, which is Fibo 1.414, the main target is 0.002736. Cut losses when closing below the green line.
