Inverse Head and Shoulders Already Completed Toward a New ATHThe price has completed the formation of an inverse head and shoulders pattern, with the final breakout occurring last week.
Volume confirms the validity of the pattern.
The distance from the head to the neckline projects a target toward a new all-time high (ATH).
As often happens after a breakout, a retest of the neckline may occur, which could present a good entry or accumulation opportunity
Head and Shoulders

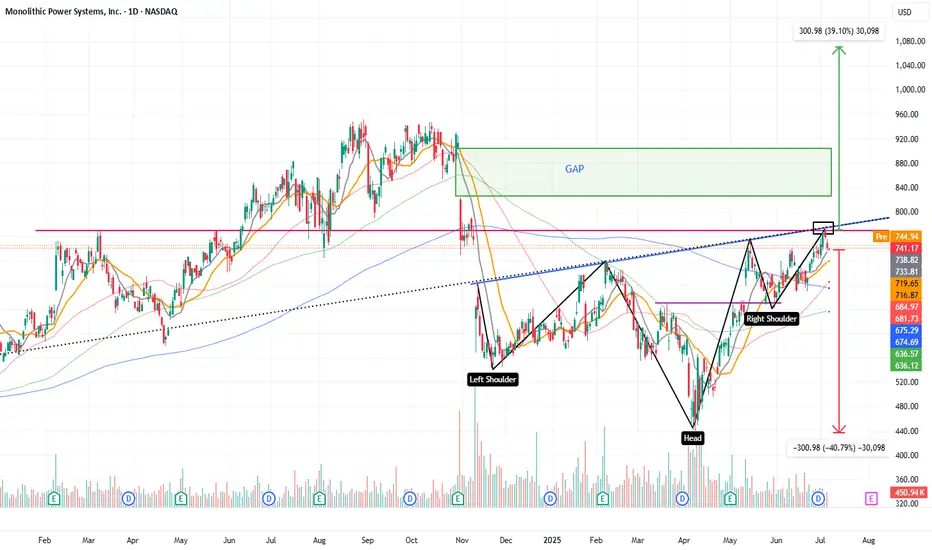
Inverse head and shoulders with a gap to close towards 1070$The price is completing the formation of an inverse head and shoulders pattern, with a head-to-neckline distance of approximately $300.
This suggests a potential breakout target around $1070.
Along the way, there is also a significant gap that has remained unfilled for several months.
The stock belongs to a company that manufactures power management chips used in all types of electronic devices, with steadily growing revenue
XAUUSD (LONG)
Inverse head and shoulders
Restest of tredline(previous was resistance now support)
Eliiots wave count (ABC done,1-5 in progress)

GBPCAD: Classic Pullback Trade for TodayThe GBPCAD pair formed a head and shoulders pattern at a crucial daily/intraday horizontal support level.
The recent breach of its neckline indicates a notable strength of buyers, suggesting a bullish momentum.
Given this technical setup, I anticipate that the pair could rally and potentially reach the 1.8650 level in the near term.

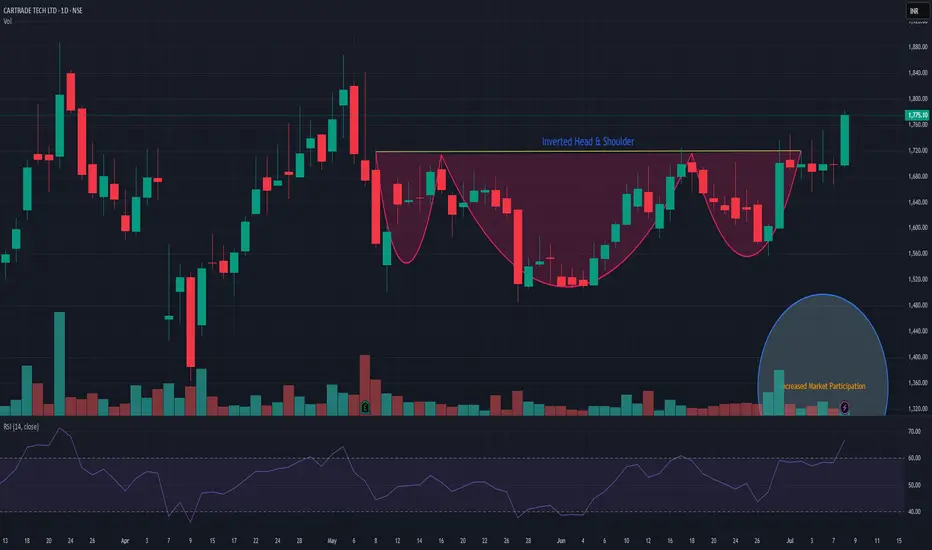
CARTRADECARTRADe is showing strength and has given Inverted head & Shoulder breakout with decent market participation. support is near 1620. It has a potential to go up! Keep it on radar. Closing below 1620 may change my view.
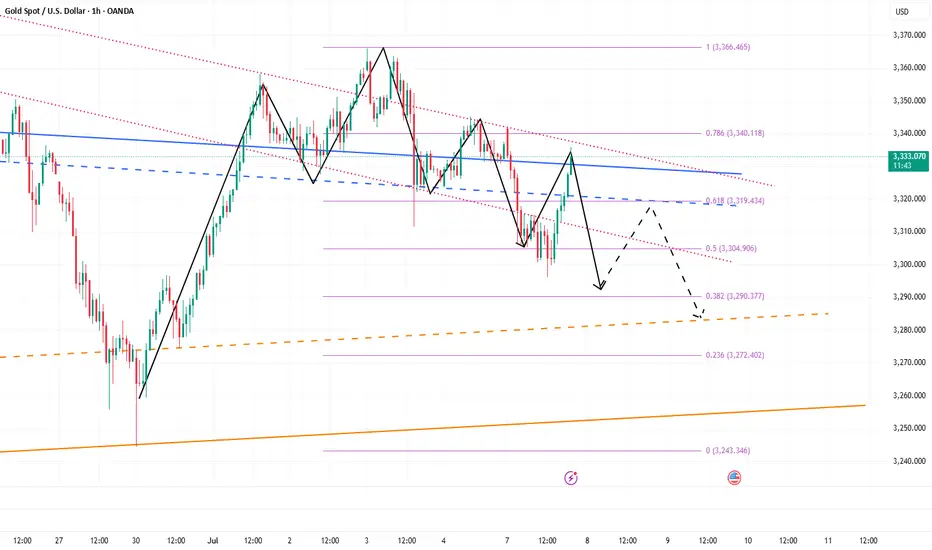
The short position is losing money. What should we do?Gold hit the intraday low of around 3296 and then began to rebound. We can see that the rebound of gold is not strong, but it is relatively sustained, so gold has rebounded to around 3335. To be honest, I did short gold according to my plan and still hold a short position.
Although gold has rebounded to around 3330, I don’t think my short gold trade has failed. As I said in the previous point of view, gold is facing technical suppression of the head and shoulders in the short term, which will suppress the rebound limit within the 3335-3340 area. So before gold stabilizes at 3340, I think the gold shorts still have the upper hand. So as long as gold stays below 3340, I think the gold rebound is a good opportunity to short gold.
At present, gold is facing the resistance area of 3335-3340 and begins to show signs of stagflation. After consuming a certain amount of bullish momentum, the gold shorts may counterattack strongly again and stimulate gold to fall rapidly. Therefore, before gold breaks upward through the 3335-3345 area, we can still consider shorting gold, or continue to hold a short position in gold!
DXY // Inverted head and shoulders formationIf we can see closings above the green line, the first target exit is 97.878, which corresponds to Fibo 1.414, and the main target is 98.363.

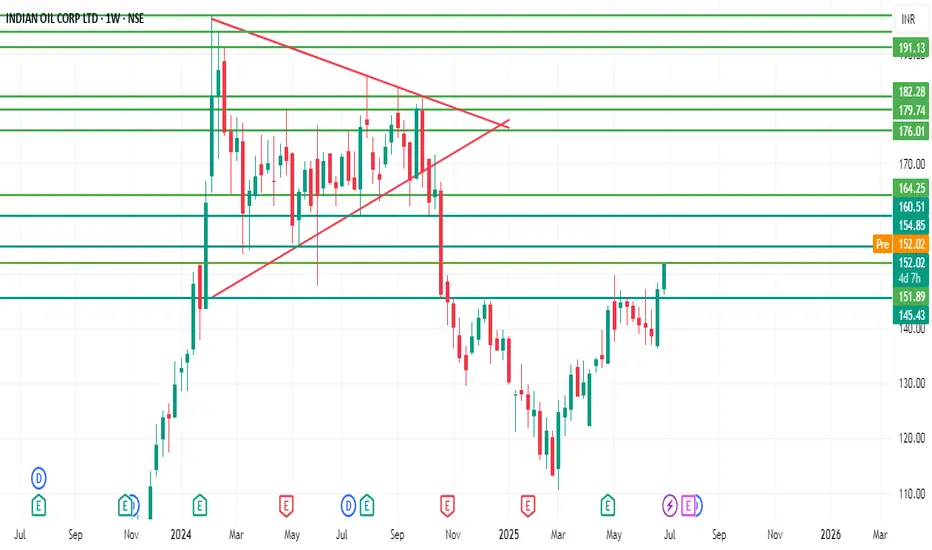
Go long in IOCWe have seen a clear breakout of inverted H&S pattern in IOC share. From here, we can expect targets of 154,160,165 & 174 on weekly frame. Stoploss against this investment can be placed near 145.
Powergridthis is daily chart of powergrid...
looking at the chart...
it is ready to move up...
as long as it holds its recent low...
Powergrid is ready to test upper levels of channel...
Just a View!!
Vedang!!
Disclaimer: Chart is for study purpose only!!

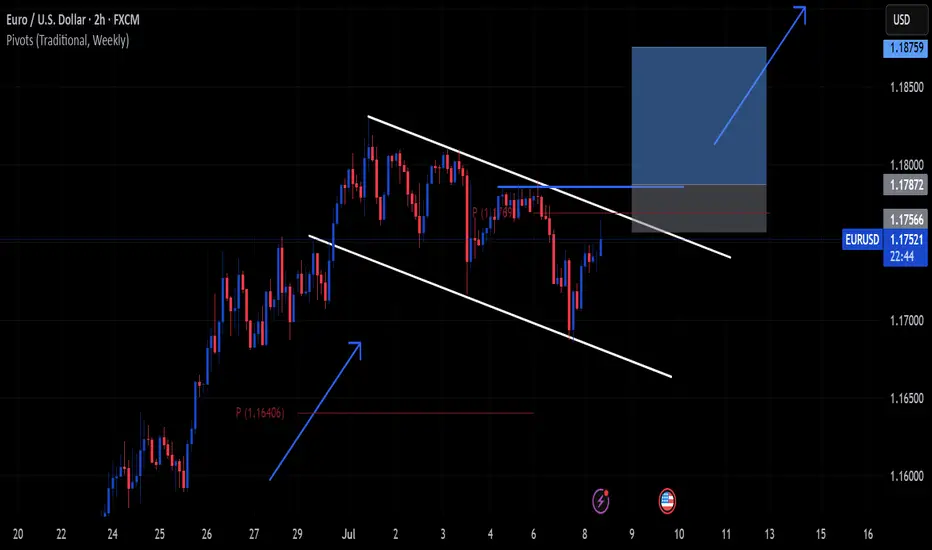
I win when I don't postLets see how it goes.
The consolidation that occurred because of the U.S holiday has led to giving buyers more power.
If not, I have a Stop Loss in place. We either win or we lose.
5th wave analysis + Market Structure support zone + Heads & shoulder(4H Timeframe) - we are currently in the right shoulder.
Risk what you can afford to lose

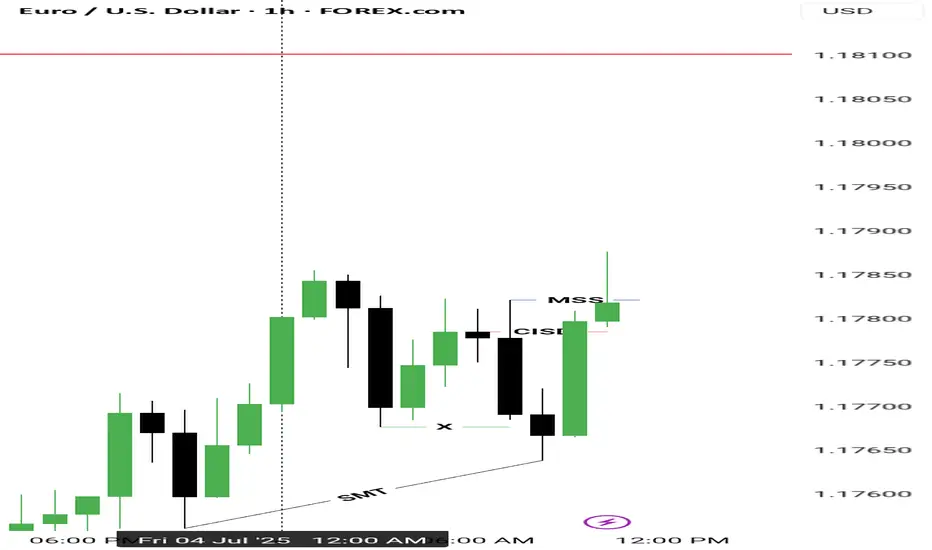
Possible buys for eurusd Dxy yet to confirm the CISD
HTF KEY LEVEL
1. Hourly OB; we've confirmed bullishness yesterday so 1H can serve as HTF
CONFIRMATIONS
1. liquidity purge ✅
2. Cisd ✅
3. ifvg✅
4. Fvg ✅
5. Mss ✅
ATG forming a right shoulder?Is this a textbook H&S pattern being formed? 643 is break out/neck line and 912 is the target. Looks like it and reversal will be know by September to November 2025.
This is not a solicitation to trade in ATG shares.

Apollo Hospitals – Inverted Head & Shoulders BreakoutChart Pattern: Inverted Head & Shoulders
Timeframe: Daily
Breakout Level: ₹7,565
Target: ₹8,980
Potential Upside: +18.7%
Stop Loss: ₹7,250
Volume: Strong breakout volume confirms institutional activity
RSI: 71 – Momentum strong, no signs of exhaustion or divergence
Technical Thesis:
Apollo Hospitals has completed a multi-month inverted head & shoulders pattern with a breakout above the ₹7,565 neckline zone. The structure developed over 8 months, showing accumulation and basing under resistance. The breakout is supported by the highest volume since Oct 2023 and a clean bullish candle. There is no visible supply zone until the ₹8,800–₹9,000 area, suggesting potential for a swift move.
Trade Plan:
Entry: On breakout above ₹7,565 or on pullback to ₹7,450–₹7,500 (if offered)
Target: ₹8,980 (based on measured move projection)
Stop Loss: ₹7,250 (below neckline and prior range low)
Risk:Reward: ~3.5:1
Disclaimer:
This chart and analysis are intended for educational and informational purposes only. This is not a recommendation to buy, sell, or hold any financial instrument. The views expressed are based on technical patterns and personal interpretation and may not reflect actual market movement. Always do your own research and consult your financial advisor before making any trading decisions. Trading in equities involves risk of capital loss.

7/4: Trade Within the 3313–3346 RangeGood morning, everyone!
Yesterday’s intraday trades delivered solid profits. Since the U.S. market will be closed today, news-driven volatility is expected to be limited. Therefore, today’s trading focus will primarily revolve around technical setups.
Current structure:
Key support: 3321–3316
Immediate resistance: 3337–3342, followed by 3360
If support holds and resistance breaks, a potential inverse head-and-shoulders pattern may form on the 4H chart, with the next target near 3380
If support breaks, focus shifts to the 3303–3289 support zone
Given the likelihood of range-bound price action today, the suggested intraday range is 3313–3346, with a preference for selling near resistance and buying near support.
If an upside breakout occurs, consider using the MA20 on the 30-minute chart as a guide for pullback entries.

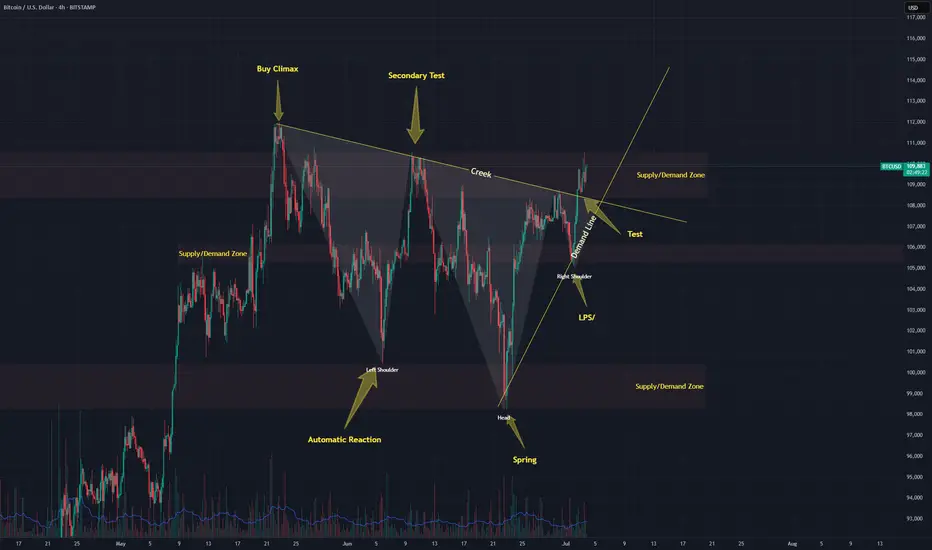
Markup coming for Bitcoin?I might have been entirely wrong about BTC. Are we finishing a re-accumulation pattern and about to markup?
Ugly inverted dandruff forming with the Wyckoff structure. Lets see what happens
#BTC #BITCOIN #WYCKOFF
BIST30 (USD) Monthly: Head & Shoulders Confirmed? Neckline RetesType: Bearish
The Turkish Stock Market (BIST30 or XU030), when viewed in US Dollar terms on the monthly chart, presents a textbook Head and Shoulders (H&S) topping pattern.
We can observe the Left Shoulder, a higher Head, and a lower Right Shoulder, indicating waning bullish momentum at the peak of what has been a significant rally.
The fact that this pattern is forming on the monthly timeframe underscores its long-term significance, suggesting a major structural shift rather than just a short-term correction.
The Neckline Break & Retest:
Crucially, the BIST30 (USD) has recently broken below its multi-month neckline, a key support level that connected the lows between the shoulders and the head. This breakdown served as the initial confirmation of the H&S pattern.
What we are witnessing now is the classic retest of this broken neckline. Price has rallied back towards this former support, which now acts as strong overhead resistance.
This retest often provides a 'last kiss goodbye' before the larger bearish move unfolds.
The market's reaction at this retest level will be paramount. A strong rejection from the neckline, potentially accompanied by increasing bearish volume or bearish candlestick formations on lower timeframes (e.g., weekly), would further validate the H&S breakdown and strengthen the bearish outlook.
Potential Price Target:
Based on the classic H&S methodology, we can project a potential price target. By measuring the vertical distance from the peak of the 'Head' to the neckline and projecting it downwards from the breakdown point, we derive a preliminary bearish target around 220 USD for BIST30 (XU030)

From Congestion to Collapse: Understanding Distribution and H&S A Simple Lesson: How to Identify Congestion Zones in the Market — Schabacker’s Approach and the Head and Shoulders Pattern
⸻
👤 Who Was Schabacker?
🔹 Richard Schabacker was one of the pioneers who authored seminal works on technical analysis.
🔹 He lived over 90 years ago and served as Editor-in-Chief of Financial World magazine.
🔹 His most notable book is:
Technical Analysis and Stock Market Profits
🔹 Published around 1932 in the United States.
🔹 Schabacker is often considered the “grandfather” of technical analysis, and much of the methodology traders use today can be traced back to his insights.
⸻
🟢 What Did He Teach?
🔹 Schabacker introduced a critical concept:
✅ The Congestion Zone
🌟 What Does It Mean?
When the market makes a strong move—either a sharp rally or a steep decline—price often becomes trapped in a range:
• Buyers at higher levels wait for further gains.
• Sellers at lower levels expect more downside.
But in reality, retail traders aren’t moving the market. Large institutions and funds—the so-called smart money—are in control.
👈 When these big players want to exit positions, they avoid selling everything at once to prevent a sudden collapse in price and to avoid revealing their hand.
✅ Their Playbook:
• Keep price contained within a narrow band between support and resistance.
• Gradually increase volume over time.
• Attract new buyers who believe the trend is still intact.
• Quietly distribute their holdings without alarming the market.
🌟 Why Do They Do This?
If they were to dump all at once:
• Price would drop rapidly.
• Everyone would realize a large seller was active.
• Institutions would get stuck, unable to exit at favorable prices.
🔻 So They Create Congestion and Distribution:
1️⃣ Sell discreetly over time.
2️⃣ Maintain the illusion that the trend is healthy.
3️⃣ Trap latecomers who buy into the range.
⸻
🟢 How Do You Recognize This on a Chart?
🎯 A Simple Example:
• Price climbs steadily from 3,000 to 3,300.
• Suddenly, it surges to 3,450.
✅ Most traders think the rally will continue.
🌟 What happens next:
• Price stalls between 3,380 and 3,450.
• Numerous candles form in this area.
• Volume remains elevated.
🔥 Inside this range:
1️⃣ Institutions sell into every upward move.
2️⃣ Early buyers remain committed, hoping for new highs.
3️⃣ New participants enter, unaware of the distribution.
🔻 What Do You See?
• Repeated candles oscillating within the same band.
• Failed breakouts above resistance.
• Sustained high volume.
✅ This is the classic Congestion Zone.
⸻
💡 How Can You Tell If It’s Distribution, Not Accumulation?
• Persistent high volume indicates steady selling.
• Price struggles to make fresh highs.
• Long upper wicks signal selling pressure.
• A Head and Shoulders pattern may start forming.
⸻
🎯 What Happens After Congestion?
• Institutions complete their distribution.
✅ Price breaks sharply below the range.
✅ The market drops quickly.
✅ Late buyers are forced to sell at losses.
⸻
🟢 Practical Illustration:
Visualize the range like this:
| |
| The Range |
| |
3380 ————> Resistance
| Multiple Candles |
| Multiple Candles |
| Multiple Candles |
3300 ————> Support and Neckline
✅ If price breaks below 3,300 on heavy volume:
• The distribution is complete.
• Price declines rapidly.
⸻
📌 Key Takeaway:
After any strong move, expect congestion as large players exit. Once they’re done, the trend often reverses.
⸻
🎯 Quick Tips:
✅ Never rush to buy inside congestion after a big rally.
✅ Watch volume—if it’s high, it’s likely distribution.
✅ Wait for a clear breakdown before shorting.
✅ Your target should at least match the size of the preceding move.
⸻
🔥 Let’s Cover the Head and Shoulders Pattern:
✅ What Is It?
A reversal pattern appearing after a strong uptrend, signaling the end of bullish momentum.
⸻
✅ Pattern Components:
1️⃣ Left Shoulder:
• Price makes a high.
• Pulls back.
2️⃣ Head:
• Rallies to a higher high.
• Declines again.
3️⃣ Right Shoulder:
• Attempts to rise but fails to exceed the head’s high.
4️⃣ Neckline:
• Connects the lows between the shoulders and the head.
🔻 When the Neckline Breaks Down:
It’s a strong sell signal. The market often drops decisively.
⸻
💡 Example in Numbers:
• Price moves from 3,200:
1️⃣ Up to 3,350 (Left Shoulder)
2️⃣ Down to 3,300
3️⃣ Up to 3,400 (Head)
4️⃣ Down to 3,300
5️⃣ Up to 3,350 (Right Shoulder)
6️⃣ Down to 3,300
✅ If price closes below 3,300 on strong volume, the pattern is confirmed.
🎯 Target Calculation:
• Head = 3,400
• Neckline = 3,300
• Distance = 100 points
• Target = 3,200
⸻
🟢 How To Trade It:
1️⃣ Don’t preemptively sell during the right shoulder.
2️⃣ Wait for a confirmed breakdown.
3️⃣ Enter a short position targeting 3,200.
4️⃣ Set your stop loss above the right shoulder.
⸻
🟢 Final Advice:
✅ The Head and Shoulders is powerful if confirmed by volume.
✅ Always wait for the neckline break—otherwise, it could be a false signal.
✅ Keep monitoring volume for confirmation.
⸻
🔥 Be disciplined in your analysis and decisive in your execution.
🔥 As Warren Buffett said:
“The stock market is a device for transferring money from the impatient to the patient.”
⸻
If you found this valuable, let me know—I’d be glad to prepare more lessons. 🌟

Call - BABADaily Chart Pattern : Falling Wedge
30 Min Chart Pattern : Head and shoulders. Forming right shoulder.
Enter call if it breaks neckline at $114.60 & monitor for a re-test
Stop loss if fails to re-test at ~$114
PT1: 117.84
Potential to retest ~$123.3. Will update after breaking PT1

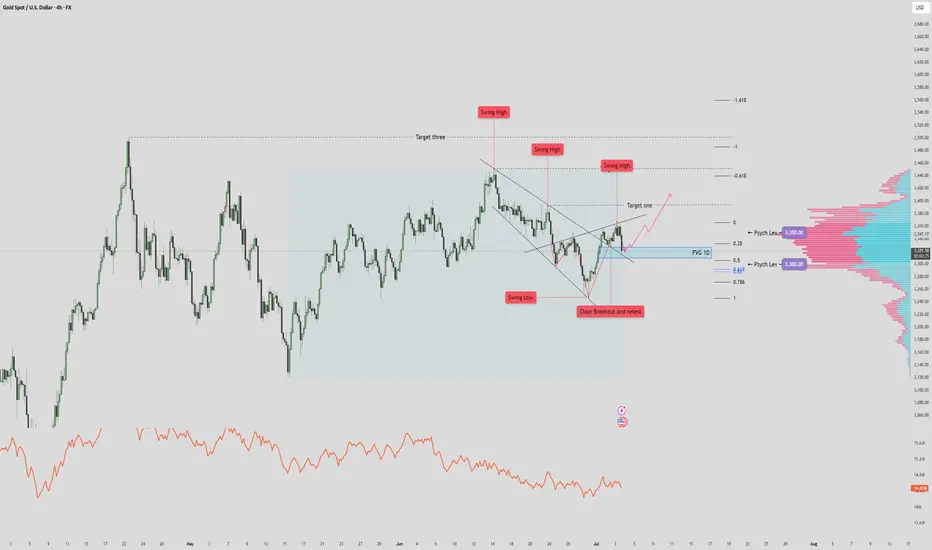
XAUUSD $3500 Recovery? Reverse Heads and Shoulders? 🔎 STRUCTURE & TECHNICAL ELEMENTS
1. Pattern:
A falling wedge was formed and broken cleanly to the upside → bullish reversal structure.
Breakout was followed by a successful retest at prior structure lows (marked “Clear Breakout and Retest”).
2. Fair Value Gap (FVG 1D) Zone:
Currently being tested. This zone coincides with:
Minor support from prior consolidation
Fib retracement (0.5 level)
Potential demand area (watch for bullish reaction/candle structure here)
3. Volume Profile:
3,350 = POC (Point of Control) → heavy resistance.
3,300 = Secondary HVN → strong support below current price.
Low-volume nodes just under current price → if broken, price likely accelerates into the GP zone.
4. Fibonacci & Liquidity Confluence:
Golden Pocket (3287) just below 3,300 = ideal liquidity draw if FVG fails.
Target 1 / 2 / 3 above are Fibonacci-based projections + historical swing zones.
✅ SCENARIO 1: Bullish Case – FVG Holds
If price respects the FVG 1D zone, expect:
Continuation up toward Target One (~3,430)
Extension to Target Two (~3,470) and even Target Three (~3,540+) possible
Confirmation: Bullish engulfing / high-volume bounce / sweep of intraday lows without close below FVG
Bias: Bullish continuation as long as price holds above FVG/0.5 Fib
🚨 SCENARIO 2: Bearish Case – FVG Breaks Down
If price closes below FVG zone, particularly below 3,312:
High probability drop toward 3,300 (psych level)
Liquidity sweep and deeper correction into Golden Pocket (~3,287) likely
This area can act as a high-probability long re-entry zone
Bias: Short-term bearish if close below FVG + swing structure invalidation
⚖️ REFINED SUMMARY
Price rejects off FVG - we can expect target 1 and 2 tagged.
Price breaks & closes below FVG zone - we can expect it to drop/wick to 3,300
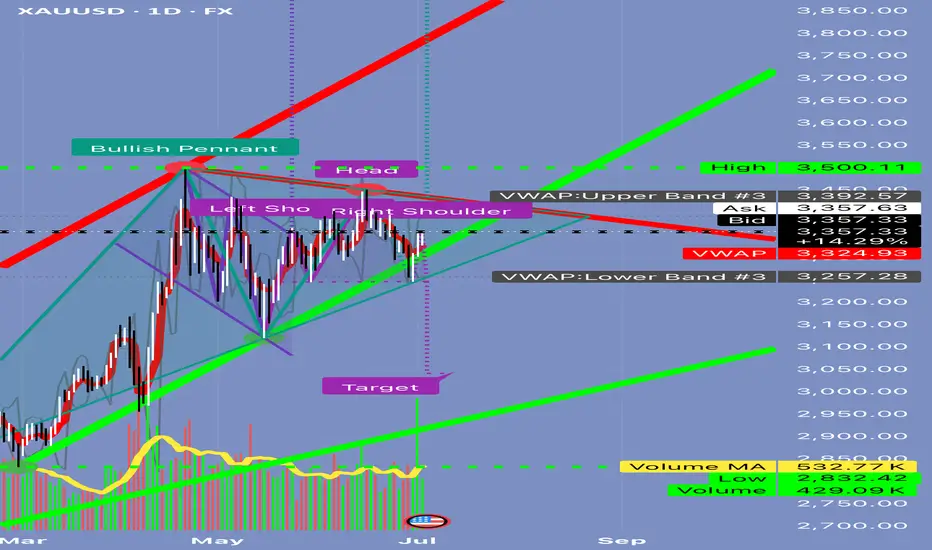
Can Gold Really Drop 10% in a Day?📘 EDUCATIONAL POST: Can Gold Really Drop 10% in a Day? Let’s Break It Down
Alright, traders—before you start thinking the sky is falling, let’s look this chart straight in the face and get real.
⸻
🔍 The Setup Right Now
Here’s what’s showing up:
✅ A bullish pennant forming up top (potential continuation higher).
✅ A big head and shoulders pattern in the middle (bearish).
✅ VWAP bands ranging from ~3,257 to ~3,392.
✅ Volume is underwhelming—426k vs 582k average.
✅ A big target line all the way down near 3,000.
This mix of signals can be confusing. Let’s separate the hype from what’s actually possible.
⸻
🎯 Q: Can the market collapse to 3,000 tomorrow?
Short Answer:
No.
Here’s Why:
1️⃣ Move Size:
• Current price is ~3,357.
• Target is ~3,000.
• That’s a -357 point drop (~10.6%) in one session.
• For gold CFDs, this would be an extreme event only seen in major crises (think 2008 or March 2020).
2️⃣ Volume Context:
• Today’s volume is below average.
• Big crashes are usually preceded by heavy distribution—this isn’t showing yet.
3️⃣ VWAP Anchors:
• The lower VWAP band sits at 3,257.
• Reaching 3,000 would require breaking through 3,257 support, 3,100, and months of prior buying interest.
4️⃣ Market Environment:
• It’s the July 4th holiday in the U.S.—liquidity is thin.
• Thin markets can gap lower but rarely hold a massive drop without a big catalyst (e.g., credit crisis, war headlines).
5️⃣ Pattern Confirmation:
• Yes, the head and shoulders pattern is visible.
• But to confirm it, you need:
🔹 A clear break of the neckline with double average volume.
🔹 Follow-through that pushes below 3,257.
• None of this has happened yet.
⸻
✅ What’s Realistically Possible Tomorrow?
If sellers show up, here’s what a big bearish day might look like:
1️⃣ First Move:
• Rejection at 3,357–3,392 resistance.
• Pullback toward ~3,324 (mid VWAP).
2️⃣ Continuation:
• Drop down to ~3,257 (VWAP lower band).
3️⃣ Extreme Scenario:
• Retest of 3,200–3,150 zone.
But a flush all the way to 3,000?
👉 Highly unlikely unless there’s a major global shock.
⸻
💡 Trading Tip: Stay Tactical
If you want to position short:
✅ Wait for rejection at 3,357–3,392.
✅ Short targeting 3,324 first.
✅ Scale profits there.
✅ Only hold runners for 3,200–3,150 if momentum accelerates.
⸻
🔑 Key Takeaway
3,000 is a structural target—this means it’s a price objective that might play out over weeks, not hours.
Trying to catch that in one day is chasing a black swan.
Stay patient. Trade levels, not headlines.
⸻
⚠️ Disclaimer:
This post is for educational purposes only. Always do your own research before trading.
⸻
✅ If you found this helpful, share it with someone who panics every time a red candle shows up.
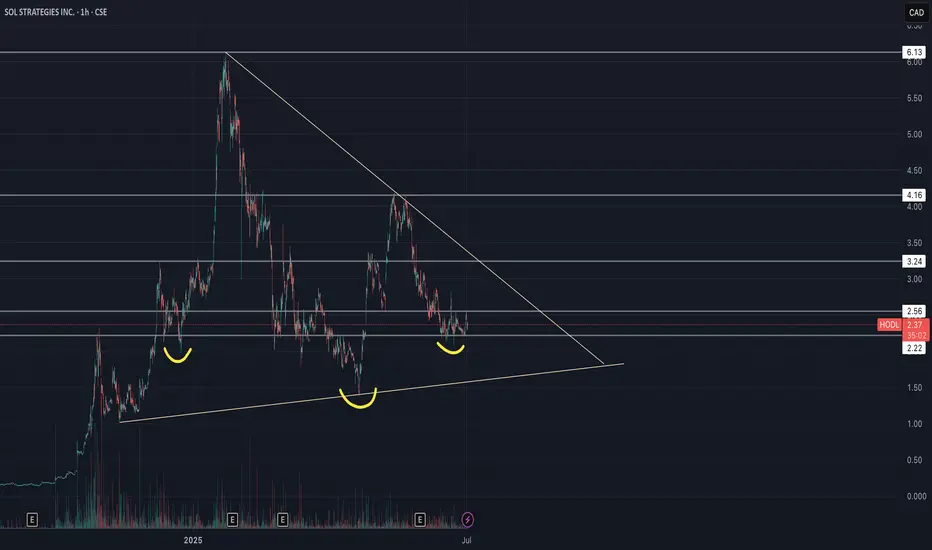
Sol Strategies Inc (HODL) - Inverse H&S🚀 SOL Strategies (HODL) – Public Market Gateway to Solana Yield
SOL Strategies (CSE: HODL) is a publicly traded company laser-focused on the Solana ecosystem. With nearly 395,000 SOL held (most of it staked) and over 3.7 million SOL delegated to their validators, they generate consistent income through staking rewards and validator commissions.
Their business model is simple:
📌 Accumulate SOL → Stake it → Run institutional-grade validators → Earn yield
📌 Expand through partnerships (3iQ, Neptune, BitGo, Pudgy Penguins)
📌 Hold strategic Solana ecosystem tokens like JTO and jitoSOL
📌 Operate with SOC 2-certified infrastructure and pursue a Nasdaq listing
SOL Strategies is not just holding crypto – they are building core infrastructure for Solana, giving equity investors direct exposure to staking economics in one of the fastest-growing blockchain networks.
📊 For traders: HODL stock offers a pure-play vehicle for Solana exposure, with an income-generating twist.
⚠️ Always do your own investment research and make your own decisions before investing.
SharpLink Gaming Inc (SBET) - Falling Wedge & Inverse H&S🚀 SharpLink Gaming ( NASDAQ:SBET ) – Ethereum, Joe Lubin & a Bullish Setup
SharpLink Gaming has undergone a bold transformation: the company is now the largest public holder of Ethereum (ETH), with ~198,000 ETH acquired since June 2025. Over 95% of it is staked, already earning 200+ ETH in rewards – turning ETH into a yield-bearing treasury asset.
Driving this shift is Joe Lubin, co-founder of Ethereum and CEO of ConsenSys, who recently became Chairman of SharpLink. Under his leadership, SBET is betting big on Ethereum as “digital capital”, aiming to merge iGaming and Web3.
📊 Technical Setup:
SBET is forming a falling wedge and an inverse head and shoulders – both classic bullish reversal patterns. After a post-announcement retracement, the chart suggests growing potential for a breakout as fundamentals strengthen.
🧠 My thesis: This is MicroStrategy playbook 2.0 – but with ETH instead of BTC. SharpLink gives equity exposure to Ethereum + staking yield + visionary leadership.
🔔 Worth watching closely.
⚠️ Always do your own investment research and make your own decisions before investing.
