TSLA: Very Dangerous Situation.• TSLA is still dropping, and although it is in a support area, there’s no bullish reaction confirming a bottom sign yet;
• The key support is the $187, which is the baseline of a this congestion, and if TSLA loses it, we might see a bearish reversal structure;
• What’s more, the $187 could be the neckline of a Head & Shoulders chart pattern;
• If TSLA turns bearish, I see it filling the previous gap at $146 in the next few weeks;
• In order to avoid this scenario, TSLA would have to do a very good bullish reaction as soon as possible, and break its main resistance area;
• The main resistance area on TSLA is made by 3 resistances that are very close to each other: In the 1h chart, there’s the 21 ema and the purple trend line connecting the previous tops; In the daily chart, there’s the 21 ema. Only if TSLA breaks this resistance area we would see a frustration of this bearish thesis.
Remember to follow me to keep in touch with my daily analysis!
Headandshouldersformation

Possible inverse Head and Shoulders pattern on Weekly TFSupport: $21820 (around)
$18800 (around)
Neckline: $24295

USDJPY HEAD AND SHOULDERSHead & Shoulders forming on USD/JPY. We will use downside targets using the Fib extension. This chart is based on the weekly timeframe.

$NU head and shoulders for a book.NU is presenting a perfect head and shoulder formation, where the neck was already broke.
Looking for at least the 4.37 level where is the daily MA200.
Let's see.

MTF Analysis THAT ARE SO OBVIOUS: EURCAD - Position SHORTDo i need to explain lol
i like color coding my timeframes, lines and other markings that correspond to a TF
so everything in color...
Black - Monthly
Green - Weekly
Blue - Daily
Other TFs
Violet - H4
Teal - H1
Orange - M15

EURJPY TWO TRADES PLAYEDHere u can see classic h6s pattern traded,maybe sl isnt on the best place 144.800? Would love to hear where would u put your sl,let me know in the comments!

BUY OPPORTUNITY FOR GOLDLooks like an inverted head and shoulders opportunity has presented itself..
wait for retest and buy..

Short Coal India !!!!Good day,
Hello Traders,
Coal India is ready for a big downside as already completed the Head & Shoulders pattern now just waiting for the breakdown of the Neckline.
Downside is evident. Good candidate for Short side.
Time Frame: Weekly
It also depends how market behaves.
Chart Self Explanatory.
Disclaimer: I am not SEBI registered analyst; this is for educational purposes.
Please trade as per your risk and do consult with your financial advisor before taking any
trading decisions.
If you really like the analysis, please do comments, LIKE and Follow me.

EURAUD I Weekly Forecast & How to Trade ItWelcome back! Let me know your thoughts in the comments!
**EURAUD Analysis - Listen to video!
We recommend that you keep this pair on your watchlist and enter when the entry criteria of your strategy is met.
Please support this idea with a LIKE and COMMENT if you find it useful and Click "Follow" on our profile if you'd like these trade ideas delivered straight to your email in the future.
Thanks for your continued support!

Head & Shoulders and long tradingThe chart should be self-explaining. Let's see if the order gets filled in the next weeks. Good trades, folks!

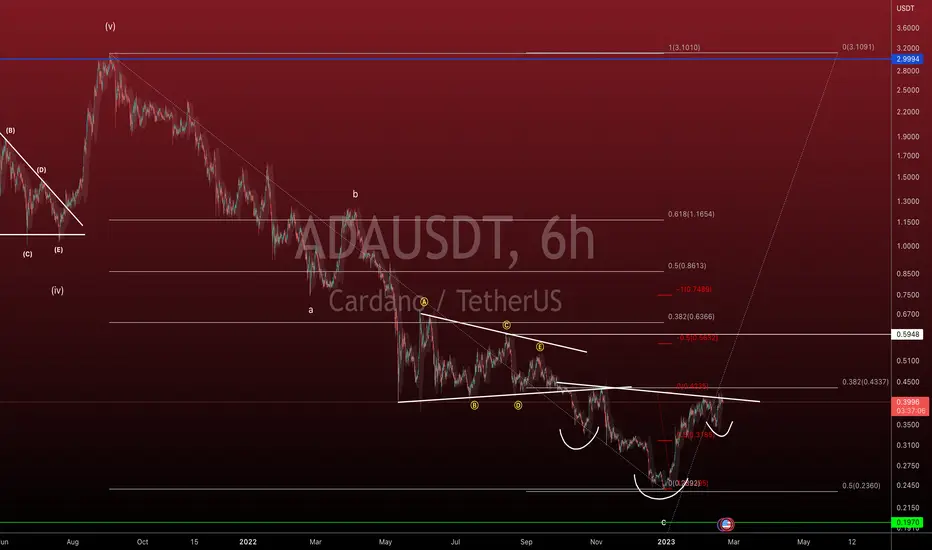
Cardano at a critical pointI gave a pretty vague outlook on Cardano the other day so I figure I should probably fess up a bit and let you all know exactly how I feel about it. Right now, it looks like we're in an inverted head and shoulder pattern. It looks like it wants to explode out of here and o straight for the target which is $0.75 but not so fast. Lets discuss a few things here.
First, do you actually know how to trade a head and shoulders pattern? Pattern trading can be pretty decent as long as you do it right. Ideally, we'll break out of the current pattern and do a nice solid retest of the neckline. Your stop loss should be the low of the right shoulder and your target should be 100% of the size of the head to the neckline. That puts us at right below 75 cents.
To compare, ADA is trading at 40 cents now. That's a pretty good reward, but what is the risk? Currently a 13% risk. That's not insignificant. Play your cards right and you'll be okay but don't do anything dumb. Wait for a breakout and get a retest of this level we're at now (around 40 cents) and you'll be ok. Just keep that stop loss to make sure you survive another day.
#Btc looks bullish only after!!!!#BTC Looks bullish only after closing the weekly candle above 25.3 k atleast else it can be dragged down to a range of 21.5k to 20.5k. So this weekly candle may be crucial for btc as for now it seems bullishastye falling wedge of weekly time frame is broken but need to sustain there, and good to go...
Just a view of mine. Not a financial advice .

Asian paints in an way of head and shoulder breakout Asian paints was in a way of its bullish head and shoulder breakout also with full support of RSI ..
Buy it at 2856
Target 2918 2964 3027
Sl 2730

8035 longAs you can see on the chart - I'm feeling bullish. Entering with a tight SL. Let's see how this trade plays out.

AUDUSD I It will continue downwardWelcome back! Let me know your thoughts in the comments!
**AUDUSD Analysis - Listen to video!
We recommend that you keep this pair on your watchlist and enter when the entry criteria of your strategy is met.
Please support this idea with a LIKE and COMMENT if you find it useful and Click "Follow" on our profile if you'd like these trade ideas delivered straight to your email in the future.
Thanks for your continued support!

bajajfinserveBajajfinserve made head & shoulder pattern on 30 min TF with decent volumes & comfortably trading above neckline.
Could be bought with mentioned stoploss & target.

USD/CAD HEAD & SHOULDERSPotential head and shoulders forming on the daily chart.
Note* We are currently in a strong bullish candle on the daily. Please use rules for trading any patterns.

Trading Idea - #DAXTrading Idea - #DAX
Sell/Short after head and shoulders pattern forms!
Entry: 15.290 (the neck line)
Target: 14.937 (the head height)
1. the initial rally into the pattern is often associated with a strong rise.
2. the first shoulder forms where price peaks before falling back to a support level - the neckline.
3. once the market reaches the neckline, it rallies to make a higher high before pulling back to the neckline.
4. the market then bounces off the neckline again, this time making a lower high than the previous bounce off the neckline.
5. the pattern is only confirmed when the sell-off from the second shoulder breaks below the neckline, after which the target equals the distance between the neckline and the top of the "head".

Future daily inverse H&S in TESLA? CPI reading could be decisiveThe recent rally of Tesla could be unstoppable. At least, until $316.10 level. A formation of an inverse head and shoulders could be underway should inflation lay low next Tuesday 14th of February CPI reading. However, in the context of high tensions between China and the US and Russia and Europe; other variables may affect the market destroying any prediction based on Chart Patterns. That is why, the support level of $166.47 should not be lost to continue believing in the beautiful bullish figure of the inverse H&S.
The level $258.58 could act as a resistance after the figure is completed, dragging TSLA down following the downtrend channel since Nov 3, 2021.
Let's see how it develops!

Short on AUD/USD...Yo People,
This week is going to be the best.
I am short on Aud/usd for the week. DXY has been inching upwards. AUD/USD has made a 5 wave move up and also is now forming the HnS pattern.
HnS is a good bearish pattern. Have marked my potential TP which is where i believe AUD will correct again from.
Let me know if you support this idea or have a different opinion.
thanks
Madtradex

WC0213 NZDCAD Outlook: M-W LongMTF Analysis
Monthly TF perspective
Pattern: Inverted Head & Shoulders
-Right shoulder forming at the Low of previous Month January. Price is also at the previous week's level.
-Looking at the next 3 months might be LONG til pattern's completed.
Weekly TF perspective
- My bias for Weekly Fibonacci retracement level for violent push upward is at 38.2 -- this retracement level also coincides with the downtrend Daily TF Fib 27 ext level.
- Many confluence at the 00 levels on H4 and H1 OB's and wick on wick area.
- .8350 is in confluence with the weekly key level
Daily TF
- .0875 / quarter level coincides with Daily Fib's 27 ext
Bias:
-Price will reach .8400 and will do a stop hunt until the 50's (.8350) before going up.
-Looking at the next 3 months might be LONG til pattern's completed.

Bitcoin head and shoulder formation As we move foward into this year price action, this idea I had when we mitigated the whole 2022 july candle is now lookin very likely to happen.
Perhaps this plays out like 2019, which means I might be a BIDDER around 19k area, and a SELLER if price founds its way back into range and get rejected. Basically, for the most trad0rs, a regular head and shoulders formation.
Bitcoin have a reacheable target this year around 28.000$ and 33.000$, but above 20k is for s*uckers, we bid below it.
Good luck !

BTCUSDT | Elliott Wave Projection | 4 Wave Correction Target Price action and chart pattern trading setup
> The previous minor 3 wave extended 2.618 of 1-wave with small head & shoulders formation.
> Potentially, minor 4-wave correction scenario at 0.5 fibonanci retracement of minor 3 wave impulse
> possible retesting SMA50 dynamic support at SMA50 X SMA200 level zone.
> Wait for reversal pattern in smaller timeframe TF4H / TF1H breakout confirmation
> Target 5-wave (major 1-wave) expected at 1.618 extension of 1-wave
> RSI sharply declined dead crossed uptrend line below 50, expecting further downside.
> Based on this scenario, TP at 27K-28K price zone +30% upside as completing this uptrend cycle.
Always trade with affordable risk and respect your stoploss!
Good Luck
