GOLD (XAU/USD) Analysis – Head & Shoulders & Target📌 Overview:
Today’s GOLD market presented an excellent educational setup using the MMC (Market Maker Cycle) methodology. We identified a Head & Shoulder reversal pattern, volume contraction at a key zone, a Major Break of Structure (BOS), and finally, a clear shift in market structure leading to a strong bullish move.
Let’s break it down step-by-step:
🧠 1. Head & Shoulders Pattern – The Early Reversal Signal
The pattern started forming around May 26–28, a classic Head & Shoulders that signaled potential exhaustion of the downtrend:
Left Shoulder: Price attempted to rise but failed to break previous highs.
Head: Sellers pushed to form a deeper low, forming the head.
Right Shoulder: Buyers entered again at the previous demand, creating a higher low than the head—indicating weakening bearish momentum.
🟦 The neckline was drawn across the swing highs. Once broken, it confirmed the reversal.
📍Significance: This pattern formed inside a strong SR Interchange Zone, where support turned resistance and vice versa—adding confluence.
🛠 2. Major Break of Structure (BOS) – Confirmation of Trend Shift
After forming the right shoulder, price decisively broke above the neckline and previous highs—this was the Major Break of Structure (BOS).
This is critical in MMC because:
It signals the end of the accumulation or manipulation phase.
It confirms that smart money has taken control and is pushing price in the new direction.
BOS acts as an entry trigger for traders using structure-based strategies.
💥 A strong bullish candle closed above the BOS level, showing aggressive buying.
📉 3. Volume Contraction – Smart Money Behavior
Between May 31 and June 2, we observed a tight consolidation at the previous resistance zone (now support).
Volume was contracting, forming a compression zone—a common sign of liquidity buildup by institutional players.
🧠 Why is this important?
Low volume ranges typically lead to high-volume breakouts.
This is the “accumulation before expansion” phase.
Smart money often accumulates orders here before a major move.
When price broke out of this compression, it did so with high momentum—validating this theory.
🔄 4. Structure Shifting – New Bullish Market Cycle
Following the BOS and breakout from volume contraction, price aggressively shifted its structure:
Higher highs and higher lows started forming.
Price invalidated bearish order blocks and respected bullish zones.
A new bullish market cycle under MMC began unfolding.
🚀 Price is now headed toward the Next Reversal Zone (around $3,460–$3,470), where we expect significant reaction.
🔍 5. Key Levels Explained
🔵 SR Interchange (~$3,280): This acted as a strong base for the Head & Shoulder formation. A key demand zone if price retraces.
🟦 Volume Contraction Zone (~$3,330–$3,350): Launchpad for the bullish impulse.
🟥 Next Reversal Zone (~$3,460–$3,470): A likely profit-taking or short-term reversal zone. Watch for bearish setups or consolidation here.
🎯 Strategy Insights (Based on MMC)
Entry Opportunity: After BOS + Retest of neckline or volume contraction zone.
Risk Management: Stop loss just below the previous low or reversal zone.
Target Zones: Next Reversal Zone or Fibonacci extensions depending on strategy.
📈 Conclusion
This GOLD chart is a textbook example of how technical confluences create high-probability setups:
✅ Head & Shoulder at demand
✅ Break of structure confirms reversal
✅ Volume contraction signals smart money entry
✅ Bullish expansion shows structure shift
🔔 Final Thought:
Watch closely how price reacts around the Next Reversal Zone. If bearish price action appears, it may provide a short-term reversal or retracement trade. Otherwise, a clean break above could signal the continuation of the bullish leg.
Headandshouldersformation

JPYUSD Technical Breakdown | Inverse Head & Shoulders + Target🔍 Pattern Breakdown: Inverse Head & Shoulders (H&S)
We’ve identified a textbook Inverse Head & Shoulders pattern, a classic bullish reversal formation that often appears at the end of a downtrend. Here's how the structure played out:
Left Shoulder:
The initial drop formed a local low, followed by a short recovery, creating the first "shoulder" on the left.
Head:
A deeper push down formed the lowest point of the pattern, indicating a possible trap for sellers or exhaustion in bearish momentum. This is the "head" and the key anchor of the pattern.
Right Shoulder:
A higher low forms, showing buyers stepping in earlier and with more strength. This symmetry confirms the structure and signals a potential reversal in trend.
Neckline:
Drawn across the highs between the shoulders, this key resistance line was broken decisively, confirming the bullish pattern and triggering an upward breakout.
📌 Trendline + Retest Zone = Confluence Support
After the breakout above the neckline:
Price surged strongly, showing confidence in the reversal.
It pulled back gently to retest the neckline, which now acts as support.
This retest also aligns with the upward trendline, adding confluence — a strong signal in technical trading that increases the probability of a successful continuation move.
This zone is labeled on the chart as:
🟦 “Like a Retesting Zone After Boom” — a perfect description of what’s occurring.
🎯 Target and Resistance Zones
The price is now moving toward a major resistance zone marked between 0.007020 – 0.007060, with a target zone slightly above at 0.007080.
These zones represent historical selling pressure or supply areas. A breakout above this region would open doors to even higher levels, signaling strong bullish continuation.
📈 Why This Setup Matters (MMC Strategy Applied)
Using the Market Mapping Concept (MMC) approach, this trade idea combines:
Market structure (Inverse H&S pattern)
Momentum confirmation (strong bullish move after breakout)
Zone mapping (support/resistance confluence)
Trendline validation (clean structure with pullback respect)
This creates a well-defined trade setup with clear entry and exit logic, excellent risk-to-reward potential, and technical confirmation.
✅ Summary: Bullish Outlook With Managed Risk
Bias: Bullish continuation as long as price holds above the neckline/trendline zone.
Confirmation: Inverse H&S pattern + successful retest.
Target: 0.007060–0.007080 resistance zone.
Invalidation: Break below 0.006980 and close under trendline support.
💬 Minds Post Caption (Extended)
🔥 JPYUSD Ready to Fly? Inverse Head & Shoulders Breakout Spotted!
Clean reversal pattern (H&S) just completed with a strong neckline breakout and a perfect retest at trendline confluence. MMC analysis suggests bullish continuation toward the 0.007060+ resistance zone. Classic "retest after boom" move. Watching price action closely! 🚀📊

2 Bullish Patterns under Construction ;-)APL Analysis
Closed at 460.36 (29-05-2025)
2 Bullish Patterns under Construction ;-)
Imemdiate Resistance is around 468 - 470
which needs to Cross & Sustain on Weekly basis.
It may then easily touch 550.
On the flip side, 441 - 445 may act as a Good Support.
& breaking 440 will bring more selling pressure towards
410 - 415.

H&S should lead the breakout Very simple but the dip inside Head and shoulders or buy near the breakout formation.
Ethereum should finally tise and break Resistance #1 and reclaim 2585 then lastly to break above 2650 #2 Resistance

BTCUSD MMC Breakdown – Curve Collapse & H&S Sell-Off Loading🔍 Chart Overview – BTC/USD (1H Timeframe)
This setup uses Mirror Market Concepts (MMC) to forecast Bitcoin’s next potential major move, blending institutional-level curve analysis, pattern recognition, and structure shifts.
We are currently seeing a Head & Shoulders (H&S) pattern develop under a Black Mind Curve Resistance, supported by a sloping neckline and a clear zone of structure breaks and retests. Price is positioned for a significant bearish continuation if confirmation hits.
📐 Breakdown of Key Components:
🧠 1. Mirror Market Concepts (MMC)
MMC focuses on the symmetry and memory of market behavior. When certain price structures mirror past reactions (support, resistance, or rejection points), we gain an edge in anticipating where big moves will happen.
Here, the curve structure and neckline level align to mirror prior bearish reactions.
👤 2. Head & Shoulders Pattern
Left Shoulder: Formed with rising volume and strong bullish momentum.
Head: A sharp move upward forming a new high, but eventually fails to sustain above the curve.
Right Shoulder: A weaker bullish attempt, indicating exhaustion and imbalance.
The neckline is clearly marked — a break below it validates the reversal pattern.
🟠 3. Black Mind Curve Resistance
This is an institutional resistance arc — an MMC dynamic level that mirrors prior selling patterns. Price reacted strongly under this curve, confirming its relevance.
It acted as a ceiling for the head formation, capping bullish continuation and turning price downward.
🔵 4. Black Mind Curve Support
Drawn beneath the price action, this dynamic support is about to be tested again. A clean break below the curve and neckline would likely result in a strong drop.
⚠️ 5. Major CHoCH & BOS Zones
CHoCH (Change of Character): Price failed to form new highs and showed early bearish shift.
BOS (Break of Structure): Confirmed when neckline is broken.
These are vital MMC confirmation points that strengthen the short idea.
🔁 6. Retest & Boom (Bearish Version)
Price could retest the neckline or the broken trendline (shown by the blue arrows), offering a perfect "sell on retest" opportunity before dropping to the target.
This is a classic MMC play — breakdown ➝ retest ➝ continuation.
🎯 7. Target Zone
Projected based on:
Height of the H&S pattern.
Previous key structure zone.
MMC symmetry principles.
Expected target: near $101,700 – $102,000.
🧨 Trade Idea:
✅ Bearish Setup (Preferred Bias)
Wait for a clean neckline break and candle close.
Look for retest of neckline or curve (lower timeframes).
Sell with target near $101,700, SL above right shoulder.
🚫 Invalidation:
Price closes back above right shoulder and curve.
Invalidates the bearish structure.

AUDNZD both scenarios possibles
OANDA:AUDNZD first analysis till target (attached), here is update and new view on AUDNZD.
We having trend line which is breaked, we having and H&S on top of trend, which also is breaked, price is after make bearish push, but in last period is stop progressing, its make few bouncens on sup zone 1.08230.
In case we see strong bearish push - break of 1.08350 we will have high chance to see higher bearish trend, in case we having break of top sup zone 1.09100 (violet line) we will having bullish confirm.
Personal more bullish, but lets wait for confirms.
Targets:
BULL: 1.10200, 1.10500
BEAR: 1.07800, 1.07500

KIMS in H&E PatternNSE:KIMS has formed H&E Pattern. If it sustains above 671, we have an entry and Target would between 700 - 800. Since there is a Resistance at 700, we need to be watchful here, if it crosses that Mark, next safe target would be 718. Those who are ready for Risk Reward, using Trailing Stopp loss / GTT, you can Target close to 800.

JPYUSD | Head & Shoulders Breakdown Setup | Bearish move Build🔍 Technical Overview
A clear Head & Shoulders pattern has formed on the JPY/USD 8H chart — a well-known bearish reversal setup often signaling a shift from bullish momentum to bearish control. The pattern is confirmed with a left shoulder, higher head, and lower right shoulder, all aligned along a defined neckline acting as key horizontal support.
Currently, the price is retesting both the neckline and a descending trendline, which adds confluence to the bearish bias. If price fails to break back above this resistance zone, we can anticipate a further drop toward the projected target zone.
📌 Key Technical Levels
Head: ~0.007180
Neckline Support: ~0.006660
Retest Area (Confluence Zone): ~0.006940–0.006960
Bearish Target: ~0.006470 (measured from the head to the neckline and projected downward)
Trendline Resistance: Acting as dynamic resistance since the recent high
⚙️ Price Action Insights
Pattern Clarity: The structure of the H&S is clean and symmetrical — a classic sign of distribution and topping out after a bullish rally.
Retest in Play: Price is currently retesting the trendline resistance. Rejection from this area strengthens bearish continuation potential.
Momentum Shift: Bullish pressure is weakening. Lower highs on the right shoulder show buyer exhaustion.
🧠 Mindset & Strategy
This setup demonstrates how patience, pattern recognition, and confluence can align to offer a high-probability trading idea.
✅ Wait for Confirmation: A strong bearish candle off the retest zone or neckline breakdown gives a cleaner short entry.
✅ Risk Management First: Place stops just above the right shoulder or trendline (~0.007000 zone).
✅ Target Logically: The target is not random — it’s derived using the classic measured move technique, matching the head-to-neckline distance.
📋 Trade Idea (Not Financial Advice)
📍 Entry: On rejection at retest zone or confirmed neckline breakdown
🎯 Target: 0.006470
🛑 Stop Loss: Above 0.007000 (trendline/right shoulder area)
⚖️ Risk/Reward Ratio: Minimum 2:1 if entered post-retest confirmation
🧠 Trader’s Note (Minds Insight)
This is where discipline comes into play. Don’t chase the move. Let the pattern complete and confirm. Head and Shoulders formations are among the most reliable reversal patterns — but only after neckline breaks or strong rejections.
This setup teaches traders to trust the process, combine horizontal and diagonal resistance, and let the price action do the talking.

Inverse Head & Shoulder Breakout - MAHSCOOTERTechnical Analysis:
Current Price: ₹13,755
Target: ₹18,000 (significant potential upside)
Bullish Patterns: Inverse Head and Shoulder breakout confirmation or Cup & Handle pattern formation/breakout (chart needed to confirm which is more dominant and the status of the breakout).
Time Frame: 1 to 3 months.
Updated Fundamental Considerations:
High P/E (91.6): Suggests premium valuation, implying high growth expectations.
Positive EPS Growth (YoY): EPS ₹188 vs. ₹174 indicates positive earnings growth over the past year.
Strong Latest Quarter EPS (₹45.2): Significantly higher than the previous quarter, signaling a potential positive shift in profitability.
Industry P/E (21.6): Highlights the substantial premium the market is placing on MAHSCOOTER compared to its peers.

TATA Tech Breakout: Inverted Head & Shoulder Targets ₹856+A bullish reversal pattern forming in Tata Technologies Ltd (TATATECH) on the daily timeframe.
Pattern Identified:
📌 Inverse Head and Shoulders Pattern
Left Shoulder: Price dips and recovers
Head: A deeper dip followed by recovery
Right Shoulder: A higher low and bounce
Neckline: Resistance around ₹755 is tested multiple times
Key Technical Insights:
Breakout Above Neckline: Today's close above ₹755 confirms breakout
Target Projection:
Target = Neckline + Height (from Head to Neckline)
Projected Target = ₹856+
Volume Confirmation (optional): Typically, volume should rise during breakout for stronger confirmation
Sentiment:
Reversal from downtrend to possible uptrend
Bullish momentum expected to continue toward the ₹856+ zone

Inverse H & S pattern appearing..Currently at Resistance around 24.50
Inverse H & S pattern.
Sustaining this level may reach towards 25.50 & 26.70
It should not break 18.50; otherwise we may see trend
reversal.

Inverse H&SBeautiful Inverse H&S pattern in place.
Sustaining 42 may lead it towards 48 & then 50 - 54.
39 - 40 can be an immediate Support.
However, breaking 36 may bring more Selling pressure.

EURCAD no3 view, bearish continuation still to expect
OANDA:EURCAD last two analysis on EURCAD doing, going good, will be attached, having now one more update and new view.
Price at end is break RAISING WEDGE and BEARISH FLAG, pushing strong bearish, strong volumem and momentum is gathered and still here having strong bearish expectations.
SUP zone: 1.57200
RES zone: 1.53000, 1.51600

CRV Head and Shoulders Pattern Formed – Breakout Confirmed🚨 CRV Head and Shoulders Pattern Formed – Breakout Confirmed 📉
CRV has formed a head and shoulders pattern and has already broken out of the neckline. This could signal the start of a potential downtrend, with further downside ahead. 📊
Let’s monitor this downtrend together! 💼💸

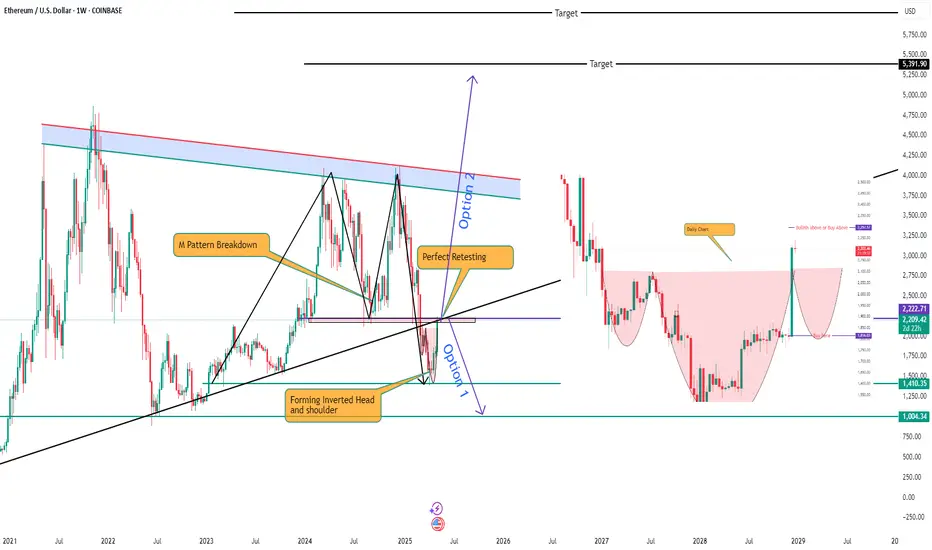
Ethereum - Perfect exactly how I thoughtEthereum
Stage 1 - Triangle Pattern - Gave perfect breakdown of triangle pattern
Stage 2 - Form M Pattern - Have almost completed the selling target
Stage 3 - Retesting completed *Current)
Stage 4 - Forming inverse cup and handle and inverted head and shoulder pattern
Stage 5- in either of the scenario it may come down but if it goes above 2297 expect it to reach 4000/500/7000 in coming days
Stage 5.2 - if the retesting is completed and bearish patter is continued expect it to reach to 900 USD
For more details ping me
GK Trade manthan
TOST Target Price $74.18 - LARGE Cup Handle Formation.Large C & H formation with ultimate Target Price of $74.18. Within the Handle is an inverted H & S formation with 1st Taregt of $45.13

Inverted H&S Pattern in place.
Inverted H&S Pattern in place.
Breakout done.
May take a Risk with a SL of 81 on Closing basis.
Targets can be around 92 - 95 then 100-102

EURCAD update and new view on EC
OANDA:EURCAD in first view (attached) we are have at end break of zone and also break of trend line, price is start pushing bearish.
Now RAISING WEDGE pattern is visible, looks like strong momentum is gathered and from here expecting one more fall.
SUP zone: 1.57100
RES zone: 1.54600, 1.54000

Mega Cap Tech Setting a Head & Shoulders – Breadth Collapse IncoICEUS:NYFANG (FANG+) is showing a textbook Head & Shoulders pattern — Left Shoulder, Head, and a freshly printed Right Shoulder.
The setup becomes even more concerning when you combine it with the Nasdaq Oscillator, which just printed an identical spike to the one that marked the 2024 top.
🧠 Here's the backdrop:
Netflix, Meta, Google, and Microsoft have already had their post-earnings moonshots.
Tonight it’s Amazon and Apple — the last two horses in the race (Nvidia is still weeks away).
Breadth is collapsing — this rally is being carried by fewer and fewer names.
📉 Breakdown below the neckline could mean:
🔻 –25% correction (minimum)
🚨 Potential –50% wipeout if the neckline fails

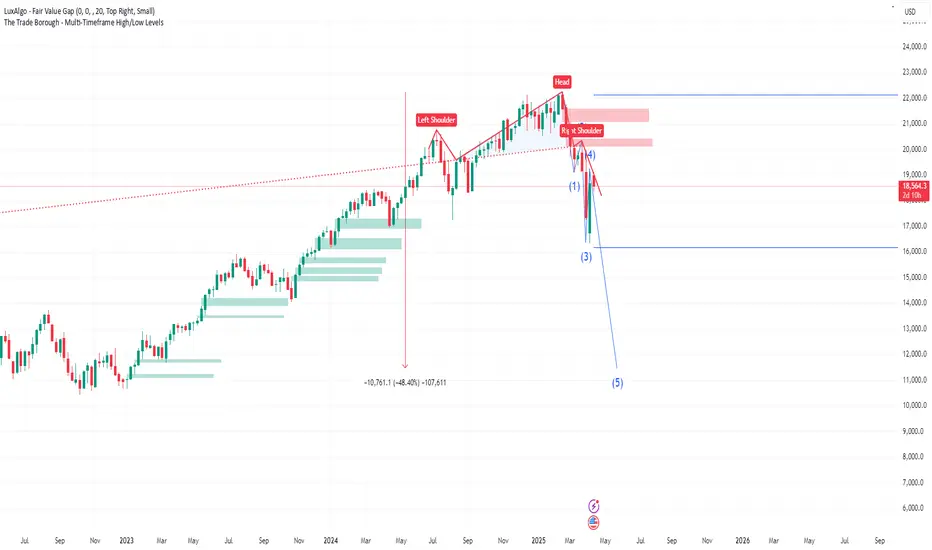
No shampoo in sight.....and an $11k Nasdaq?This posts presents an idea that has no precedence (that I can recall at least), so this is by definition a crazy idea BUT the chart is showing signs of extreme exhaustion and is possibly and quite frankly on the verge of a potentially destructive collapse.
If the recent severe volatility hasn't peaked your attention... this chart should.
It's quite simple...we have a MONSTER Head and Shoulders pattern on the Weekly TF...and we're finishing off the Right Shoulder! From a chart pattern perspective, this is ultra-ultra bearish.
The confluence we have is the Elliot Wave showing the we could be about to enter Wave 5. Elliot Waves are of course subjective BUT in this case its syncs with the Head and Shoulders.
If this was a 15min chart, most would probably agree hands down, but this is a Weekly Chart and represents Trillions on Trillions so its hard to believe that this could even be a possibility.....but I believe it could happen!
The horizontal blue lines provide 2024's High and Low Price. For this disaster scenario to be avoided, the Bulls and anyone who cares must defend 2024's low around 16100. This must not be breached, to keep the 12M bullish structure in place.
The green shaded areas highlight all of the Buy Side fair value gaps on the WEEKLY TF going back to early January 2023!
Could the market dive for these in devastating fashion? Only time will tell.
In the interim, we should trade safe and manage risk as best as we can.
XRP - Time to buy again!The pattern has broken, and now I expect the price to rise to $3 . AB=CD.
Give me some energy !!
✨We spend hours finding potential opportunities and writing useful ideas, we would be happy if you support us.
Best regards CobraVanguard.💚
_ _ _ _ __ _ _ _ _ _ _ _ _ _ _ _ _ _ _ _ _ _ _ _ _ _ _ _ _ _ _ _
✅Thank you, and for more ideas, hit ❤️Like❤️ and 🌟Follow🌟!
⚠️Things can change...
The markets are always changing and even with all these signals, the market changes tend to be strong and fast!!

H&S pattern Breakout.
H&S pattern Breakout.
67 - 68 can be an important Support.
71.50 - 72 is the initial Monthly Resistance.
Crossing & Sustaining this level may
take the price towards 82 - 85.
However, breaking 61 may result in
further selling pressure.

Gold can break support level and continue to declineHello traders, I want share with you my opinion about Gold. For a while, Gold was confidently moving within an upward channel, with each impulse supported by rebounds from the lower boundary. After breaking out of the buyer zone, the price made a strong bullish move, supported by momentum and healthy corrections. This movement continued up to the current support level at 3285, where the price began to stall. Then, a classic Head and Shoulders pattern has now fully formed. The left shoulder, head, and right shoulder are all visible and aligned with the support area, which now acts as the neckline of the pattern. This isn't random, it's a well-defined reversal signal forming after an extended bullish leg. The rejection from the right shoulder shows evident seller control, and the price is now testing the neckline from below. The support area has already been broken once, and any bounce from here appears corrective rather than impulsive. Given this setup, I expect that price can fully breakdown toward the 3060 level, which acts as both a strong historical support and my TP1. Please share this idea with your friends and click Boost 🚀
