Down to 5.5 and Lower or Back to ATH at 19.4Scenario A:
- Confirmed Head/Shoulders top, successful re-test and then down to 5.5%
- Likely headed much lower after losing the lower trendline of a long-term rising wedge, which has also been successfully re-tested and has continued down
- Possible because of two confirmed patterns and re-tests.
Scenario B:
- Unconfirmed Falling Wedge, which if it breaks up from will target ATH at 19.4% and bring us back into the rising wedge on pending a 2nd re-test.
- Double-top and then true exit of the rising wedge before heading much lower
- Possible because this behavior would be similar to the behavior following its previous set of peaks in 2017-18.
Headshoulders

Ethereum Heading towards a Double-Top?The triangle breakout's 1.5x target is in alignment with Ethereum's ATH, and if it gets there relatively soon or even takes longer and makes a slightly higher new ATH, it would also act as a re-test of the neckline of its Head & Shoulders top formed over Spring of 2021 -> Spring of 2022.

Bitcoin ($BTC): Chart Patterns in Mid Term...Hi everyone!
The Daily Chart should speak clearly, so we have two potentially interesting patterns that we could follow in the coming weeks.
From a technical point of view, we are talking about a "Head & Shoulders" and an "Inverted Head & Shoulders" .
The levels shown on chart are approximate, what I am interested in sharing with you is the potential swing that Bitcoin should form in the Mid Term (Log Scale).
Trade with care! 👍 ...and if you think that my analysis is useful, please..."Like, Share and Comment" ...thank you! 💖
Cheers!
N.B.: Updates will follow below

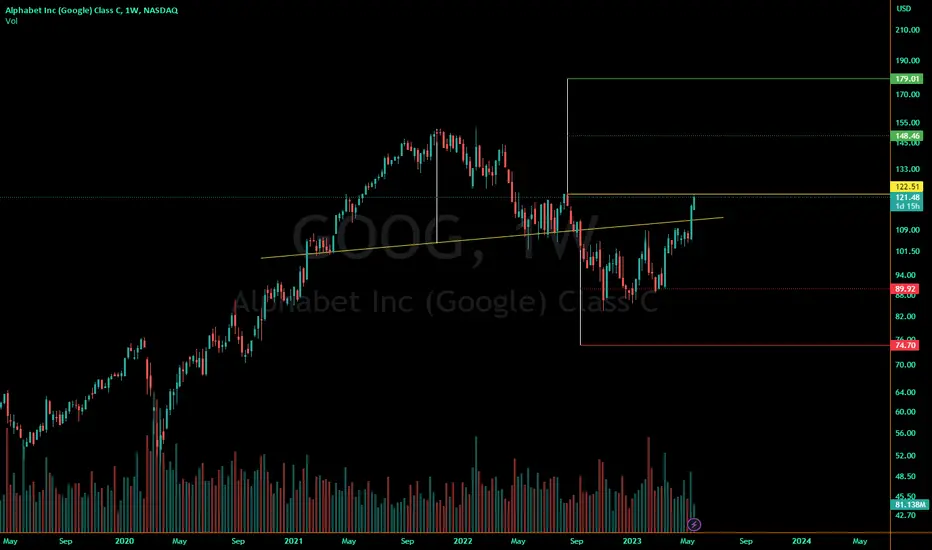
Google at major decision areaMove and hold above 122 and Google will see ATH again, possibly a new ATH near 180. Remain below 122 and lose the 2nd yellow line below it, and it's headed back down to recent lows and lower.
Ocean Likely Headed LowerUnless it can break back above the H&S neckline and then the right shoulder, Ocean Protocol may be headed down towards the following targets instead of seeing north of a dollar again:
- TP 1 = ~8.6 cents
- TP 2 = ~3.8 cents
A possible 2x measured move would take it back under 2 cents and less than 3/10ths of a cent above the weekly close of its ATL.
Should it instead break above the neckline and right shoulder @ approx $1.10, then it could revisit its ATH or see a new ATH. Until it does that, the proposed sentiment is short.

BTC daily ... not goodThis #BTC daily chart says a lot. We have a descending channel, a head and shoulders pattern and two identified order blocks.
If we were to prioritize any over the other , the suspected direction result would be the same as we have weakness dropping out of the H&S, continuation to the downsides on the descending channel and a resistance level so thick (upper order block) that the most logical way for the price to go to would be lower.

Scenario - Possible Sweep of 18k or Even 11-12k Before 40kHere's a scenario where Bitcoin forms a bearish head/shoulders pattern within its parallel downtrend, before breaking out of it to reach 40k.
One option has it stopping around the expanded flat's 1.618 one last time @ ~18.3k.
Option 2 gives us a new low beforehand around ~11.7-12.5k.
For either of these scenarios to play out, Bitcoin would first need to lose 25.2k and then ~19.5k.
This is an idea based within another previously published chart linked below:

BTC 1W hidden Head and Shoulders pattern shown on 2h Looking at the weekly chart, I noticed a clear H&S pattern on VWAP. VWAP is an intraday indicator, but it can show a pattern in larger frames, like now.
I was trying to find a way to draw and measure it clearly on commonly used timeframes, but it is most apparent on a 2h chart.
As you can see on VPVR on the right, the neckline is below the 27100 resistance, and if it breaks it, there is a gap down to 25100. But the full potential of the pattern targets 23100.
On my trend wave indicator, the weekly trend reached a local top on the 17th and turned bearish at the +60 line. Right now, it is right above the +50 line.
That area often acts as support and resistance. And here on 2h, the trend is reversing right above the zero line, which is also strong support.
Still, since this timeframe is not usual, this could also mean that trend is being rejected from it.
The chart is bearish. Volume is low.
But the price is what it is. Trade with the trend. But it doesn't hurt to be prepared. Right?

Re-test Wedge or Reach Halfway to Wedge Break's TP 1Wedge breakout occurred, head/shoulders here that has:
- success = re-test top of wedge
- failure = reach halfway point to wedge's TP 1

Head & Shoulders Success and Failure TargetsGrayscale Ethereum Trust ETF appears to be forming a giant head/shoulders. If it continues in that direction, this would make it bullish in the near-term, up to around 20-21.
After hitting 20-21, pay attention to whether it succeeds or fails in confirming the pattern and the succeeding in staying below neckline lows or failing and moving back above the right shoulder.
Targets shown on the chart for either scenario. Look for a potential move up to 20-21 first.

CHFJPY - Bearish Head and Shoulders📉Hello Traders👋🏻
On The Weekly Time Frame, The CHFJPY Price Reached a Major Key Level (151.071-151.494) ✔
The Price Failed To Create New Higher High 📈
Currently, CHFJPY formed a Head and Shoulders Pattern ✔
The Neckline is Broken 🔥
So, I Expect a Bearish Move 📉
-----
TARGET 1: 148.686🎯
TARGET 2: 147.700🎯
___________
if you agreed with this IDEA, please leave a LIKE, SUBSCRIBE or COMMENT!

2 Quasimodo Reversals - Small and Large timeframeshere are 2 quick little quasimodo reversals on #UJ here.
Smaller one in yellow outlines the inverse bullish move with entries on lower time frames.
Larger quasimodo (green) follows a larger move that could pull this down a bit before a continuation upwards.

Inverse HS or Falling Wedge?Others dominance will make a decision soon:
1.) Bearish Head / Shoulders moving significantly lower
2.) Bullish Falling Wedge moving back towards ATH

Simple Pattern Targets for TeslaTesla looks bearish, a confirmed Head / Shoulders already moved down to its 1x measured target, TP 1.
For a bullish outlook, it first needs to get above the resistance area and the neckline of the Head / Shoulders pattern, but before we could consider reaching previous ATH or even a new ATH, it would also need to cross and hold above the right shoulder.
More likely, we continue facing resistance in the area marked on the chart (and at the 200 day EMA), and simply continue down to TP 2, around approx $76. It may see some consolidation around TP 1 and the halfway target to TP 1, where it is now, prior to heading further down.
Marking the chart short, but accounting for the bull scenario in case it does occur.

QNT multiple indicators pointing to long-term bullish breakoutBINANCE:QNTUSDT
Multiple indicators pointing to a potential price outbreak (long direction).
Head and shoulders
Triangle
Fib retracement (for mid-term projection)
THIS IS TOO RISKY FOR LEVERAGE IDEAS, TRADE ON SPOT AND WITH CAUTION.
NOT FINANCIAL ADVICE.

EURGBP, Bearish H&S, Short term sellPrice action is in a down trend as we can see on the HTF price is moving within a decending channel. Looking at the LTF we can see a short term sell opportunity as price is potentially completing the right shoulder of a Head & Shoulders pattern which in nature is a bearish indicator.
Look for a short entry around the neck line of 0.885 that fits your trading plan.
Thanks
Trade Safe
**If you felt this was helpful in anyway hit the LIKE button and FOLLOW me for more analysis and educational ideas**
Comment below and share your opinion on this set up.

More to the downside?Risk management!!!!!
I see other possibilities in this trade, but just decided to publish this one because it has a more quality than the others and the probability than others.

Bitcoin's situation+next targets and expected movements.BTC has created an Inverse head and shoulder pattern which means a great bullish trend is on the Horizon. If the price follows this pattern's expected movement,we shall see it reach 40k pretty soon or at least in mid term duration. The expected movement is as much as the measured price movement (AB=CD).The break out has occurred but the confirmation candle has yet to be closed. We might even see a correction one more time before ascending further.keep in mind that the next big resistance for btc will be around 40k.
_ _ _ _ _ _ _ _ _ _ _ _ _ _ _ _ _ _ _ _ _ _ _ _ _ _ _ _ _ _ _ _ _
🌍Thank you for seeing idea .
Have a nice day and Good luck

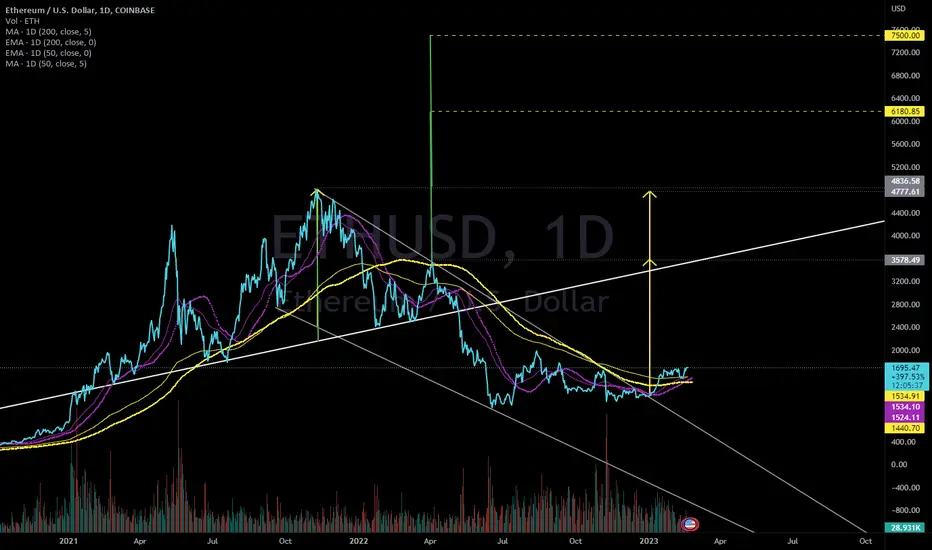
Falling Wedge Targets Could Trigger Failed HS Targeting 7500Ethereum broke out of a falling wedge and is showing a golden cross on the 50/200 day MA (dotted), and approaching the same on the 50/200 EMA.
Its falling wedge TP 1 lies right around the neckline of a Head and Shoulders pattern that we fell below during Spring of 2022, as well as the right shoulder.
Falling wedge TP 2 lies just near previous ATH. Get above right shoulder to trigger failed HS, get above ATH to head to 6180 and ultimately 7500.
Note - a successful HS would take Eth back to 0 on its first measured target, so which is more likely - 0 or 7500 following the swap to proof of stake?
Asian paints in an way of head and shoulder breakout Asian paints was in a way of its bullish head and shoulder breakout also with full support of RSI ..
Buy it at 2856
Target 2918 2964 3027
Sl 2730

Head and Sholders. BTCUSDT moves down along this patternBTCUSDT has been moving down Head and shoulders for several days. Probably further movement down this figure. The head and shoulders are automatically identified by my script:

$STNG Head & Shoulders Target $39.00I was kind of intuitively guided to this one and have been thinking it's heading down. Looks ready to break the neckline and my dowsing says energy is really bearish.
I asked for a target within the next month and am looking in the zone of $38-40.00

SUGAR Right ShoulderThe Right Shoulder is forming, maybe it'll be another Head and Shoulders pattern on a lower timeframe.
