What is Head and shoulders pattern and how to trade with that?*The Head and Shoulders ( Bearish ) pattern is one of the most popular and best known price patterns in trading.
This is a very accurate trading signal if you know how to use it properly and flexibly.
*What is Head and Shoulders? How to identify and characterize
Head and Shoulders is the name of a special type of price pattern that usually appears at the end of uptrends. This is a signal of future downtrends.
It is called Head and Shoulders because the shape of this pattern on the price chart is similar to that of the human body including Left Shoulder, Head, and Right Shoulder.
The line connecting the two troughs of the shoulders is often called the neckline. In fact, this pattern is perfect when the Neckline is horizontal (the prices of the two lows are approximately the same).
How to trade with this:
ENTRY POINT : Right after the candlestick breaks out of the neckline (or at the Retesting the neckline )
STOP-LOSS : At the peak of the right shoulder.
TARGET : Usually, Head and Shoulders is a pattern for starting a downtrend. Therefore, adjust the first target to the height of the neckline to the top (H) of the pattern and adjust the next targets according to the past price and chart.
This is the academic shape of this pattern, in the future we will publish other types of head and shoulder patterns 📚 . Please follow our page to be informed as soon as the materials are published.
Thank you all for supporting our activity with Likes 👍 and Comments ❤️
Headshoulders

XAU/USD Head And Shoulder XAU/USD Head And Shoulder M30 timeframe
As We Seen Gold showing As Head And Shoulder Pattern
We Expected a Bearish Move
Select the Targets We given in Our Analysis
Enjoy the Trades !!

GOLD SELLPossible heads and shoulders... looking at a very likely huge drop on price for Gold...approximately +500 Pips Down

EVR - broke neckline on strong volumeEVR formed a bearish Head & Shoulders and 1st started to break the neckline on 20 Jan, however it began a strong shortly after that brought it back above to retest the declining 50day Moving Average. The death cross (50 day MA crossing below the 200 day MA) is now apparent, so are lower highs and lower lows. Last Friday's break of the neckline (again) was on very high volume.
Tested some shorts with a tight stop loss just above 130. The theoretical target of this H&S will be aroud 83. However, I would protect profits with trailing stops if trades goes my way.
Disclaimer: TA is about improving our odds of a successful trade (not a guarantee). This is just my own analysis and opinion for discussion and is NOT a trade advice. Please your own due diligence and trade according to your own risk tolerance and don't forget that money management is important! Thank you.


How to Measure Head & Shoulders TargetWhat Is a Head and Shoulders Pattern?
A head and shoulders pattern is a chart formation that appears as a baseline with three peaks, where the outside two are close in height and the middle is highest. In technical analysis, a head and shoulders pattern describes a specific chart formation that predicts a bullish-to-bearish trend reversal.
The head and shoulders pattern is believed to be one of the most reliable trend reversal patterns. It is one of several top patterns that signal, with varying degrees of accuracy, that an upward trend is nearing its end.
The first and third peaks are shoulders, and the second peak forms the head. The line connecting the first and second troughs is called the neckline.
An inverse or reverse head and shoulders pattern is also a reliable indicator that can signal that a downward trend is about to reverse into an upward trend. In this case, the stock's price reaches three consecutive lows, separated by temporary rallies. Of these, the second trough is the lowest (the head) and the first and third are slightly shallower (the shoulders). The final rally after the third dip signals that the bearish trend has reversed and prices are likely to keep rallying upward.
The opposite of a head and shoulders chart is the inverse head and shoulders, also called a head and shoulders bottom. It is inverted with the head and shoulders top used to predict reversals in downtrends. This pattern is identified when the price action of a security meets the following characteristics: The price falls to a trough and then rises; the price falls below the former trough and then rises again; finally, the price falls again but not as far as the second trough. Once the final trough is made, the price heads upward, toward the resistance found near the top of the previous troughs.
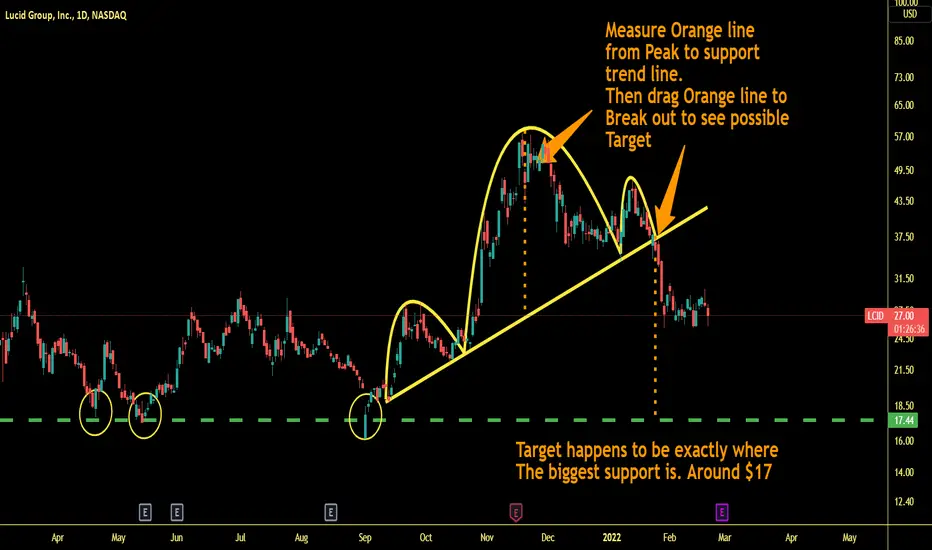
Measuring head and shoulders price target is simple.
You'd measure the peak of the head down to the neck line, and then drag it to the point where the stock breaks out from the pattern.
YFI/Usdt .......Head and shouldersHello friends, as a triangle should be formed in 4 hours in RSi , then the step is determined to be corrected again or finally completed. Bollinger bands also need to be modified for the lower band area and then we will wait to see if the correction will continue. I hope it ends because I am personally at a loss. And I will lower the average. Wait a minute, dawn is near and we will see the price of 11,000 in the long run. Always divide your assets into 4 parts and buy step by step. My advice to you

NASDAQ (strong buy) As you can see in the chart the market is having a Configuration of head and shoulders in a bearish trend therefore we should buy NQ now
in addition, we will have another confirmation when the green candle will break the support

Bitcoin Expires, can $37.3k support hold? or 29k BTC next?Howdy gang... plz thumbs up if you like the chart
quick update to show some simple price action and support levels while bitcoin broke down after a good push from the previous days US open
Clear head and shoulders, recent death cross techincals, long squeezes all contriubting to the bearish price right now, yet no need to panic...
if the level at 37.3K can hold, we may breathe a sigh of relief but if not then its open territory for bounces from the MA's or going as low as 29K, the previous years low
bulls will want to see this current level hold with RSI and indicators showing oversold on the daily - if price can get above 42k today, ill change my short term bearish vision
few differing fundamentals in favour and against, so hard to call in that area right now, lots of fear and panic, so time to be greedy, maybe go do some shopping!
as the cryptoride continues, don't get emotional and use this as a opportunity if you can
WHAT do YOU think? ....Hold at this level? 40k or towards 29k??? over the next week or so? Let us know below....

BTCUSD daily chart pattern analysishey every body check out my last price action bitcoin analysis
i want to show you guys the power full head and shoulder in the daily btc chart , and i highlight the neckline zone which is a powerful price action zone aswell , so we can see the valid break out clearly and the pullback ;) , i think price can fall down to the 30k $ price which is a best support area and test that areas for a valid support

BTC - 2 Head and Shoulders scenariosBTC has formed what looks to be a head and shoulders formation on the Daily, indicating more pain could be ahead for the OG crypto that's down 37% from it's peak earlier this year.
The typical way to trade a head and shoulders pattern is to sell when we see a break through the neckline, which is currently acting as support but a break of this level could see price drop to the previous key level around 30k.
That is, of course, if you consider the huge wick on December 4th down to the neckline to be a valid component this formation.
If we use a line chart, ignoring the lows of the day and just focusing in on the closes, it changes the formation completely. This gives us just a second touch of the neckline, with a right shoulder yet to form. If this is the real pattern forming, we could see a surge back to the ~52k level in the coming weeks.
The market is reaching a decision point, and price action driving us above or below this support level/neck line will give the indication of a short term trend we can jump on.

Meta End of CorrectionMeta (FB) has formed an inverse heads and shoulders pattern, indicating a short term trend reversal. Meta will continue on its way towards its fair value at around $500.

BROSBearish Head & Shoulders Pattern set up on BROS Notes on chart what to look for and how to possibly play the pattern .Sometimes these patterns will fail to break down if that happens i would look to get long above that green line as described on the chart

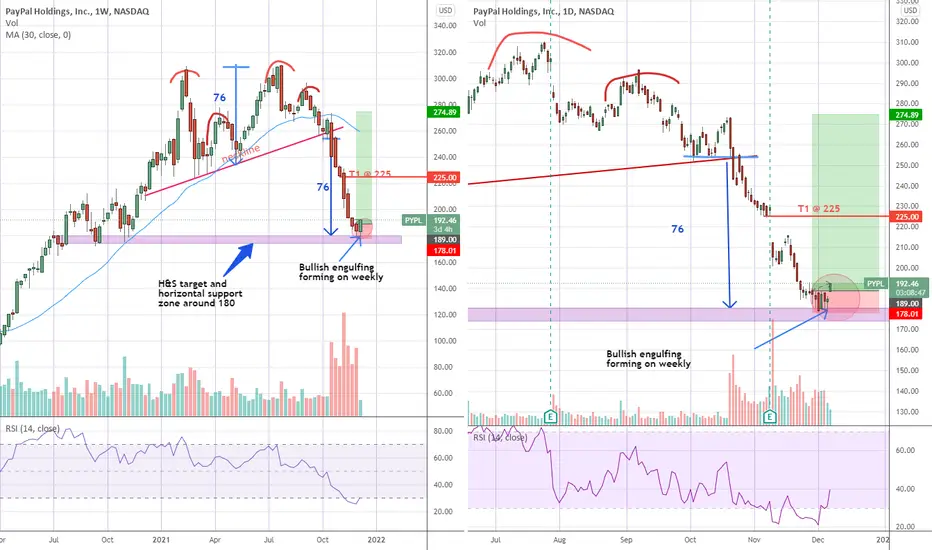
PYPL - could have bottomed outPYPL broke down from a messy Head & Shoulders formation of sorts (head-shoulder-head-shoulder) in Oct and had been trending down strongly since.
It eventually came down to about 180 on 1st Dec last week, which incidentally was it's H&S target and also a possible horizontal support zone here.
However we only see a decisive bounce off this level today, opening with a gap up, leading to the potential formation of a bullish engulfing candle on the weekly timeframe.
With a confluence of factors (H&S target, horizontal suppport and potentially bullish engulfing on weekly), I am fairly optimistic that it could have bottomed out.
I will venture a long today with initial stop stop slightly below $179. Will take partial profits around $225 (a gap fill) and protect remaining positions with trailing stops.
Disclaimer: TA is about improving our odds of a successful trade (not a guarantee). This is just my own analysis and opinion for discussion and is not a trade advice. Kindly do your own due diligence and trade according to your own risk tolerance and don't forget that money management is important! Thank you. Do give me a thumbs up if you agree. Feel free to let me know what you think! :)
USDZAR big move incoming !Hello everyone, I hope you all doing well.
I've been watching this pair for months now, it has respected technical price action very well so far, we had this huge heads and shoulders formation ( shown on chart ) in which we broke out yesterday successfully, I believe once we got here there is no going back.
* This is not a financial advice, use the idea with your own strategy and risk management *
I personally like this very much. check it out for yourself ;)
I'm also writing about most of crypto currencies;
Follow me on TRADINGview so you wouldnt miss out any updates.
Like if you think this was helpful and let me know on the comment section below.
* This is not a financial advice, use the idea with your own strategy and risk management *

HEAD and SHOULDER @ AUSCADHead and shoulder formation is clearly spotted on the pair, entries and exit are clearly marked on the chart. Let's see if our targets will suffice.
Please like and comment, also follow me for more

USDCAD NEXT TARGETS After entering shorts for the retracement move I will be targeting the area of 1.25000 atlest taking 80% profit then analysing price for the next move from around there. I'm looking for the trend to continue to the upside so price around 1.25000 will be key mid way through next week.

Head & Shoulders Pattern - Advanced AnalysisIn this series about chart patterns we previously discussed narrowing wedges patterns, explaining their identification rules, the measure rule associated with them, and various observations.
In this post, we will cover head & shoulders, inverse head & shoulders, and their complex counterpart. We will cover their identification rules, measure rules, and share some observations regarding these unique yet popular patterns.
The topics covered in this post are mostly based on the work of Bulkowski on chart patterns (1).
1. Head And Shoulders
The head and shoulder pattern also referred to as Head-and-Shoulders Tops by Bulkowski, is a bearish reversal structure commonly found in uptrends, characterized by a series of three maxima with the center maxima higher than the other two.
The first maxima is denoted as "Left Shoulder", the second maxima (the highest one in the formation) is denoted as "Head", and the third maxima is denoted as "Right Shoulder". The volume on a head and shoulders formation should be decreasing over time.
Bulkwoski points out that symmetry can play an important role in the validity of an H&S pattern.
1: H&S = Left Shoulder < Head > Right Shoulder
2: Left Shoulder ≈ Right Shoulder
The first and second maxima are followed by two minima, the line connecting these two-point form the "neckline". Price breaking the neckline downward is a bearish signal (note that a low volume breakout is not indicative of a potential failure).
Ongoing H&S on PGAL daily, waiting for the price to reach the neckline.
2. Inverted Head And Shoulders
The inverted head and shoulder pattern also referred to as Head-and-Shoulders Bottoms by Bulkowski, is a bullish reversal structure commonly found in downtrends, characterized by a series of three minima with the centre minima lower than the previous two.
The first minima is denoted as "Left Shoulder", the second minima (the lowest one in the formation) is denoted as "Head", and the third minima is denoted as "Right Shoulder". Like with a regular H&S, the volume should be decreasing over time.
We can see it's simply a regular H&S pattern, but inverted.
1: Inverted H&S = Left Shoulder > Head < Right Shoulder
2: Left Shoulder ≈ Right Shoulder
The first and second minima are followed by two maxima, the line connecting these two-point form the "neckline". Price breaking the neckline upward is a bullish signal (note that a low volume breakout is not indicative of a potential failure).
Inverted H&S on MTSI daily.
3. Complex Variations
Bulkowski presents two complex variations to the H&S and inverted H&S patterns. These complex variations are similar to the regular ones but have the particularity of having multiple shoulders on each side or multiple heads.
Inverted complex H&S on ARKW daily.
4. Measure Rule
The measure rule for head and shoulders formations allows the determination for the level of taking profits and stop losses after a breakout of the neckline.
In the case of a regular H&S, the take profit should be set at the breakout point minus the height between the formation head value and the neckline value where the head is located.
The same applies to inverted H&S, the take profit should be set at the breakout point plus the height between the formation neckline value where the head is located and the formation head value.
In the case of a complex dual-head H&S formation, the head value that should be selected is the lowest one.
5. Observations
Head and shoulders formations can sometimes be encountered within diamonds formations.
Osler identifies head-and-shoulders trading as a type of noise trading and points out that the immediate price effect of head-and-shoulders trades disappears slowly but completely over the subsequent two weeks (2).
Caginalp and Balevonich found that head and shoulders patterns can be obtained as a consequence of a single group of investors with identical motivations and assessment of the value of the financial instrument (3).
7. References
(1) Bulkowski, T. N. (2021). Encyclopedia of chart patterns. John Wiley & Sons.
(2) Osler, C. (1998). Identifying Noise Traders: The Head-and-Shoulders Pattern in U.S. Equities. Federal Reserve Bank of New York Research Paper Series.
(3) Caginalp, G., & Balevonich, D. (2003). A Theoretical Foundation for Technical Analysis. Capital Markets: Market Microstructure eJournal.

XAGUSD, 4h analysis Hello everyone, this is my first idea which I'm sharing, its just my opinion and I'm not much of an expert here so don't rely on it much; less being said lets get into it.
So I have pretty much labeled everything on chart, but to explain it more carefully I will write everything down.
we have been in a long down trend which we broke out and price been rising since, by hitting the neckline resistance zone, we had this correction which can also be considered as pull back to breakout zone.
as you can see there is a good support zone below the neckline which price showed reaction to and bounced off a little bit and stopped us from going further down.
I believe the bigger uptrend is starting and we are about to see some rises in price in near future.
if price continues to go up to retest the neckline, it will complete a heads and shoulders trend reversal pattern.
with that being said, my tp zones will be :
TP 1 : 23.45
TP 2 : 24.13
TP 3 : 24.58
Let me know what yall think in comment section below and good luck in your trades.

Short $ROKU CMP $315Short $ROKU CMP $315. Repeating Head and shoulder pattern from past. Potential downside target is $270-275 area.

Silver Hi
In advance assuming that SILVER is doing a INVERSE HEAD & SHOULDER as of now this pattern is in formation so still we have to wait & watch in silver for big bull run in it or if it start trading above 24.82 then it means silver moving toward 28.00 level.
Make a note that this courter is not good for short......wait & watch to go long in it.
Enjoy....!!!

Common pattern?De ja vu all over again with this emerging pattern on AUDNZD. Big rewards possible here if you can get in early enough. Let's see what comes next week.

GBPJPY Heads&Shoulders [SHORT]FX:GBPJPY
So Tntsunrise spotted this on 6 Aug and made a publication 'bout this earlier last month wich I'll add on the related ideas. The thing is, I've happened to see lot of times these goodbye kiss. Since one of the first patterns you learn are the Heads & Shoulders lots of the time now a days we see the pattern on the right shoulder and we tend to take it from there #nodisipline and take profit right on the neck. Well since more and more and more people keep doing that, a pattern has started to form. I call it The Goodbye Kiss (well lots of other person call it like that, I just happened to pick it up from a JPmorgan trader last year).
The thing is sometimes that develop in a triangle pattern so one has to be careful, still is most certain that price will return to the neck and we can take advantage of that. Also from there might develop the Head & shoulder pattern like normally and go straight to hell... But also it can turn into a triangle wich is also easy to trade.
