GE Healthcare Technology | GEHC | Long at $62.25GE Healthcare Technology $NASDAQ:GEHC. An aging and unhealthy population will only create an increased need for healthcare imaging services. Add AI to the diagnostic mix, and imaging will be imperative for routine health maintenance and screening. With a P/E of 15x, debt-to equity of 1x, earnings forecast growth of 8.36% per year, and bullish analyst ratings, this could be a good value play for the patient.
Thus, at $62.25, NASDAQ:GEHC is in a personal buy zone. Further drops are possible if trade wars make imaging materials/technology difficult to obtain, but that general statement applies to the whole market at this time...
Targets:
$70.00
$78.00
Healthcarestocks
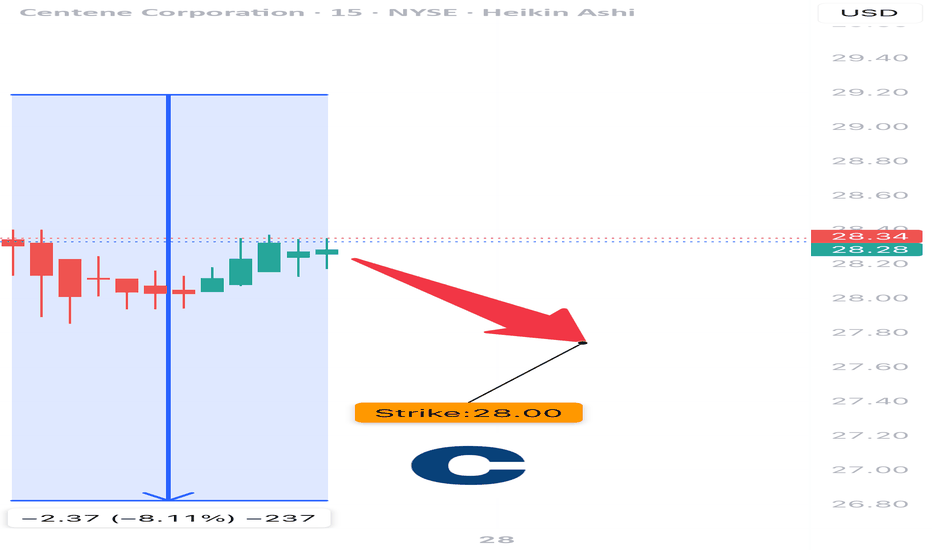
CNC EARNINGS TRADE IDEA – JULY 25, 2025
⚠️ CNC EARNINGS TRADE IDEA – JULY 25, 2025 ⚠️
💊 Healthcare Pressure + Missed Guidance = Bearish Setup for AMC
⸻
📉 Sentiment Snapshot:
• 🚨 Last quarter: Broke 100% beat streak
• 📉 Thin margins + rising medical costs
• 💬 Analyst bias: Neutral to Negative
• 🧮 Fundamentals Score: 4/10
⸻
📊 Technical Breakdown:
• 📍 Price: $26.76 (below 50DMA of $48.12)
• 📉 RSI: 32.4 = Oversold but still trending down
• 🛑 Testing 52W Low @ $26.25
• 🔻 Volume = 2.67x Avg → Heavy Distribution
⸻
🧠 Options Flow Insight:
• 🛡️ Heavy institutional put activity @ $28
• ⚠️ Weak call interest = bearish skew
• 📉 IV crush possible post-earnings
• Options Score: 6/10
⸻
🧬 MACRO CONTEXT:
• Rising sector costs crushing providers
• VIX < 15 = complacent market, sharp reactions possible
⸻
✅ TRADE IDEA:
🎯 CNC $28 PUT (0DTE)
💵 Entry: $0.20
🎯 Profit Target: $0.60 (3x 💥)
🛑 Stop Loss: $0.10
📅 Expiry: Today (July 25, 2025)
📈 Confidence: 70%
⏰ Entry Timing: Before earnings (AMC)
📆 Close trade within 2 hours post-earnings
⸻
📍 RISK REMINDER:
• Theta decay will be brutal if flat
• Watch for volatility and potential IV crush
• Ideal exit zone = stock retests $26 support
⸻
💡 Weak guide = collapse risk.
👍 Like & repost if you’re tracking CNC puts tonight!
#CNC #EarningsPlay #PutOptions #HealthcareStocks #OptionsTrading #0DTE #EarningsTrade #TradingView #SPX #GammaRisk
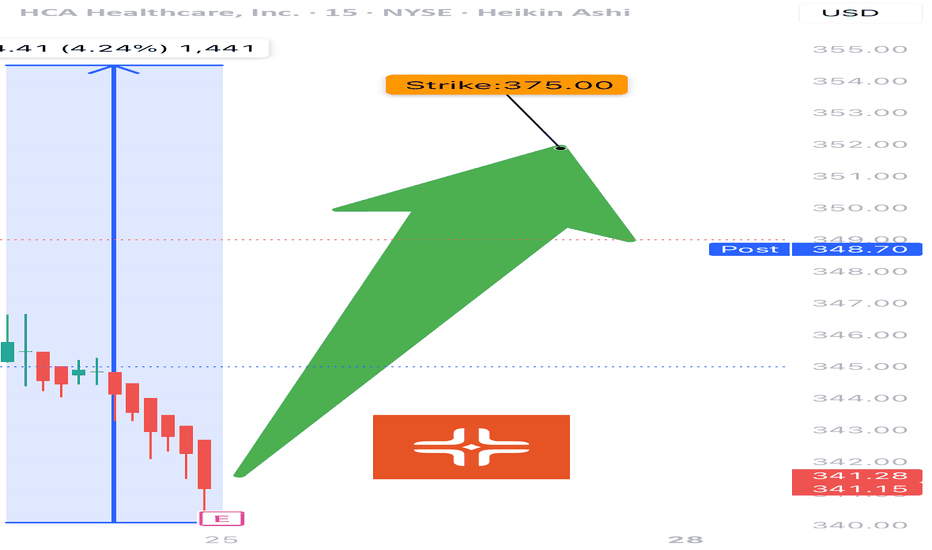
HCA EARNINGS TRADE (07/24)
🚨 HCA EARNINGS TRADE (07/24) 🚨
🏥 Healthcare with earnings tonight after close — high-upside setup brewing.
🧠 Quick Breakdown:
• 📊 Revenue Growth: +5.7% (stable, defensive sector)
• 💸 Margins: Operating 15.6%, EBITDA 19.9% = efficient and strong
• 🧠 Beat Rate: 75% with 6.7% avg surprise → credible upside
• 📉 RSI: 22.5 → OVERSOLD and primed for bounce
• 💬 Whisper sentiment strong from sector peers (e.g., Tenet)
• 🔥 Analysts target: $391.54 → 13.8% upside
💥 TRADE SETUP
🟢 Buy HCA $375 Call exp 8/15
💰 Entry: $3.90
🎯 Target: $11.70 (200–300%)
🛑 Stop: $1.95
📈 Confidence: 73%
⏰ Entry: Before Close Today (Pre-Earnings)
📆 Earnings: Today After Market (AMC)
📊 IV Rank: 0.60 → fair pricing
📉 Expected Move: ~5%
⚠️ RSI this low + sector strength = earnings bounce candidate. Watch the $375 breakout zone. 🎯
#HCA #EarningsPlay #OptionsTrading #HealthcareStocks #UnusualOptionsActivity #CallOptions #TradingView #DayTrading #OversoldBounce #EarningsSeason
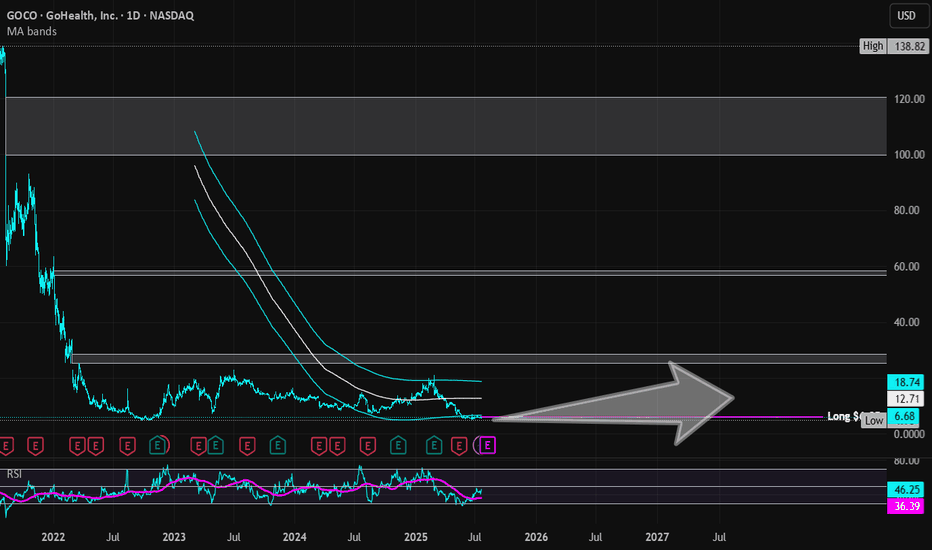
GoHealth | GOCO | Long at $6.05GoHealth NASDAQ:GOCO is a health insurance marketplace and Medicare-focused digital health company that uses a technology platform with machine-learning algorithms to match consumers with Medicare plans (Advantage, Supplement, Part D) and individual health insurance. Understandably, a lot of investors aren't bullish on this stock given all of the healthcare provider and services headwinds. However, if the company can overcome some of their financial issues and bankruptcy risk (debt-to-equity: 1.6x; quick ration of 1.1x, Altman's Z score of .3x), it may dominate the health insurance marketplace (but do not hold my word to that...). This is a purely speculative play at this point - those who are risk averse should absolutely stay away.
What truly caught my eye with this stock is that it is consolidating nicely within my historical simple moving average area. Often, but not always, this leads to a future change in momentum and propels the stock higher. It doesn't signal a bottom and there may be more room for it to plummet, but it is a bullish (overall) sign that shares are likely being accumulated by investors. Given the need for health insurance, particularly Medicare as the US / baby boom population ages, this is a company that may prosper IF it can get its financials in order.
Thus, at $6.05, NASDAQ:GOCO is in a personal buy zone (but very risky). Further declines may be ahead before a stronger move up.
Targets into 2028:
$10.00 (+64.5%)
$12.00 (+97.4%)
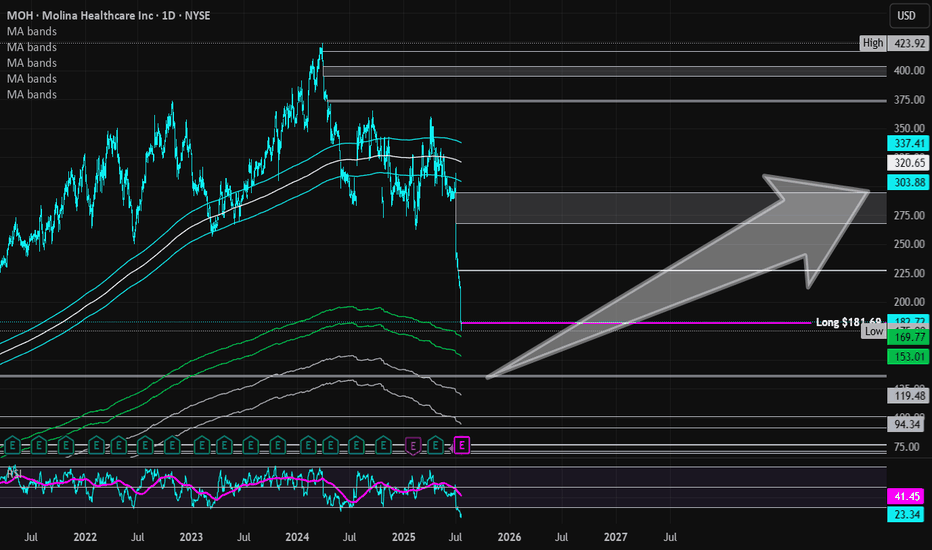
Molina Healthcare | MOH | Long at $181.69Healthcare providers and services are at a major discount right now: and may be discounted even more this year. I am personally buying and long-term holding the fear, knowing the baby boom generation is going to utilize our healthcare system at a rate unseen in modern times. While the price discounts are valid "right now" given the current political administration's cuts, long-term it is far from valid... The strategy I am using with healthcare stocks ( NYSE:MOH , NYSE:CNC , NYSE:UNH , NYSE:ELV , etc) is cost averaging: not buying one single large position in an effort to predict bottom but buying smaller positions over time to create a cost average "near" bottom. If you are a day trader or want a quick swing in healthcare, I don't think it's going to happen for a bit. But those not entering in the coming months / year will likely miss out on a very large healthcare boom - especially when AI truly enters the picture in this sector...
Fundamentally, Molina Healthcare NYSE:MOH is a very strong company. Low debt-to-equity (.9x), P/E of 8.8x, quick ratio of 1.7x, $41 billion in revenue in 2024. Yes, there will be issues in the near-term due to Medicaid and other funding cuts. But long-term, this sector is primed to benefit from an aging population.
So, while NYSE:MOH is in a personal buy zone at $181.69, I don't think this is necessarily bottom. I anticipate this stock to drop even further, eventually closing the daily price gap at $135.00. My next buys are in the $150's and $130's, thus cost averaging into a larger position. For true value investors, those prices and anything below is a steal. Today's negative healthcare sector noise is loud, but it does not represent the future.
Targets into 2028:
$226.00 (+24.3%)
$290.00 (+59.6%)
Elevance Health | ELV | Long at $286.00What are seeing in the healthcare and health insurance provider industry right now is destruction before a once-in-a-lifetime boom. The baby boomer generation is between 60 and 79 right now and the amount of healthcare service that will be needed to serve that population is staggering. Institutions are crushing them to get in - it's just near-term noise, in my opinion. My personal strategy is buy and hold every healthcare opportunity (i.e. NYSE:CNC , NYSE:UNH , NYSE:HUM etc).
Elevance Health NYSE:ELV just dropped heavily due to lower-than-expected Q2 2025 earnings, a cut in full-year profit guidance from $34.15-$34.85 to ~$30 EPS, and elevated medical costs in Medicaid and ACA plans. It's near-term pain (may last 1-2 years) which will highly likely lead to long-term growth. The price has touched my historical simple moving average "crash" band. I would not be shocked to see the price drop further into the $260s before a rise. However, the near-term doom could go further into the year. I am anticipating another drop to the "major crash" simple moving average band into the $190s and $220s to close out the remaining price gaps on the daily chart that occurred during the COVID crash. Not to say it will absolutely reach that area, but it's locations on the chart I have for additional buys.
Thus, at $286.00, NYSE:ELV is in a personal buy zone (starter position) with more opportunities to gather shares likely near $260 before a bounce. However, if the market or healthcare industry really turns, additional buys planned for $245 and $212 for a long-term hold.
Targets into 2028:
$335.00 (+17.1%)
$386.00 (+35.0%)
Agilon Health | AGL | Long at $2.36Reentering this trade (original: )
Agilon Health NYSE:AGL
Pros:
Revenue consistently grew from 2019 ($794 million) to 2024 ($6.06 billion). Expected to reach $9.16 billion by 2028.
Current debt-to-equity ratio 0.07 (very low)
Sufficient cash reserves to fund operations and strategic initiatives
Strong membership growth (659,000 in 2024, a 38% year-over-year increase)
Recent insider buying ($2 - $3) and awarding of options
Cons:
Rising medical costs - currently unprofitable and not forecast to become profitable over the next 3 years
Medicare Advantage Membership issues with the new political administration
No dividend
It's a gamble and I think it's a possibility this could drop near $1 in the near-term due to the Medicaid changes/fear... regardless, long-term, personal buy-zone at $2.36.
Targets in 2027
$3.70 (+56.8%)
$5.25 (+122.5%)
Figs Inc | FIGS | Long at $5.24Figs Inc $NYSE:FIGS. Technical analysis play first, fundamentals second.
My selected historical simple moving average lines have converged with the stock price, which often leads to sideways trading and a reversal in the downward trend (i.e. future price increase). The downward trend is flattening, but that doesn't mean post-earnings drop to $1.50-$2.00 isn't out of the question...
The FIGS brand is growing within the healthcare world with significant opportunities overseas. While economic headwinds may impede near/medium-term growth, revenue is anticipated to grow into 2027. EPS is expected to rise from 0.01 in 2024 to 0.20 by 2027. While this is not a "value" play and there is high risk for rug pulls, something may be brewing within the chart for a move up. Tread lightly, however...
Targets
$6.00
$6.40
$7.00
$8.00
Centene Corp | CNC | Long at $35.00Centene Corp NYSE:CNC is a healthcare enterprise providing programs and services to under-insured and uninsured families, commercial organizations, and military families in the U.S. through Medicaid, Medicare, Commercial, and other segments. The stock dropped almost 40% this morning due to recent challenges, such as a $1.8B reduction in 2025 risk adjustment revenue and rising Medicaid costs (leading to withdrawal of 2025 earnings guidance). However, the company has a book value near $56, debt-to-equity of 0.7x (healthy), a current P/E of 5x, and a forward P/E of 9x.
It may be a few years before this stock recovers. But the price has entered my "crash" simple moving average area (currently between $32 and $36) and there is a price gap on the daily chart between $32 and $33 that will likely be closed before a move higher. Long-term, and potentially a new political administration, new life may enter this stock once again as the baby boom generation requires more healthcare services. But holding is not for the faint of heart...
Thus, at $35.00, NYSE:CNC is in a personal buy zone with a likely continued dip into the low $30s or high $20s before a slow move higher (where I will be accumulating more shares). Full disclosure: I am also a position holder in the $60s and cost averaging down.
Targets into 2028:
$45.00 (+28.6%)
$54.00 (+54.3%)
Oscar (OSCR) – Tech-Enabled Healthcare with Margin Momentum Company Snapshot:
Oscar NYSE:OSCR Health is a technology-focused health insurer leveraging data and digital platforms to deliver affordable, personalized care. Its platform-centric model improves member experience, cost control, and care outcomes—setting it apart in a highly regulated sector.
Key Catalysts:
Steady Execution Under Proven Leadership 🧠
CEO Mark Bertolini (ex-Aetna) brings credibility and strategic clarity, reinforcing investor trust in Oscar’s long-term viability.
Focus remains on operational discipline, risk management, and scalable infrastructure.
2025 Guidance Reaffirmed 📊
Following a solid quarter, Oscar reaffirmed full-year 2025 guidance, projecting margin expansion and sustained growth despite sector headwinds.
Medical loss ratio (MLR) held steady at 75.4%, absorbing a $31M prior-period hit—showing resilience in cost containment.
Robust Financial Flexibility 💰
With $1B+ in free cash flow, Oscar is well-positioned for:
Organic growth in new markets
Potential share buybacks or dividends
Continued investment in digital infrastructure
Investment Outlook:
Bullish Entry Zone: Above $17.00–$17.50
Upside Target: $32.00–$33.00, supported by margin stability, capital strength, and smart execution.
🩺 Oscar is transforming health insurance from reactive to predictive—backed by tech, discipline, and capital strength.
#OscarHealth #OSCR #HealthTech #InsurTech #DigitalHealth #MarkBertolini #MedicalLossRatio #FreeCashFlow #TechEnabledCare #HealthcareStocks #Bullish #ValueDelivery #HealthInnovation
KALH Upside Potential?Looking purely off of KALV with the range that it has been in and the healthcare sector that it is a part of. IF healthcare sector will continue to rebound, this stock could potentially rebound as well back to the $13-$15 range. It is currently sitting right below the 200 day moving average and seems to be holding support there. I'm considering a stop loss just below $11 since this stock can move $0.83 a day with a trailing stop loss of 9%. I see it is valued under pressure of the VWAP that is currently at $12.20. This could be a beautiful continuation of the long trend that it has been in since January 2025 with an entry on this pullback. RSI looks like it is exhausting out with oversold conditions at 37.30. I like the inverted hammer that was placed and the fact that we have 3 days worth of support on the 200 day moving average.
On the fundamentals, this company is a cash king in the fact they have more cash than debt. Market Cap 567.26M vs. Enterprise Value 420.76M and Insider ownership is key: Insider Ownership: 22.58%. All of which show that management are in charge and have a vision.
As always, do your own research and due diligence. Not trading advice.
eHealth | EHTH | Long at $4.22eHealth NASDAQ:EHTH , the largest online private health insurance marketplace, may be undervalued. The book value is listed around $19 a share and it has a debt-to-equity of 0.07x (healthy), a quick ratio of 2.5 (strong liquidity, can cover liabilities), growing revenue since 2021 (over $500M in 2024), and insiders have recently bought shares/awarded options. However, profitability is still a concern, but the company is expected to be profitable by 2026. With the US's aging population and the need for affordable healthcare coverage, eHealth *may* standout as a major insurance marketplace... but time will tell.
From a technical analysis perspective, the stock price is near the bottom of its historical simple moving average. I do not doubt, however, that the stock may slip to cover the small price gap between $3.09 and $3.23 (which will be another entry point if fundamentals do not change). This stock may trade sideways for some time. But it has a 27M float and as we saw in 2014 and 2020, it can REALLY get going if buyers see the opportunity...
Thus, at $4.22, NASDAQ:EHTH is in a personal buy zone with more opportunity potentially near $3 in the future.
Targets:
$6.00 (+42.2%)
$8.00 (+89.6%)
Regeneron Pharmaceuticals | REGN | Long at $502.28Regeneron Pharmaceuticals NASDAQ:REGN stock dropped more than 17% today due to mixed Phase 3 trial results for itepekimab, a potential COPD drug. However, the company has an extensive drug pipeline, raked in over $14 billion last year, and is currently trading at a price-to-earnings of 15x. Debt-to-equity is 0.09x (extremely healthy) and earnings are forecast to grow 7.5% per year. While 2025 is anticipated to be its "worst" earnings year, the outlook through 2028 looks like steady growth in revenue and cash flow.
From a technical analysis view, the stocks entered my "crash" simple moving average zone today (currently between $466 and $502). More often than not, this area signals a bottom in the near-term, but it's not guaranteed. I wouldn't be surprised if the $450s-$460s get hit before a reversal if the market shifts negatively - which will be another entry for me. If it moves into my "major" crash zone in the $300s to close more gaps on the daily chart, I will be piling into this stock heavily (like I did with NYSE:UNH ) for a longer-term hold - of course, unless fundamentals change. I'm going to keep my target small unless there is a "major crash" and eye the closing of the nearest price gap on the daily. There is another between $883-$914...
Targets:
$590 (+17.5%)
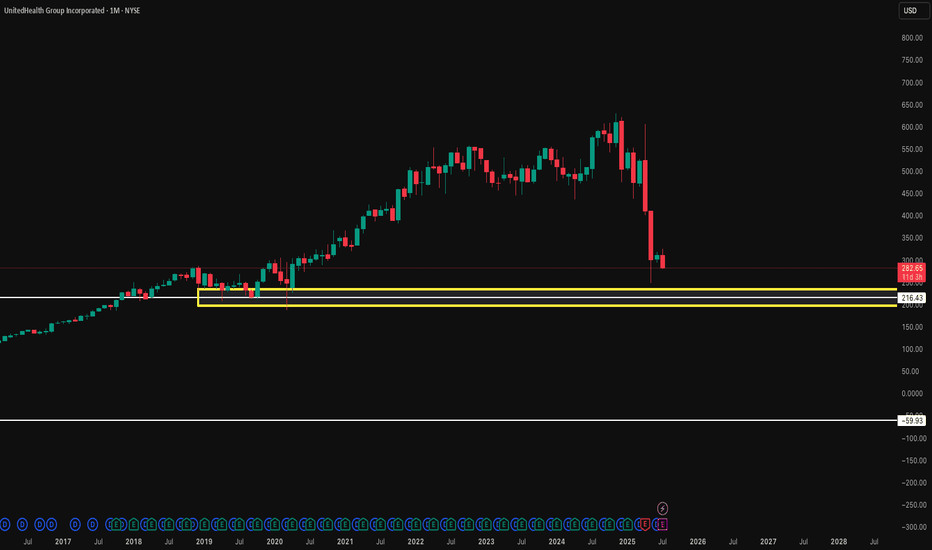
UnitedHealth Group | UNH | Long at $323.00UnitedHealth Group NYSE:UNH currently has a P/E near 15x, steady rising revenue (2024 = $400+ billion), EPS of 6.24x, dividend of 2.2%, and earnings are forecast to grow by 10.8% per year. The stock, however, has plummeted recently due to negative news, rising healthcare costs, CEO changes, and suspension of 2025 outlook. Every company has bumps, but I view solid companies like NYSE:UNH as pure opportunities for long-term investment - especially with America's aging population.
From a technical analysis perspective, the stock price has entered my "crash" simple moving average zone (which currently extends down near $307.00). Personally, this is the zone I am starting a position due to the odds of a future bounce from here. However, I am very aware that there is an open price gap near $265.00 that may get filled this year or early next. I could see a bounce in my crash zone to bring in the bulls and then a drop to that level to heighten the fear. That is another area I plan to grab more shares and build a strong position. But, in case it doesn't extend that low, I have started a position at $223.00, with future investments near $307.00 and below. I doubt this will be a quick turnaround stock - patience is where money is made.
Targets (into 2028):
$375.00
$475.00
$580.00
Acadia Healthcare Company | ACHC | Long at $21.98Acadia Healthcare's NASDAQ:ACHC stock has fallen nearly -76% in a year, primarily due to weak 2024 results, missed revenue and EPS expectations, and a soft 2025 revenue guidance. Ongoing federal investigations into billing practices and lawsuits have further eroded investor confidence. However, it is currently trading at a price-to-earnings ratio of 7.42x and earnings are forecast to grow 7.07% per year. The profitable company is trading at a good value compared to other healthcare companies. Debt-to-equity is relatively low (0.64x), but legal risks (DOJ probe, lawsuits) strain margins.
The stock has entered my "major crash" simple moving average territory and there is a lot of downward / selling pressure. But, more often than not, this area (which... I caution... still extends down near $16) can often signal a temporary or longer-term bottom. Personally, this is a buy area ($16-$21) even if it turns into a short-term bounce in 2025. But I believe the overall market moves in the S&P 500, etc. will guide this stock more than anything at this point (unless more bad news about the company emerges).
One thing to note is that there are open price gaps on the daily chart near $17, $10, and $8. These gaps, which often (but not always) get closed in the lifetime of a stock, are a potential signal for further declines - at least at some point. There could be a drop near $16, then a $10-$20 bullish price increase after that, followed by more declines (trapping investors). Time will tell, but NASDAQ:ACHC is currently attractively valued. From a technical analysis standpoint, it is in a personal "buy zone", even if purely for a swing trade.
Targets:
$27.00
$33.00
$39.00
HCA Healthcare | HCA | Long at $299.00NYSE:HCA Healthcare: P/E of 13x, earnings are forecast to grow 6.01% per year; earnings have grown 10.6% per year over the past 5 years, and trading at good value compared to peers and industry.
From a technical analysis perspective, it dipped to my selected historical simple moving average area and may represent a buying opportunity to fill the daily price gap up to $394.00. Thus, NYSE:HCA is in a personal buy zone at $299.00.
Target #1 = $324.00
Target #2 = $362.00
Target #3 = $394.00
$UNH: UnitedHealth Group – Healthcare Hero or Reform Risk?(1/9)
Good evening, everyone! 🌙 NYSE:UNH : UnitedHealth Group – Healthcare Hero or Reform Risk?
With UNH at $505.69, post-7% drop, is this healthcare giant a safe bet or a reform casualty? Let’s diagnose! 🔍
(2/9) – PRICE PERFORMANCE 📊
• Current Price: $ 505.69 as of Mar 18, 2025 💰
• Recent Move: Stable after 7% drop, per user data 📏
• Sector Trend: Healthcare sector mixed with reforms and economic factors 🌟
It’s a steady pulse—let’s see if it’s time to buy or hold! ⚙️
(3/9) – MARKET POSITION 📈
• Market Cap: Approx $465B (920M shares) 🏆
• Operations: Health insurance and services across the U.S. ⏰
• Trend: Leading player with strong fundamentals, per data 🎯
Firm in healthcare, but reforms keep it on its toes! 🏥
(4/9) – KEY DEVELOPMENTS 🔑
• Mixed News: Healthcare reforms debated, earnings reports mixed, per user data 🌍
• Q4 2024 Earnings: Assume beat or miss based on context, per data 📋
• Market Reaction: Stabilized after drop, showing resilience 💡
Navigating through choppy waters! 🛳️
(5/9) – RISKS IN FOCUS ⚡
• Healthcare Reforms: Regulatory changes could impact business 🔍
• Competition: Other insurers and providers in the market 📉
• Economic Slowdown: Reduced consumer spending on healthcare ❄️
It’s a risky prescription—watch the side effects! 🛑
(6/9) – SWOT: STRENGTHS 💪
• Market Leader: Dominant in U.S. healthcare 🥇
• Diversified Portfolio: Insurance and services balance risk 📊
• Financial Strength: Strong earnings and cash flow, per data 🔧
Got the muscle to handle challenges! 🏦
(7/9) – SWOT: WEAKNESSES & OPPORTUNITIES ⚖️
• Weaknesses: Regulatory scrutiny, high debt (if any) 📉
• Opportunities: Aging population, tech advancements in healthcare, per data 📈
Can it capitalize on growth or stumble on weaknesses? 🤔
(8/9) – POLL TIME! 📢
UNH at $505.69—your take? 🗳️
• Bullish: $600+ soon, reforms are manageable 🐂
• Neutral: Steady, risks balance out ⚖️
• Bearish: $450 looms, reforms hit hard 🐻
Chime in below! 👇
(9/9) – FINAL TAKEAWAY 🎯
UNH’s $505.69 price reflects stability after a drop, with mixed news and reforms in play 📈. DCA-on-dips could be a strategy to manage volatility. Gem or bust?
Zoetis | ZTS | Long at $156.94Zoetis NYSE:ZTS , the largest global animal health company, generated more than $9 billion in revenue in 2024 and earnings have grown 9.3% per year over the past 5 years. Free cash flow for FY2024 was over $2.2 billion. Dividend consistently raised every year for the past for years (currently 1.28%). The growth of the company isn't expected to slow any time soon, and I believe the animal health care market will grow right alongside the human health care market - if not potentially faster (people love their pets).
Thus, at $156.94, NYSE:ZTS is in a personal buy zone. There may be some near-term risk with the potential for a daily price-gap close near $136.00, but I personally view that as an even better buy opportunity (unless fundamentals change).
Targets
$170.00
$180.00
$200.00
Potential outside week and bullish potential for OPTEntry conditions:
(i) higher share price for ASX:OPT above the level of the potential outside week noted on 17th January (i.e.: above the level of $0.85).
Stop loss for the trade would be:
(i) below the low of the outside week on 13th/16th January (i.e.: below $0.725), should the trade activate.
$TLSA Poised For An 85% Surge Amidst Alzheimer’s Drug BoomTiziana Life Sciences Ltd (NASDAQ: NASDAQ:TLSA ), a stock that has been under the radar, is now showing strong signals of a potential breakout. With a falling wedge pattern and a bullish RSI reading, coupled with the growing interest in Alzheimer’s drug development, NASDAQ:TLSA is positioning itself as a stock to watch in 2025.
Technical Analysis
As of the time of writing, (NASDAQ: NASDAQ:TLSA ) shares are down 5.52%, but this dip is likely a temporary setback. The stock’s Relative Strength Index (RSI) stands at 52.77, which, despite the recent decline, suggests that bullish momentum is building. The RSI is neither overbought nor oversold, indicating a healthy consolidation phase before a potential upward move.
The most Intriguing technical indicator is the falling wedge pattern that has formed since January 23. This pattern is typically a bullish reversal signal, especially after a prolonged downtrend. The falling wedge is characterized by converging trendlines that slope downward, with the price making lower highs and lower lows. As the pattern nears its apex, the likelihood of a breakout increases.
For NASDAQ:TLSA , the immediate support lies at the 78.6% Fibonacci retracement level. A pullback to this zone could serve as an excellent buying opportunity for traders, as it aligns with recent resistance-turned-support levels. On the upside, the 38.2% Fibonacci retracement level is acting as a pivot point. A breakout above this level could ignite a bullish rally, potentially propelling the stock toward an 85% surge.
Alzheimer’s Drugs – The Next Big Market Opportunity
While the technical setup is compelling, the story behind NASDAQ:TLSA is equally intriguing. The Alzheimer’s drug market is emerging as the next big opportunity, drawing parallels to the obesity drug boom led by companies like Eli Lilly and Novo Nordisk. With an estimated market value of $13 billion by 2030, according to Bloomberg Intelligence, the race to develop effective Alzheimer’s treatments is heating up.
Companies like Biogen Inc., Eli Lilly & Co., Novo Nordisk, and Roche AG are investing billions into Alzheimer’s research. Recent developments have shown promise, with two new drugs—Leqembi (developed by Biogen and Eisai) and Kisunla (by Eli Lilly)—already approved in the U.S. These drugs target amyloid plaques in the brain, slowing the progression of the disease in its early stages. However, they are not without challenges, as side effects like brain bleeding and swelling have been reported.
For (NASDAQ: NASDAQ:TLSA ) stock, this presents a unique opportunity. If the company is involved in Alzheimer’s research or has partnerships with major pharmaceutical players, it could benefit significantly from the growing interest in this sector. Even if NASDAQ:TLSA is not directly involved, the overall bullish sentiment in the healthcare and biotech sectors could provide a tailwind for the stock.
Additionally, any positive developments in Alzheimer’s drug trials or approvals could act as a catalyst for NASDAQ:TLSA , driving the stock higher. As Gregoire Biollaz, senior investment manager at Pictet Asset Management, noted, “It could be a year where we also see a bit more clarity in terms of traction for the drugs that are approved so far.”
Conclusion
NASDAQ: NASDAQ:TLSA is at a critical juncture, with both technical and fundamental indicators pointing to a potential surge. The falling wedge pattern suggest that the stock is building momentum, while the growing interest in Alzheimer’s drugs provides a strong fundamental catalyst. For investors seeking the next big opportunity, NASDAQ:TLSA could be the stock to watch in 2025.
As always, investors should conduct their own due diligence and consider their risk tolerance before making any investment decisions. However, with an 85% surge on the horizon, NASDAQ:TLSA is undoubtedly a stock worth keeping on your radar.
Teladoc Health | TDOC | Long at $9.91Teladoc Health NYSE:TDOC - Initial position started at $9.91 with the potential for the price gap in the $7's to be closed in the near future (likely another entry there unless fundamentals change)
Pros:
User base of over 90 million and growing
Revenue grew from $555 million in 2019 to $2.6 billion through Q3 of 2024
Positive free cash flow since 2021
Low debt (debt to equity ratio around 1x)
AI integration and partnership with Amazon and Brightline
Historical simply moving average is approaching price, which often leads to a jump or change in downward momentum in the longer-term
Cons:
Currently unprofitable and not forecast to become profitable over the next 3 years
Lots of insider selling and exercising of options
No dividend
Daily price gap in the $7 dollar range which may close prior to move up
Targets through 2027 :
$14.20
$20.00
$27.00
$35.00
$55.00 (long-term, positive outlook)

