Hedera Hashgraph New High, Great NewsHedera Hashgraph (HBARBTC) hit a new high today compared to the 12th February, this is great news for the altcoins market.
When the stronger altcoin pairs continue to grow, the ones that are late to move will surely follow.
On the chart above we have the next target mapped as well as all the support levels.
Magenta is up while blue is down.
The way the chart is looking right now points to additional growth.
Conditions for change
If prices close below EMA10, then we can expect a drop.
Namaste.
Hederahashgraph

Hedera Hashgraph Continues | Chart Fully MappedHBARBTC (Hedera Hashgraph) resumed its growth and is now gaining in bullish momentum... Let's see what we have here.
On the chart above, I marked the most important resistance levels based on Fibonacci proportions with magenta dashed lines.
I used the color blue for support levels (dashed blue lines for support).
The MACD is showing a bullish cross.
The RSI is really strong and trending up.
If this continues HBARBTC can easily continue growing.
Conditions for change
If HBARBTC already peaked today and prints a lower high (1,2), this can lead to a retrace... Depending on how this retrace is handled we can map the next move.
Remember to hit LIKE if you want to see constant updates for this altcoin pair.
Thanks a lot for reading.
Namaste.

Is HBAR doing the same as LINK did?HBAR had a golden cross when the Google News came out. Since the push, it retraced, only to hit the Golden Cross Emas.
The uptrend line looks exactly the same as the one on LINK (both uptrend lines to be drawn ignoring the false escape early on the uptrend).
LINK had the support from the big W which you can see from your proper eye. HBAR had the support from recent support line / resistance wick.
The targets could be way higher than I expected them to be at first.

HEDERA HASHGRAPH GOOGLE PARTNERSHIP Based on Wyckoff logic we should be in the middle of the distribution phase and might test the buying climax.
Then I expect the Mark Down phase since COINBASE:BTCUSD might pump,
whales would prefer dumping sh*tcoins and ride the BTC train. Then come back for higher profits and cheaper prices.
I have seen this happening with other young coins, so we might be able to reload our bags with more coins.
Just an idea. Take care & enjoy your days!

HBARUSDT - 20-30% ExplosionI expect this one to move at least 20-30% to around 0.046-0.050$ target.
From there, we have to reevaluate, it may be the start of another leg up too.
After the google hype it cooled down a bit to the 0.382 Fibonacci. From here, we have a chance to make a move, depending on what BTCUSD is doing.
//The PINK line is from yesterday, don't look at it :)

HBARUSDT Forming Bullish Gartley | Upto 174% Potential MoveThe Formation Of Gartley:
Hedera Hashgraph (HBAR) has formed bullish Gartley pattern and entered in potential reversal zone.
Lets have a look on the move of price action to see how perfect this pattern is driven:
After initial leg (X to A) the A to B leg is retraced between 0.618 to 0.786 Fibonacci and then B to C leg is projected between 0.382 to 0.886 of A to B Fibonacci projection area and last leg (C to D) is expected to be retraced between 0.618 to 0.786 Fibonacci and this will be our potential reversal zone to buy.
Buying And Sell Targets:
The buying and sell targets according to harmonic BAT pattern should be:
Buy between: $0.03798 to $0.02574
Sell between: $0.04767 to $0.07076
So this very small term 12 hour chart has capacity to produce up to 174% massive profit.
Stop Loss:
The potential reversal zone area can be used as stop loss in case of complete candle sticks closes below this level.
I will be keep posting more trading ideas.

Hedera Hashgraph Moves Big | The Most Common Mistake Trading CryHedera Hashgraph (HBARBTC) took off today and is active with a massive green candle after breaking EMA50 and testing it as support... We have a high volume jump of 88% so far... It can continue growing.
Now, what is the most common mistake when trading crypto?
A: Being too conservative with our targets.
Believe it or not, the cryptocurrency market is incredibly wild and there are always huge price swings... The most common mistake that we see is the potential being underestimated or not accepted when seen.
There is always lots of noise when we share big numbers, but this is normal when it comes to crypto... Cryptocurrency, altcoins always MOVE BIG!
Namaste.

HBAR - Another run?Squeez is about to get over. It should bounce from here.
Setup is quite simple, HBAR is holding trendline well and I am expecting it to bounce from here.

🔥 Binance :Top Gainers Today / Hedera Hashgraph +139%HBARUSD was the one of the worst performing tokens, ICO Price $0.12, Low at $0.0095
What to say...
Crazy !
Disclaimer:
We are not registered or licensed in any jurisdiction whatsoever to provide investing advice or anything of an advisory or consultancy nature,
and are therefore are unqualified to give investment recommendations.
Always do your own research and consult with a licensed investment professional before investing.
This communication is never to be used as the basis of making investment decisions, and it is for entertainment purposes only.

HBAR/BTC 1D (Binance) Broke-out of falling wedgeHedera Hashgraph is looking quite good for mid-term after this breakout and pullback.
The road to last triangle support (became resistance) is just starting, set-up:
Entry= 0.00000127 - 0.00000135
Take Profit= 0.00000163 - 0.00000195 - 0.0000259
Stop Loss= 0.00000099 or below
Risk/Reward Ratio= 1:1 - 1:2 - 1:4

HBAR UpdateBy taking use of an old trick, we can now pinpoint HBAR's main performing formation, as 'Descending Channel'. We do that by connecting 2-point axis lines at exact 'open' and 'close' coordinates to imitate continuous performance into the future (see below). This method can be traced back to the 18th century of Japanese rice trade, where the usage of candlesticks originates from.
Step-Line 2-point axis connection for higher precision:
Moving to the fun part: expect a massive price surge once (and if ) performance has passed the 'century'-VWAP level. This makes finding the bottom even more important – which I personally believe to be around half a cent (0.005). We'll be able to determine a more precise level once the next SAR point breaks (should be any day now). We will then be able to mirror the entire SAR series' drop of -56%, from that point downward, to determine an approximate "strong oversold" area, or in other words "the bottom". This area could be strategically used to place downward incremental buy-orders. A recent buy order of some 10+ million shares @ 0.01 (roughly $100k worth) was registered, showing how quickly word is spreading about HBAR.
Key level is the intersecting level between the (blue) intermediate downward channel and the lower main channel trend-line. Breaking this level is an indication for a continuation and an exit below the channel, where bullish accumulation can begin. Take note that HBAR could produce 'wicks' as high as the 20MA or slightly below the 50MA, but performance should remain 'intermediate channel'-bound (blue).
NOTE:
Considering all the bullish facts that Hedera Hashgraph boasts, it's imperative that you understand – the implications for – and problems with – "virgin" stocks or currencies, which have just recently started trade. This analysis was made using nearly 20y of experience in chart-analysis, and still, I'd like you to take this as an "idea" only (as all TradingView posts imply). This type of trade is extremely difficult to foretell and falls under the category of "high-risk", meaning that we only know what we know. Hidden factors (if there are any) cannot be calculated into this chart. Therefor I implore you to do your own due diligence parallel to this analysis and base your potential HBAR-trades with your own confidence, not with mine. In addition: as you know, price change is famously tied to supply and demand. If demand rises out of proportion prematurely, prices could start rising outside of these technical boundaries, potentially causing you (and us all) to "miss the train".
This post will be updated continuously when mentionable changes can be observed.

HBAR/BTC | Descending Channel !!HBAR/BTC (Update)
Forming Lower Lows in DAILY Chart From Long time & Now Buying Volume is Increasing .
RSI & MACD Both Are Turing Bullish as well. Moving Below the Daily EMA10, If Broken it then Chances of Uptrend Will Increase.
Key Resistance/Breakout Zone : 237 Sats
Please like, subscribe and share your ideas and charts with the community!


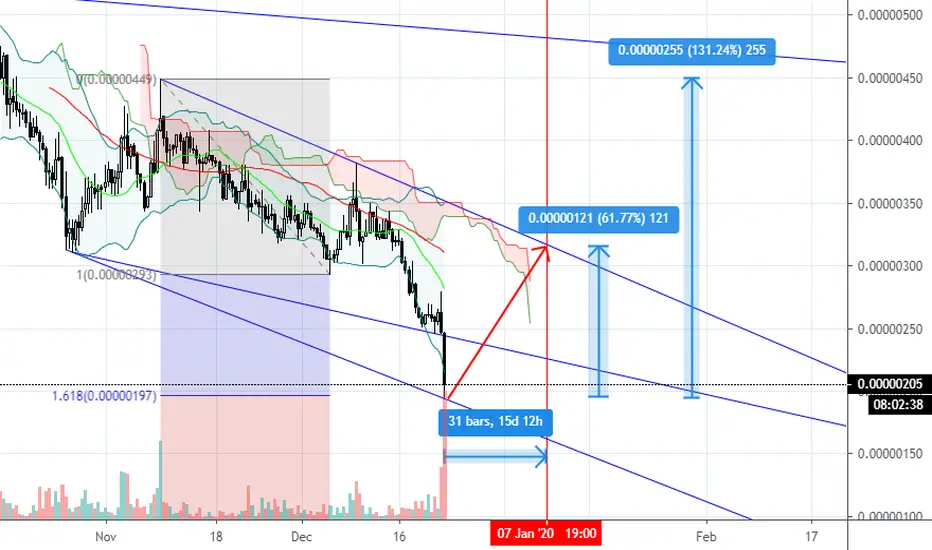
Hedera Hashgraph (Dec 23) - 65% in 16 Days, Max 130%#HBAR/BTC (Binance)
Entry Zone: 200 - 205
Take Profits: 215 - 230 - 250 - 300 - 350 - 400 - 450
Stop Loss: 184
HBARBTC formed bullish Butterfly | Upto 47% bullish movePrice action of Hedera Hashgraph / Bitcoin has formed a bullish Butterfly and entered in potential reversal zone.
This PRZ area should be used as stop loss in case of complete candle stick closed below this area.
I have used Fibonacci sequence to set the targets:
Buy between: 0.00000269 to 0.00000238
Sell between: 0.00000293 to 0.00000351
Regards,
Atif Akbar (moon333)

Hashgraph
Before we get into the technicals, let me say this right off the bat. There is not a single doubt in my mind that Hashgraph is the future of ALL crypto currencies. It will replace the old and problem-infested system that we know today as Blockchain by finally solving the "unsolvable" Byzantine General's Problem (ultimately solved by Dr. Neemon Baird ). It solves scalability, security, speed, fairness (order of transactions), and especially sustainability, just to name a few out of so many.
Blockchain currently requires 5% of global energy usage! Let that sink in for a minute. If we were to replace the entire monetary system to Blockchain, it would require us to use twice as much energy as the entire world is currently using – completely unsustainable. In addition, Blockchain will soon reach a dead-end due to its coins running out and it's miners ultimately choosing to exit the market. It will become more and more difficult to mine, as requirements for more energy versus less return simply won't remain attractive. It will lead miners to select (which is already unfair practice) only high-fee blocks resulting in much longer transaction times (days!) leading to price shifts and so on and so forth.
Back in the day when the birth of the blockchain method was absolutely amazing compared to the corrupted FIAT currency system, it came to us already highly flawed . Major banks and institutions have now discovered Hashgraph and accepted its superiority over Blockchain as factual and mathematically proven. It's just a matter of time until the general public is made aware of the real implications for Blockchain , and why Hashgraph is to replace it sooner or later.
To find out more about how it works, simply look up YouTube for " hashgraph explained ". I found the simplest explanation to be by Mike Maloney (search for " From Bitcoin To Hedera Hashgraph Documentary " and skip to 4:12). I highly suggest to watch through all of Mike Maloney's 10 episodes about the financial systems to get a good idea of where we're headed. The content in his documentary is common knowledge today, but the explanation is made easily digestible for the average Joe.
TECHNICALS:
Hashgraph is brand new and has just started to trade this past September on the BITTREX exchange as HBAR (Hedera Hashgraph). Given the situation where a large sell-off occurs followed by a consolidation in a closing descending wedge (and exit below), HBAR could now slip down further towards 0.016 (technical low using the 1/3 rule), compensating for the sheer "falling force" of the sell-off. At the same time, keep in mind that growing public knowledge about HBAR could spark a premature rally without arriving at the proposed low.
Now, at such a young age (chart) I recommend using step-line only, and disregard the highs and lows of candles. Step-line is showing a possible miniature head-n-shoulder formation (still in the making) that could propel HBAR above the upper trend-line. Watch out for a large net-volume spike, at least double the size of the current largest one, as it will signal the trend change. Also keep an eye on RSI hovering below the mid-line (50). Breaking the upper dashed line (blue) could as well signal the trend change. I personally believe that we can expect the bottom to be between Now and February 2020, so this post could be right on time.
Once the resistances are out of the way, HBAR could quickly see price levels well above $1 and theoretically can mimic other past crypto rallies to far higher levels. Only this time it's a legit ever surviving system which will offer the fastest, most secure and sustainable transaction system in the world. Not just monetary! Any information sent across the internet using Hashgraph would arrive "untempered with" since there is always a consensus reached.
STEP-LINE
New stocks are the hardest to analyze since they offer the least information of trading psychology. So bear with me on this one, I'm here to help and I will keep updating this post along the way. Lines and connections have been averaged on step-line over log for higher precision. PM me for questions.


HBAR/BTC (Update) | Getting Ready For Big Move..!!HBAR/BTC (Update)
Forming Falling Wedge in Daily TF Chart But Need Some Strong Buying Volume For Breakout..
In Case of Breakout, It Might Test 400-420 Sats Region..
If Failed to Break then Expecting Another Lower Low inside the Wedge..
Keep Your Eyes on it..!!
Please, give us your opinion in the comments.!!
If you like the idea, please hit the Like button and subscribe to the profile in order not to miss our updates.
The information given is never financial advice. Always do your own research.

Hedera Hashgraph (Dec 04) 40% PProfit in 13 Days#HBAR/BTC (Binance)
Entry Zone: 305 - 310
Take Profits: 330 - 360 - 380 - 400 - 430
Stop Loss: 279
