NZD/USD to SHORT more before possible BUYFollow trend line to know your exit.
Draw your own chart, in the 4hr timeframe, best view to draw trend line.
For indicator, use 45mins timeframe for viewing and analysis.
Trade chart at your own risk.
Want to know what indicator I'm using? Send me a polite PM and i'll show you where to find it, plus additional tip if you are a pro (non-pro will not have access to this tip)... no I do not sell anything, all free.
Help

Trading Divergences - An Alternate View for New TradersTrading divergences is a very common technical analysis strategy, but it comes with one big problem: the most common divergences (not hidden) trade against the trend. This means that new traders can often get into trouble by constantly looking for, and trading, against a dominant trend.
Here's an idea to help you become more profitable over the long-term: identify divergences on your chosen momentum indicator, but only trade on trend continuation signals. I'm not saying you need to do this forever, as once you're experienced you can trade both pullbacks and continuations - but doing so requires multiple layers of confirmation, and a lot of knowledge/planning/experience.
By trading trend continuation signals after divergences, you're stacking the odds in your favour by going with the dominant trend. You're also training your eye to see divergences, and seeing how the markets react to divergences. For new traders this can be a valuable lesson in the power of momentum in financial markets.
So, what are trend continuation signals? It depends on your chosen momentum indicator, so I can only provide general ideas; you need to adapt things according to what you're using. My chart contains a custom momentum indicator, loosely based on the RSI. However, it's far smoother than the RSI, so I can reliably trade precise signals (e.g. for me, a cross of 0). On the RSI, you may choose something a bit further down the scale, for example, a cross below Oversold (20/30). If you're using a Stochastic indicator, you may trade a cross below Overbought (70/80). If you don't understand why I'm suggesting you trade signals at the opposite end of the scale for RSI and Stochastic, let me know.
Hopefully this all makes sense, and remember that it's just an idea if you're a new trader and struggling to make good trades.
Let me know if you have any queries.
DD

BTC in an active mid-term down trend/lower consolidation periodI'll keep it simple.
Weekly Time-Frame
10 SMA - Orange line,
21 EMA - Yellow Line,
20 SMA - Red Line,
Parabolic Sar - dotted crosses
The parabolic sar has printed on the weekly time-frame. I don't use SAR personally unless it is on the weekly which have a very high percentage of playing out. You can see every time the SAR has printed on the weekly, there was a sign of mid -term reversal. BTC has printed the SAR and I suggest, highly suggest you pay attention. The bearish divergence on weekly has been confirmed and usually when bearish divergence are active, you would want to see it travel back down to the 21 EMA.
The EMA death cross on the 4hr has become a meme, but nonetheless, it is playing out. Price will consolidate on the 10 SMA weekly with bounces here and there, but eventually it will break. The target is most likely the 21 EMA on the weekly and 20 MA on weekly. This is a sign of a healthy bull-market continuation of price if it can hold and consolidate on these two levels 21 EMA/20 MA weekly. They are the magnet in the market that will continue to push price further for a couple more years just like it has in previous bull markets. These are the areas of interest that many are looking to buy back for a longer HODL period on BTC.
If price does not hold on the 21 EMA or 20 MA, and closed a candle/open a candle below, that is a sign of disaster to later to come for BTC. Just to have confluences, 4hr is showing a "death cross" on the 50 EMA and 200 EMA while weekly has re-entered the CCI . After a massive run of 300% since March, it will need to consolidate for a longer period of time before it can make another run. The macro time-frame by all means is still in an active bull-market, do not confuse mid-term analysis with macro analysis.
So, how would you play this? Any rally for BTC will be sold into, and opening a short position will more than likely be in your favor because of the trend has reversed to the downside on the mid-term time frame. The blue box on the chart is the interest areas of buyers wanting to step back into the market. Wait for a weekly candle close AND open above the 21 EMA weekly, and that'll be your very very nice long for tremendous upside. Stop-loss under the 21 EMA, your risk reward is amazing at these levels.
If you appreciate my macro analysis please consider using my affiliate link.
www.deribit.com
www.bitmex.com


Help: what tool to useI want to sell 80% of my Ether between these 2 points ~$264 and ~$1340.
Let's say I have 10 ETH and want to split those 2 points up into 40 x .25ETH selling markers...Does TradingView have a tool that can do this for me, or do I need to muck around with Excel?
I'd like to set 40 sell orders, some now and the rest scaling all the way up to $1340
Cheers

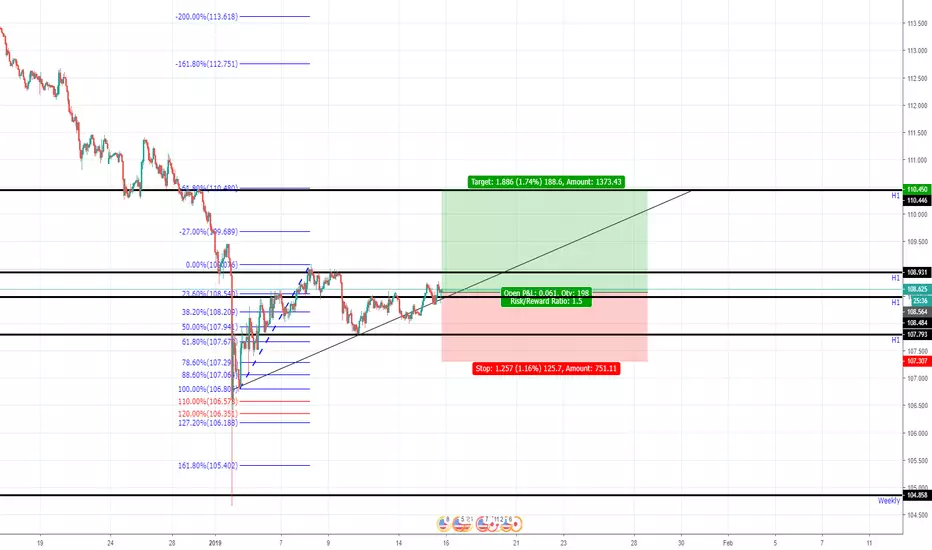
SELL 4H USD/CHF - BEGINNER TRADER, LOOKING FOR ADVICES Hi Guys,
this is my first idea that I publish.
Brief story of me: Studying trading since 3 months ago, no experience, no help, no courses, just me, youtube tutorials and books. I'm looking for recommendations to improve my trading, my analysis and my overall trading experience. Thank you so much to anyone that likes or comments my idea. Feel free to give your opinion and your advices, everything is more than welcome.
As we can see in this set-up, I highlighted all the reasons why I think there is gonna be a downward trend in the next days whether the main trend line gets broken.
Thank you all, feel free to ask questions.

May 2nd 2019 (PT 2)just checking back in from earlier. Retweet for some exposure. need feedback from you EW specialist.

May 2nd, 2019 out here trying again. putting the waves to work seeing if i can apply them correctly. Hopefully im not too off. check it out. leave feedback (i can take criticism well). any tips? can any one explain how combinations work????

random stuffmessing around with elliot waves. just doing what ive seen ya know. monkey see monkey do. Give me some feedback if you consider yourself an elliot wave specialist. any tips/rules/axioms to follow/look for.

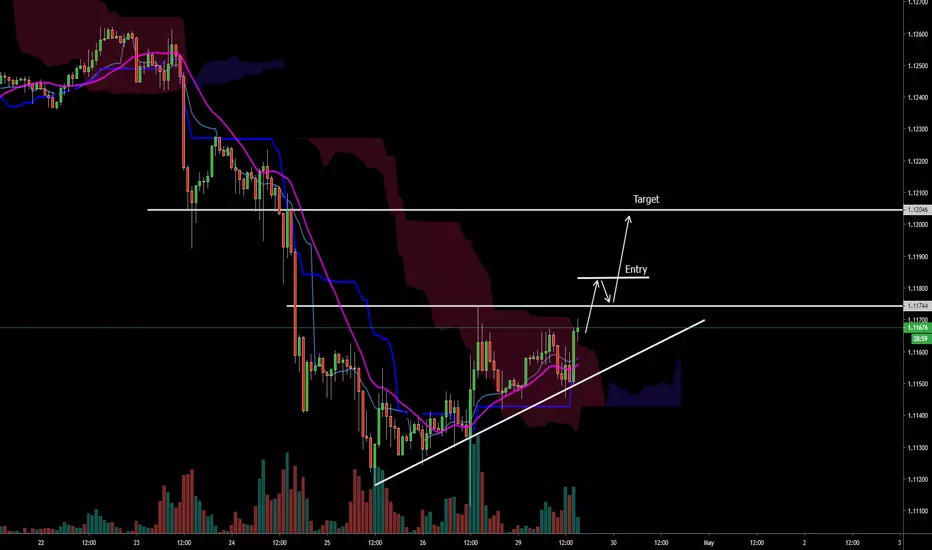
Bullish Buying OpportunityHello everyone! Today we are looking at EURUSD. Looking at the 1hr chart we can see that we are slowly transitioning back into a bullish trend. Currently we sit above both the MA and VWAP, and Ichi moku indicator is also signalling bullish. We want to see a break above 1.11744 and re-test of that level, once that happens, we will have our buy stop order ready to go, above the initial pullback point. Our target price will be 1.12046. Follow me for more! And leave your comments below whether you agree or disagree with me, and lets have a discussion!
Massive Dump Incoming! XRP Headed to 0.05 cent!Hello everyone! Hope you are having a great day! Lets start by taking a look at XRP, and talk about why I think its going to 0.05 cent. First reason is, regulation, no government in their right mind is going to let xrp/ripple come in and disrupt their central banks entire payment processing current operation (dollars/swift), its just not going to happen in this day and age. Instead of using xrp/ripple, they will continue to use dollars/swift and just modernize the processing to be instantaneous. Second reason is, inflation , xrp is highly inflated and many people holding billions of coins in wallets ready to dump at a moments notice, remember Jed McCaleb? Third reason is, TRANSPARENCY, xrp/ripple has never been audited legitimately, so we do not technically know who exactly owns all the top wallets, according to an analysis performed by BITMEX, Ripple has been unable to retrieve the first 32,570 blocks from the Ripple ledger and none of the nodes could repair or obtain the data. This means that Ripple cannot a complete an audit of their blockchain, nor a transactional analysis of the 100 billion XRP coins. So therefore, xrp/ripple claims it can never be audited, therefore basically can never be trusted by any major organization or corporation, so it will simply be left in the dust. Whether you agree or disagree, please leave a comment below letting me know either way!


AUD/USD bullish or bearish?Hi, I’m very new to this and still learning so any feedback is accepted.
Do you think this is a potential bullish or bearish pattern?
I personally think it’s going to come back to the support line, (previously a resistance line) and bounce to the resistance at the top of the channel.
Please please comment let me know your ideas or if I’m doing something wrong/correct.

Warning 0.01 cent incoming for ripple XRPXRP on the monthly chart, you can clearly see that it broke below the last support zone at 0.35cent. It attempted to regain its momentum and break back above at 0.35cent level, but it failed. There is no real support until we reach the next support level at 0.15cent and a break below that level will result in the bearish momentum pushing ripple back to 0.01cent. It will be interesting to see what happens, I'll be watching and updating this post for the next few months. Feel free to comment below whether you agree or disagree, lets have a conversation about it!


BIG MOVEBTT obvious triangle spotted here, and solid bounce off of 200 SMA. If it wants to follow this pattern, it should be looking bullish for the next cpl days until the top of the resistance (shaded yellow box).


Survive Strategy or Suicide?Survive Strategy or Suicide?
I'm have one thousand dollars, and I use lotos of 1k. for all trades, so I believe that I have some "Equity" to risk...
I will like to know what will you do, if you where in this situation I'm in...
Whate for the yelow arrows to close and brake even with little profit, o you recomend to wait to the end of the orders?
Or you believe that nither of this will happend?
Thaks for any recomendations and comments...
Just one more lost beginner in this desiving an confuesing Market...
Very stresing... Jejeje...


Can Anyone Help Me???If you have experience with Elliott Wave Theory I would really love your insight and feedback. Does this look right? I ran Fib Retracement and then Fib Extention. Is this a good projection or should I go back further and start over with a new count?
