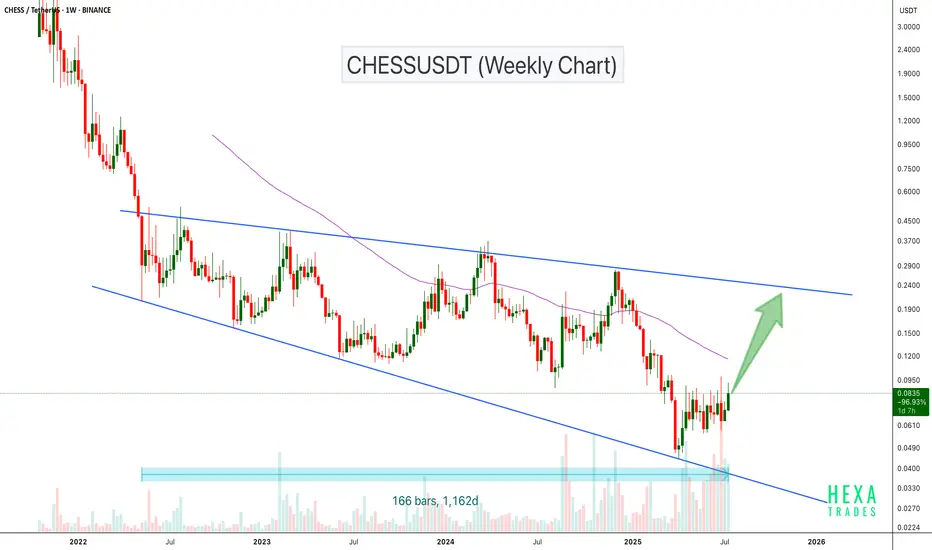
CHESSUSDT Bouncing from Broadening Wedge SupportBINANCE:CHESSUSDT has been trading inside a broadening wedge pattern for the past 1,150 days, showing long-term consolidation. The price recently bounced from the lower support of the wedge with rising volume, a potential sign of a bullish reversal.
If momentum continues, CHESS could move toward the upper wedge resistance in the $0.20–$0.25 range. A breakout above that zone may trigger a much larger trend shift.
Cheers
Hexa
CRYPTO:CHESSUSD
Hexatrades
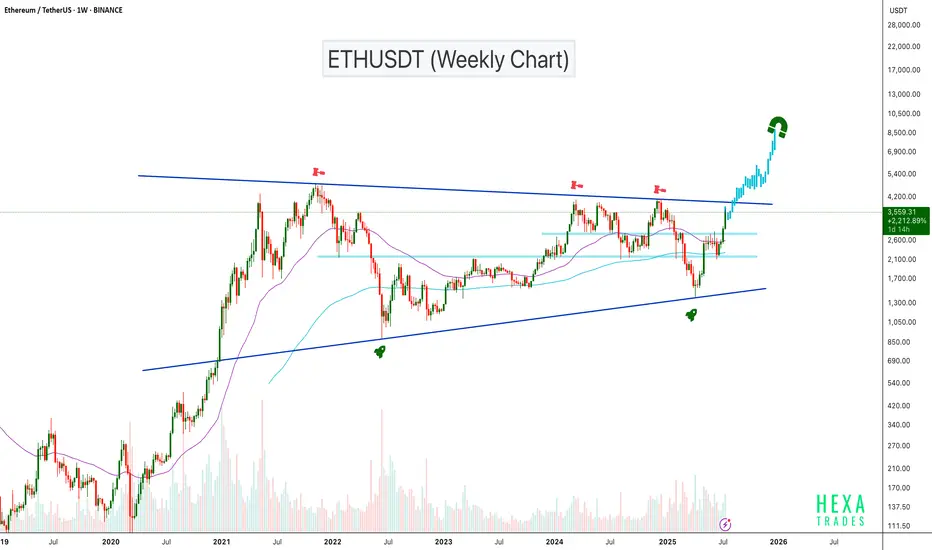
ETHUSDT Gearing Up for Explosive MoveBINANCE:ETHUSDT has been trading inside an ascending triangle pattern for the past 1,600 days. The price is now moving toward the triangle's resistance zone with strong volume support. A confirmed breakout above this resistance could trigger a powerful bullish move, with potential targets in the $6,000–$8,000 range.
Cheers
Hexa🧘♀️
BITSTAMP:ETHUSD
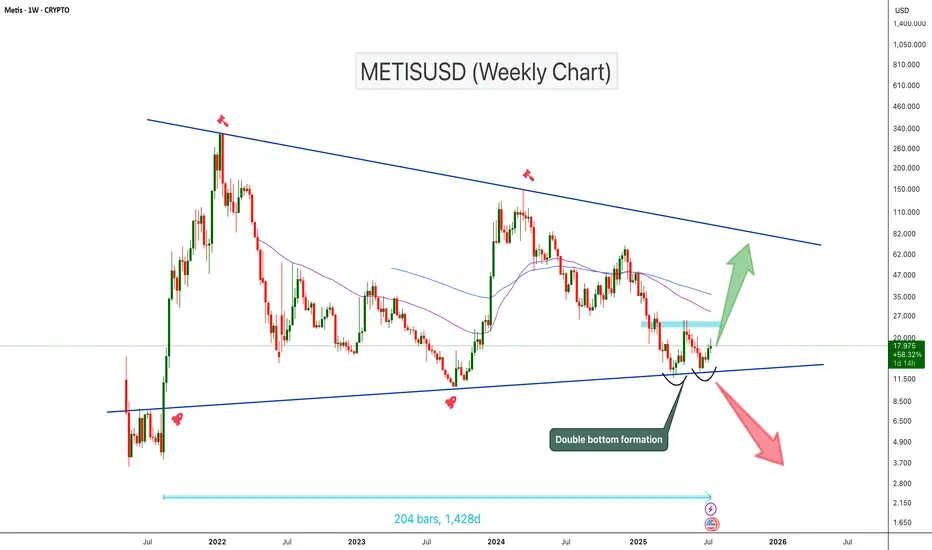
METISUSD Double Bottom at Triangle Support!METISUSD has been trading inside a symmetrical triangle for the past 1,400 days. The price is currently sitting at the triangle support and forming a potential double bottom pattern. The double bottom can be confirmed once the price breaks the neckline resistance zone. If the price breaks this key resistance zone, we could expect a 100%–250% bullish move toward the triangle’s upper resistance
Cheers
Hexa🧘♀️
BINANCE:METISUSDT SEED_DONKEYDAN_MARKET_CAP:METIS
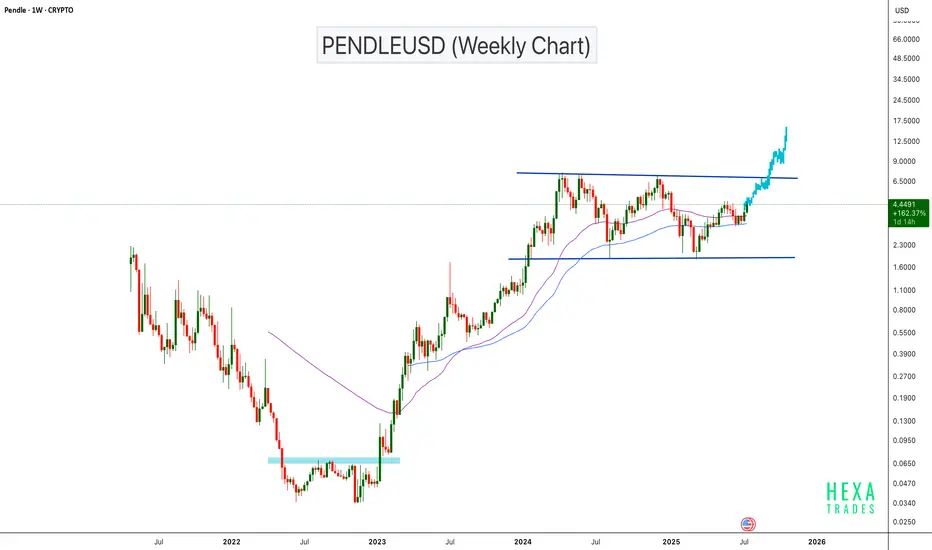
PENDLEUSD Bullish Continuation Setup!BINANCE:PENDLEUSDT has surged approximately 20,000% from its bottom, showing exceptional long-term strength. The price is now approaching a major horizontal resistance zone on the weekly chart. If the price breaks the parallel channel resistance, we can expect a bullish continuation with a psychological target of $15.
Cheers
Hexa
CRYPTOCAP:PENDLE CRYPTO:PENDLEUSD
FLOKIUSDT Breaks Key Resistance – Bullish Continuation Ahead?BINANCE:FLOKIUSDT is trading inside its longest ascending triangle. The price has respected the triangle's support and bounced back. It has now broken a key resistance zone. As seen in the chart, every time the price breaks a major resistance, a bullish move follows, and we can expect a similar scenario this time.
SEED_DONKEYDAN_MARKET_CAP:FLOKI CRYPTO:FLOKIUSD
Cheers
Hexa🧘♀️

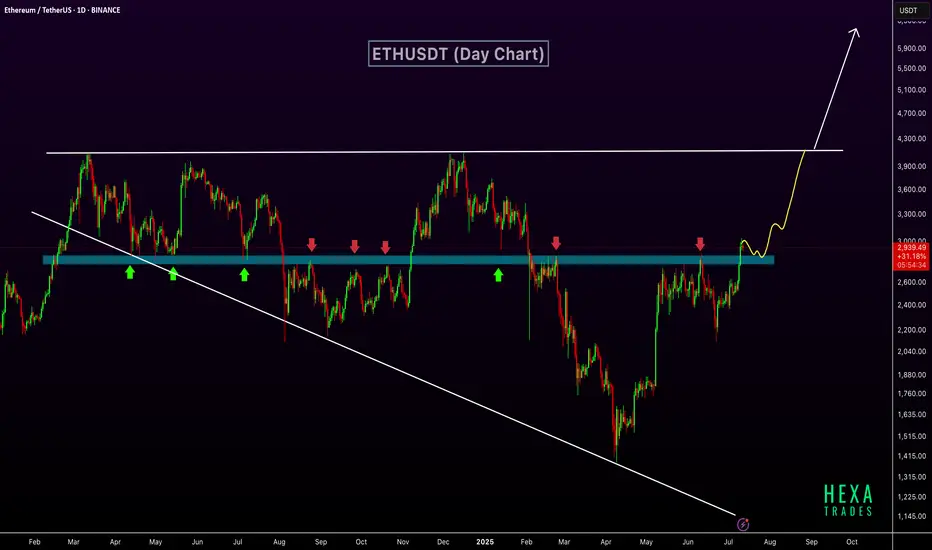
ETH Breaks Key Resistance – $6K Possible if Wedge BreaksETHUSDT has broken out above a key horizontal resistance zone that has historically acted as a strong support and resistance level. This zone, marked in blue, has seen multiple rejections and bounces over the past year, confirming its significance.
The recent breakout above this zone indicates a shift in market structure and suggests growing bullish momentum. The price action shows a clean move above resistance, with potential for a retest before continuing higher. The market is also forming a long-term broadening wedge pattern. The next target lies near the upper resistance of the wedge, around $4,000. If the price breaks above this broadening wedge, it could open the path toward the $6,000 level.
Regards
Hexa
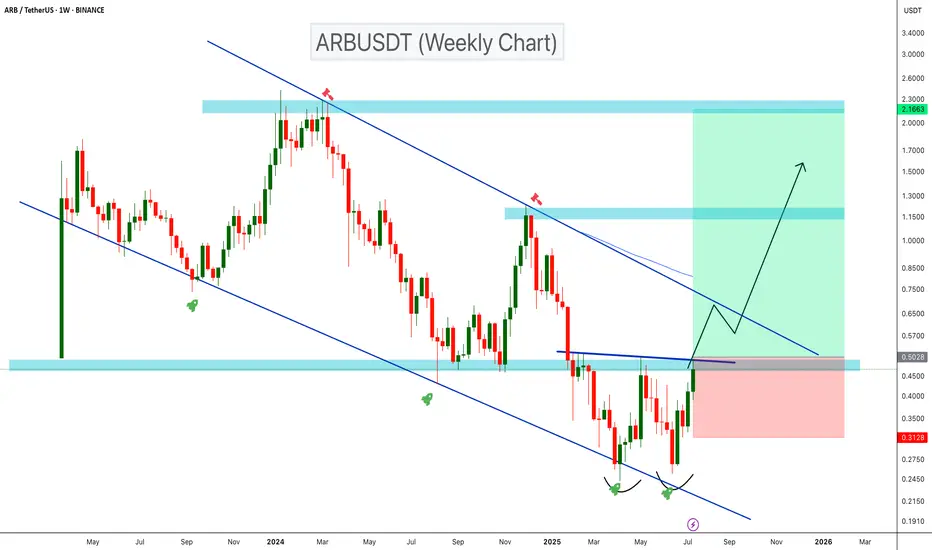
ARBUSDT Double Bottom Signals Bullish Reversal!ARBUSDT is showing a bullish reversal setup on the weekly timeframe after trading within a descending channel for over a year. A clear double bottom has formed near the channel’s lower support, and the price is now breaking above key resistance around $0.50. If this breakout holds, a move toward the upper resistance of the channel and potentially reach the ATH end of this bull run.
Cheers
Hexa
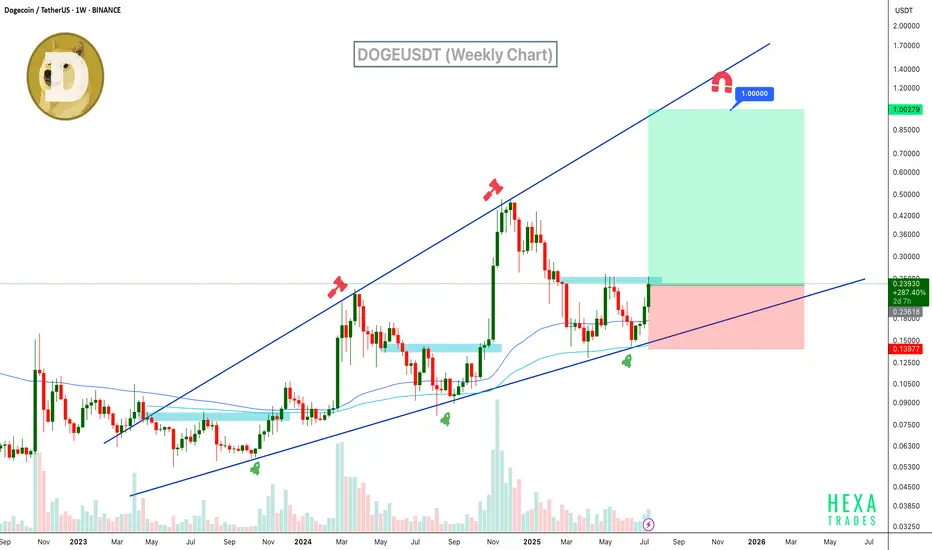
Will DOGE Hit $1? Ascending Broadening Wedge in PlayDogecoin is trading within a clear ascending broadening wedge on the weekly chart. The price has bounced strongly from wedge support and the 100 and 200 EMAs, now pushing upward with growing volume and bullish candles. If momentum sustains, DOGE could rally toward the $1 psychological target and broadening wedge resistance.
Resistance 1: $0.35
Resistance 2: $0.60
Resistance 3: $1.00
Stop Loss: $0.14
Cheers
Hexa
COINBASE:DOGEUSD BINANCE:DOGEUSDT
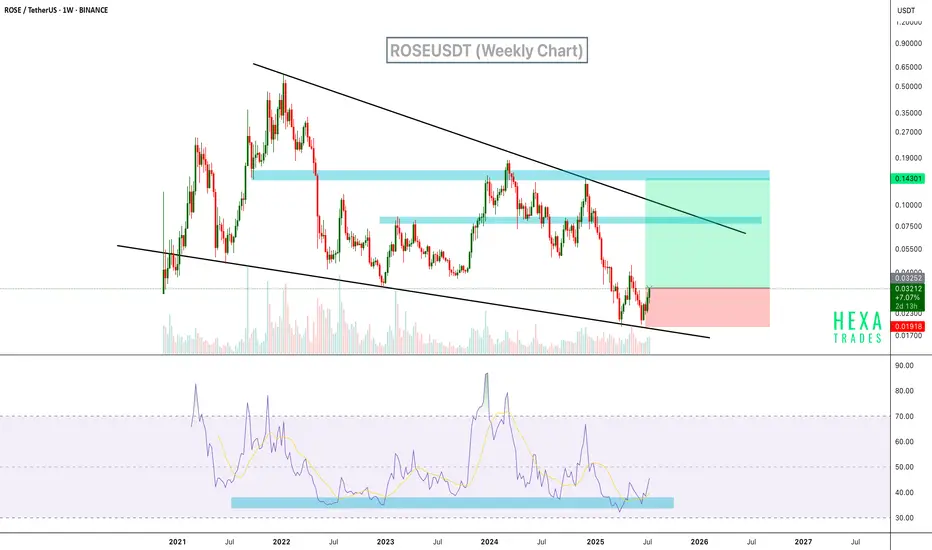
ROSEUSDT Rebounds from Wedge Support BINANCE:ROSEUSDT is currently trading within a long-term descending wedge on the weekly chart, a classic bullish reversal pattern. Price recently bounced off the lower wedge support with strong momentum. Additionally, the RSI indicator has rebounded from a historically strong support zone in the oversold region, which has previously signaled major bottoms.
Resistance 1: $0.048
Resistance 2: $0.075
Resistance 3: $0.145
Cheers
Hexa
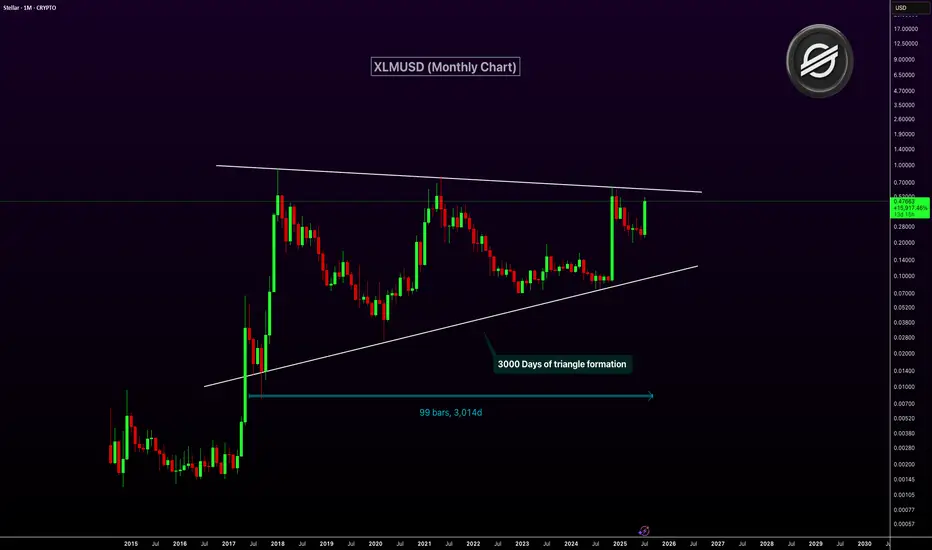
XLMUSD Nearing Breakout After 3,000-Day Triangle FormationXLM has been consolidating inside a massive symmetrical triangle for over 3,000 days. This long-term pattern on the monthly chart dates back to 2017. The price is now approaching the upper resistance trendline of the triangle. A breakout from this structure could ignite a major bullish rally.
The current monthly candle shows strong momentum with over 100% gains. A confirmed breakout above resistance could mark the start of a macro uptrend. This triangle is one of the most significant technical setups in XLM’s history.
Target 1: $1.00
Target 2: $2.50
Target 3: $5.00
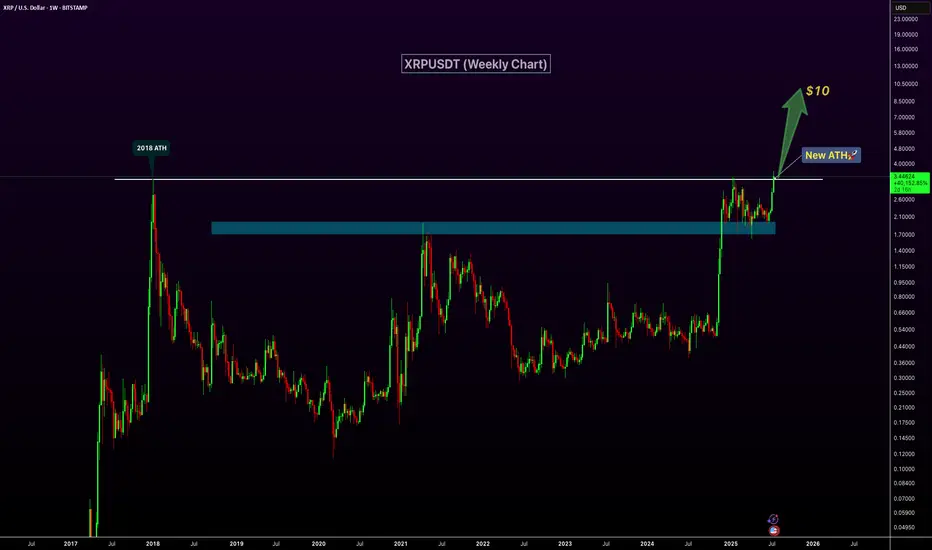
XRP Breaks 2018 High – New ATH Confirmed!XRP has officially broken above its 2018 peak, signaling a major bullish breakout and printing a new all-time high on the weekly chart. The previous resistance zone around $2.6–$3 has now flipped into strong support, confirming the strength of this move. With increasing volume and momentum behind the rally, XRP appears well-positioned for continued upside. The next key psychological target lies at $10, and current price action suggests a clear path toward that level. If bullish sentiment continues, this breakout could mark the beginning of a significant new uptrend.
SUIUSDT Breaks Out of Triangle – Eyes on $10BINANCE:SUIUSDT daily chart has confirmed a breakout above a symmetric triangle resistance line within a larger ascending channel, signaling strong bullish momentum. Price has reclaimed the 100 and 200 EMAs, and the breakout is backed by rising volume. This setup opens the door for a potential rally toward the $10.00 level, with price currently holding above key structure support around $4.00. As long as this level holds, continuation toward the upper trendline remains likely. CRYPTOCAP:SUI

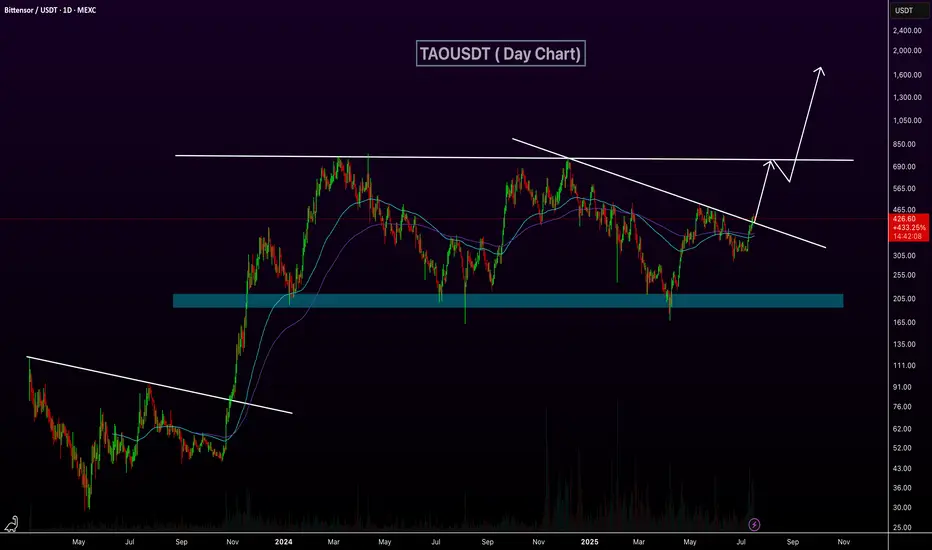
TAOUSDT Breaks Descending Trendline!BINANCE:TAOUSDT daily chart is showing a potential bullish breakout as price moves above a long-term descending trendline. This breakout, combined with support from the 100 and 200 EMAs, indicates growing upward momentum. If price holds above this trendline, the next key resistance lies around the $750 level. A successful breakout and retest could pave the way for a major rally toward $2,000. GETTEX:TAO
Regards
Hexa
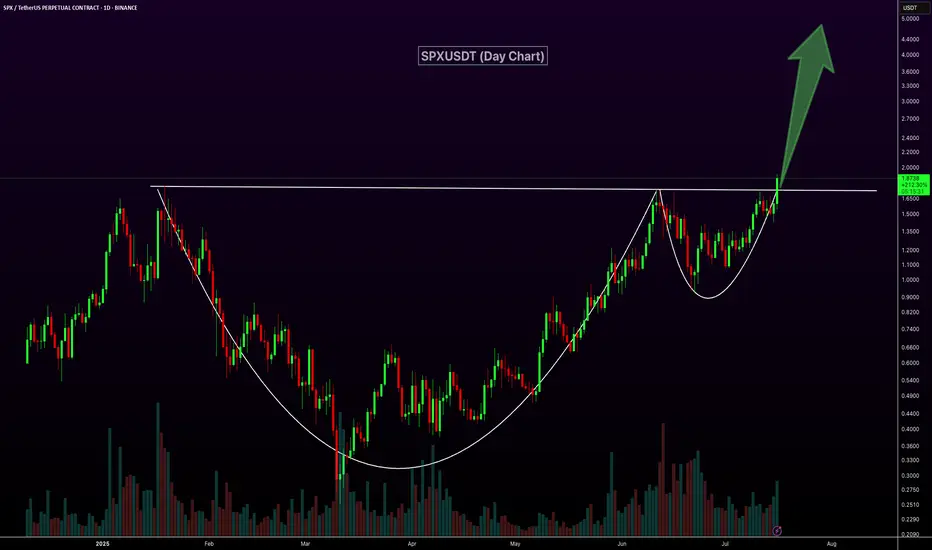
SPXUSDT Forms Classic Cup and HandleSPXUSDT daily chart is showcasing a strong Cup and Handle breakout with high volume, a classic bullish continuation pattern. After a well-formed, rounded base, price has cleanly broken above the neckline resistance around the $1.80 level, supported by strong momentum and a sharp bullish candle. This breakout signals the potential for a significant upside move, with the next leg likely to push toward much higher price levels.
SP:SPX MEXC:SPXUSDT
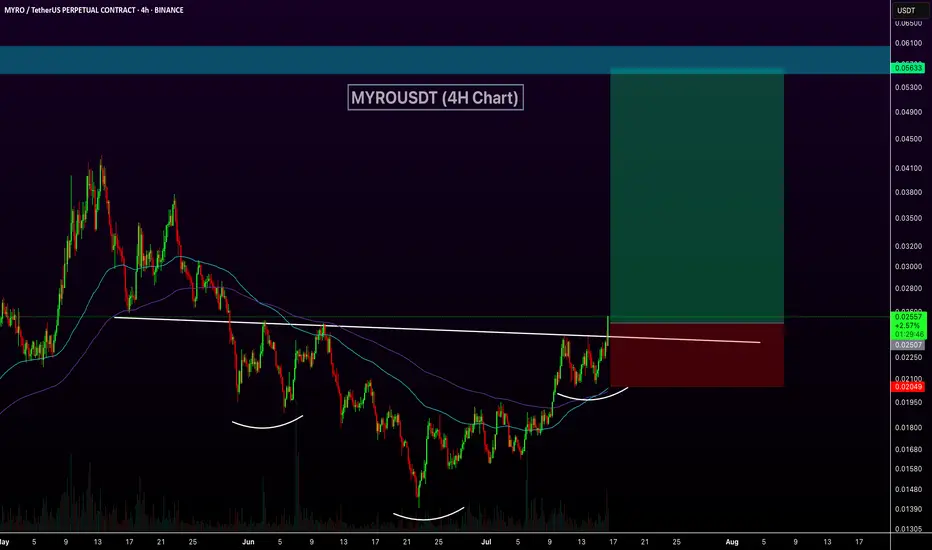
MYROUSDT Breaks Out of Inverse Head and Shoulders BYBIT:MYROUSDT has a clear breakout from an Inverse Head and Shoulders pattern, signaling a potential bullish trend reversal. Price has decisively broken above the neckline around the $0.025 level, supported by increased volume. Additionally, MYRO price is trading above both the 100 EMA and 200 EMA, reinforcing the bullish momentum.
HBARUSDT Trendline Breakout - Target 150%!HBARUSDT is currently attempting a breakout from a long-standing descending trendline on the daily chart. The price has reclaimed a key demand zone and is now trading above both the 50 and 100 EMA, a bullish technical signal suggesting bullish momentum.
If the breakout sustains, HBAR could target the 0.30–0.55 range in the coming weeks. Holding above the EMAs and trendline retest will be crucial for confirmation.

ALGOUSDT Approaching Breakout!BINANCE:ALGOUSDT is showing a potential trend reversal after bouncing from a strong historical demand zone around $0.15. Price action is testing the descending trendline for a breakout, which could trigger a bullish continuation move. Similar to the previous breakout in late 2024, this setup hints at a possible repeat rally. A weekly close above the trendline would confirm strength, opening targets at $0.32 and $0.70+.
COINBASE:ALGOUSD

ATOMUSDT Channel Breakout Alert!ATOMUSDT Technical analysis update
NASDAQ:ATOM is bouncing from a major support zone and has formed a descending channel at the bottom of the zone on the 4H chart. Currently, the price is breaking above the channel's trend resistance and trading above both the 50 and 100 EMAs on the 4H timeframe — a bullish signal for ATOM.

NEIROETH Breakout Loading!$NEIROETH is currently consolidating within a symmetrical triangle pattern on the daily chart, suggesting a potential breakout in either direction. The price action has respected this pattern for several weeks, gradually forming higher lows and lower highs. Notably, both the 100 EMA and 200 EMA are acting as dynamic support, reinforcing the bullish structure. A confirmed breakout above the upper trendline could open the door for a strong move toward the $0.21 level, offering significant upside potential.

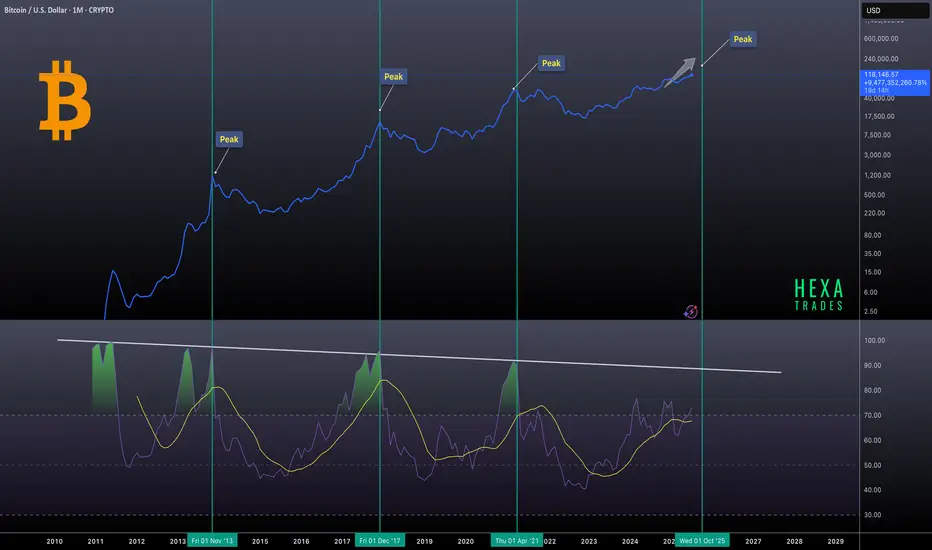
Bitcoin Macro Cycles: Sell Signal at RSI 90Bitcoin’s historical market cycles, using monthly RSI data to identify previous bull market peaks. Notable tops in 2013, 2017, and 2021 are highlighted, with the next potential peak projected around October 2025. A consistent pattern emerges where each market top aligns with the monthly RSI reaching or nearing the 90 level, indicating extremely overbought conditions.
Sell when the monthly RSI hits 90. This has consistently marked previous market tops and can serve as a reliable signal for long-term investors.
BABYDOGE Bulls Step In at Historical Demand ZoneOKX:BABYDOGEUSDT is showing bullish signs on the weekly timeframe after rebounding from a strong historical demand zone. Price has respected this zone multiple times since early 2022, and once again, buyers have stepped in aggressively, leading to a solid bounce.
The current structure suggests a potential reversal if momentum continues, with the possibility of retesting previous resistance zones near 0.000000020 and higher. A clean breakout above short-term consolidation could trigger a strong move, similar to past rallies from this level. This area continues to act as a major accumulation zone for long-term holders.
Resistance 1: 0.00000002500
Resistance 2: 0.00000004100
Resistance 3: 0.00000006500
Stop Loss :0.00000000800

SHIBUSDT Bounces Strongly from Wedge SupportSHIBUSDT is forming a bullish falling wedge on the weekly chart, showing signs of reversal after bouncing from key support at 0.00001000. A breakout above the wedge resistance could trigger strong upside momentum in the coming weeks.
Entry at current price
Stop Loss: .00000890 (Below the Wedge Support)
TP1: 0.00001700
TP2: 0.00003100
TP3: 0.00007000
$1000SHIBUSDT CRYPTOCAP:SHIB

IOUSDT Reversal SignalBINANCE:IOUSDT has broken out of a falling wedge on the 4H chart, signaling a potential trend reversal.
The price is trading above both the 50 EMA and 100 EMA, indicating growing bullish momentum.
A successful retest of the breakout zone could lead to a sharp move toward the $0.85–$1.10 level.
Resistance 1: $0.88
Resistance 2: $1.10
Stop Loss: $0.655
