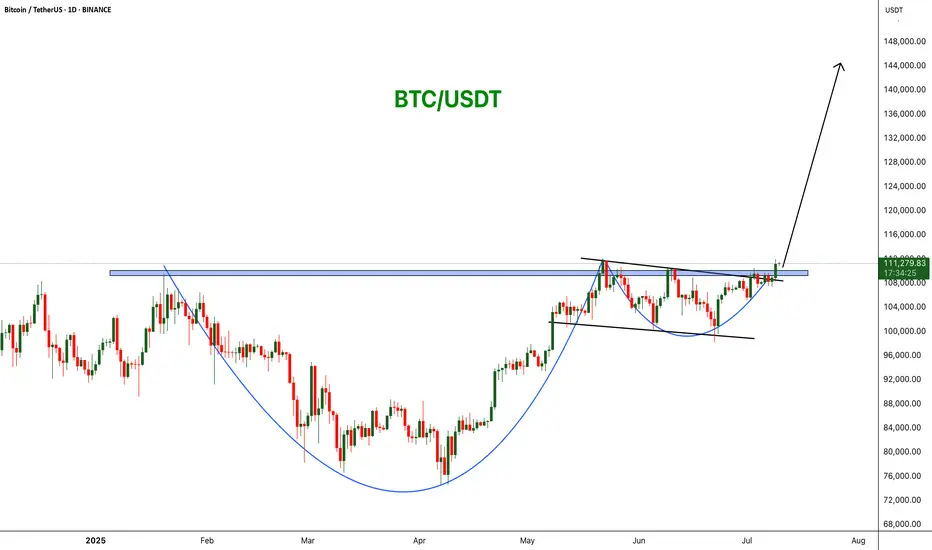
BTCUSDT: Cup and Handle Breakout! BINANCE:BTCUSDT is forming a powerful bullish breakout from a cup and handle pattern on the daily chart. Price has cleared key horizontal resistance around $110,000, signaling strength and the potential for a continuation move toward $144,444.
Stop Loss: $98K
Target : $144k
CRYPTOCAP:BTC
Hexatrades
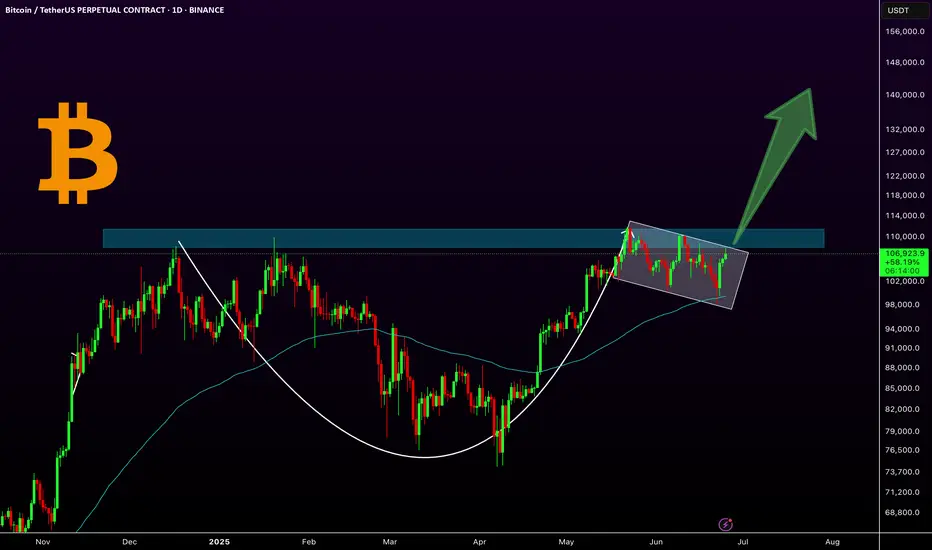
Bitcoin Bullish Flag Breakout Incoming?MARKETSCOM:BITCOIN is currently consolidating within a bullish flag pattern on the daily chart, following a strong impulse move from the $74,000 support zone marked in April. The price is hovering near a critical horizontal resistance zone ($ 108,000–$ 109,000), which has historically acted as a major barrier to further gains.
Technical Highlights:
Bullish Flag Pattern: Clear flag formation after a strong uptrend, suggesting continuation potential.
Strong Support Rebound: April's bounce from the ~$74K support zone marked a key higher low.
EMA: Price is currently trading above both the 50-day and 100-day EMAs — a bullish sign of momentum.
Breakout Potential: A confirmed breakout above the flag resistance (~$109K) could ignite a strong rally toward $130K+.
Breakout Move: If the flag pattern plays out, CRYPTOCAP:BTC could target the $125K–$135K zone in the coming weeks.
Buy Entry: Once the day candle closes above the flag resistance line

GRIFFAIN Chart Signals Bullish Rally$GRIFFAIN is forming a bullish ascending triangle pattern on the daily chart, signaling a potential breakout. Price is consolidating just below key resistance at $0.048, supported by a strong ascending trendline and a historical support zone.
A breakout above the triangle could trigger a sharp move toward the $0.15 level, offering a potential upside of over 100%-200%. The setup suggests growing bullish momentum and a possible trend reversal.
BITGET:GRIFFAINUSDT

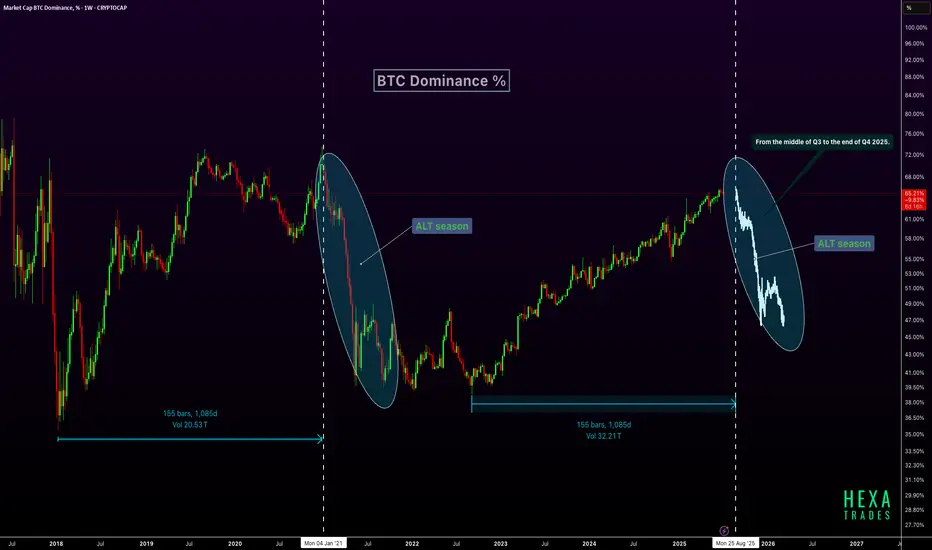
Altseason Ahead? BTC Dominance Cycle RepeatsBTC dominance is forming a pattern similar to the 2021 cycle, where dominance peaked after a long uptrend and then sharply declined, triggering a major altseason. Interestingly, that drop occurred after a 1,085-day rise, a time span we are once again approaching in 2025, projected to end around late August. If history repeats, BTC dominance could start declining from mid-Q3 2025, leading into a strong altcoin rally that may last through the end of Q4. This setup aligns with typical post-halving behavior, suggesting the final phase of the cycle could heavily favor altcoins.
CRYPTOCAP:BTC CRYPTOCAP:ETH CRYPTOCAP:XRP
Bitcoin Final Push: Cycle Top in Sight?Historically, the final two quarters of a Bitcoin cycle, especially in post-halving years, have shown strong bullish trends. This pattern played out in 2013, 2017, and 2021, where Q3 and Q4 delivered significant gains leading into cycle tops. With 2025 being the post-halving year and Q2 already showing strong performance, we may be setting up for a similar rally in Q3 and Q4 if history repeats.
CRYPTOCAP:BTC BITSTAMP:BTCUSD

SOLUSDT Bullish Flag Pattern!Price has formed a Bullish Flag pattern on the daily timeframe. After multiple touches of both support and resistance, the price has now broken out above the falg resistance, signaling a potential trend reversal. and price trading above 50 and 100 EMA
Currently, SOL is bouncing from the channel breakout level, indicating strong bullish momentum. A clean breakout candle confirms buying interest, and the setup favors a strong bullish continuation if the breakout sustains.
Entry: Above $150
Stop-loss: Below $135
CRYPTOCAP:SOL TRADENATION:SOLANA

BTC: A Classic Cup & Handle in Play!Bitcoin has formed a classic cup and handle pattern on the daily chart, with the 100 EMA providing solid support during the handle formation. Currently, the price is consolidating in what appears to be a bullish flag or extended handle, just below the key resistance zone around $109K. A breakout above this level could ignite a strong bullish rally toward higher targets like $144k.
Key Highlights:
-Cup & Handle pattern confirmed
-10 EMA acting as dynamic support
-Bullish flag/handle forming near resistance
- A breakout could lead to explosive upside
Regards
Hexa
CRYPTOCAP:BTC BITSTAMP:BTCUSD
ARCUSDT - Bullish Breakout Confirmed ARC has been trading in a well-defined descending channel for several weeks, forming a consistent downtrend. However, the price has now broken out of the channel resistance, signaling a potential bullish reversal.
Descending Channel Breakout: ARC has clearly broken above the channel’s upper trendline, indicating a shift in market structure from bearish to bullish.
Resistance Zone Flipped: The price broke through a recent horizontal resistance zone.
EMA: ARC is now trading above both the 50 EMA and 100 EMA,

BERAUSDT Bullish Wedge Breakout!BERAUSDT has been trading within a well-defined falling wedge pattern for the past several weeks, indicating a strong downtrend. However, recent price action shows a potential breakout from the upper trendline of the wedge, which could signal a bullish reversal.
Breakout Alert: Price has broken above the wedge resistance with strong bullish momentum.
EMA Confirmation: Price is pushing above the 50 and 100 EMAs, supporting a potential trend shift.

SPELLUSDT Descending ChannelSPELLUSDT Technical analysis update
SPELL price exceeded the resistance line of a descending channel pattern on the day chart, accompanied by high volume. While this could indicate potential upward movement in the coming days
Buy level: Below $0.00070
Stop loss : $0.00057
Regards
Hexa

APT at Historic Support – Massive Reversal Incoming?APTUSDT technical analysis update
APT has been trading inside a descending channel for over 900 days, and it's now once again testing the channel support. As shown in the chart, the price has bounced multiple times from this level, making it a historically strong support zone.
Currently, the target is the upper boundary of the channel (resistance). If APT manages to break out of this long-term descending channel, it could trigger a strong bullish move, possibly a moonshot.

1 Year of Bitcoin Bull Run Remaining? In the chart above, we’re analyzing Bitcoin’s historical cycles to see if the current cycle follows a similar pattern.
Bear Run (1 Year): In each of the last three cycles, Bitcoin experienced a bear market lasting exactly 1 year from the all-time high (ATH). This phase saw a significant drop in price as the market corrected.
Bull Run from Bottom (1,064 Days): In the last two cycles, once the bottom was established, Bitcoin entered a consistent bull market that lasted approximately 1,064 days. During this period, the price gradually climbed, eventually reaching new highs.
Current Bitcoin Cycle:
So far, the current cycle appears to be following the same pattern as previous cycles. We’ve already experienced a 1-year bear market after reaching the previous all-time high (ATH).
Currently, we have completed 2 years of a bull run from the bottom, aligning with the 1,064-day bull run observed in past cycles. Based on this historical pattern, we may have 1 year of bull run remaining, which could potentially push Bitcoin to new highs by late 2025.
If this trend continues, it suggests a strong opportunity for growth over the next year, mirroring the end phase of past cycles.
BINANCE:BTCUSDT BITSTAMP:BTCUSD CRYPTOCAP:BTC
Regards
Hexa

BTCUSDT: Bounce Incoming?BTCUSDT Technical analysis update
-March 2024 resistance is now expected to act as a strong support level.
-The price has touched the 0.618 Fibonacci retracement level, suggesting a potential reversal from this zone.
-The 200 EMA on the 2-day chart is positioned as a strong dynamic support, reinforcing the bullish case.
We can expect a bounce from the $72-75k level.

SEI Just Broke Out - Massive Rally Incoming?SEIUSDT Technical analysis update
SEIUSDT is testing a long-term descending trendline, which has acted as strong resistance on multiple occasions. Price has now broken above this level with strong volume, signaling a potential trend reversal. And price trading above 100 and 200 EMA, in the coming trading days, we can see a strong bullish move in SEI
NYSE:SEI

Ethereum Set for a Massive Pump!ETHUSDT Technical analysis update
ETH price has been trading within a channel pattern for the past 30 days, with the 100 and 200 EMA acting as strong support on the 4H chart. Therefore, the likelihood of the price dropping below the 100 and 200 EMA on the 4H chart is very low. Once the price breaks above the channel resistance, we can expect a strong bullish move in CRYPTOCAP:ETH
BITSTAMP:ETHUSD

Bitcoin's 215-Day Pattern: Another Breakout Loading?The Bitcoin chart shows a repeating pattern of consolidation lasting 215 days before each major upward breakout. This cycle has occurred multiple times over the past two years, with each accumulation zone followed by a strong bullish rally.
Currently, Bitcoin is once again emerging from a similar 215-day consolidation phase, suggesting the potential for another significant move to the upside if the pattern holds. If history repeats, we could see a target around $150K.
BINANCE:BTCUSDT CRYPTOCAP:BTC

BTC Correction Likely Before ATHBTCUSDT technical analysis update
BTC price could drop to the GETTEX:89K –$91K range before moving higher. There's a CME futures gap at $90.7K, which may act like a magnet. BTC has strong support around $90K and may see a small pullback before reaching a new all-time high.

THETAUSDT Bounce from Demand ZoneTHETAUSDT has once again respected its long-term support zone, . This area has acted as a reliable demand zone multiple times in the past, leading to strong upward moves. The recent bounce from this level indicates continued buyer interest and potential for a bullish reversal.
If the current momentum sustains, we could see a move toward the $2.00–$2.50 range in the coming months. As long as THETA holds above the support zone, the bias remains bullish.

SNXUSDT Bouncing from Channel SupportSNXUSDT Technical analysis update
SNXUSDT has been trading inside a clear descending channel for the last 1700 days. Recently, the price touched the lower support of the channel and is now showing signs of a bounce.
If the current momentum continues, SNX could move upward toward the upper resistance of the channel. A breakout above the upper trendline would be a strong bullish signal. Until then, the price may stay within the channel.
Price could move 100%-250% in a few months.

VANAUSDT Prepares for Bullish MoveVANUSDT Technical analsysis update
VANA has been forming a symmetrical triangle pattern over the past 90 days on the daily chart. A bullish move is expected once a breakout occurs. Additionally, a bullish MACD crossover happened a few days ago. Let's wait for a breakout above the triangle resistance for bullish confirmation.

MANAUSDT Huge Bounce Incoming?MANA is currently testing a long-term descending support trendline on the weekly chart. This level has acted as a reliable bounce zone multiple times in the past (highlighted with arrows).
-Price is holding above a major support level (~$0.21), showing signs of demand.
-Weekly RSI is forming a bullish divergence, with higher lows on RSI vs. lower lows on price — often a precursor to trend reversals.
-Previous touches on this trendline have led to significant rallies.

FLOKI at Key Support – Is a Bounce Coming?The price of FLOKI has dropped back to an important level where it used to face resistance before going up. Now, this same level is acting as support, which could lead to a bounce.
We also see a bullish divergence on the RSI, It often signals that selling is slowing down and a reversal might be coming.
If the price holds above this support zone, we might see a bounce toward the $0.09 to $0.11 area.
If the price breaks below the support, the idea may not work, so it’s important to manage risk.

PNUTUSDT Ready to Rally!PNUTUSDT Technical analysis update
PNUTUSDT is breaking out of a wedge pattern on the daily chart after three months of formation. We also observed a bullish RSI divergence in the daily timeframe, along with a MACD bullish crossover a few days ago. A 50–100% move could be seen in the mid-term.
