Copper dips continue to attract buyers.XCUUSD - Intraday - We look to Buy at 4.024 (stop at 3.984)
Selling posted in Asia.
The bullish engulfing candle on the daily chart is positive for sentiment.
Short term momentum is bearish.
A lower correction is expected.
We expect prices to stall close to our bespoke level (4.020).
Our profit targets will be 4.124 and 4.144
Resistance: 4.080 / 4.100 / 4.133
Support: 4.060 / 4.040 / 4.020
Please be advised that the information presented on TradingView is provided to Vantage (‘Vantage Global Limited’, ‘we’) by a third-party provider (‘Signal Centre’). Please be reminded that you are solely responsible for the trading decisions on your account. There is a very high degree of risk involved in trading. Any information and/or content is intended entirely for research, educational and informational purposes only and does not constitute investment or consultation advice or investment strategy. The information is not tailored to the investment needs of any specific person and therefore does not involve a consideration of any of the investment objectives, financial situation or needs of any viewer that may receive it. Kindly also note that past performance is not a reliable indicator of future results. Actual results may differ materially from those anticipated in forward-looking or past performance statements. We assume no liability as to the accuracy or completeness of any of the information and/or content provided herein and the Company cannot be held responsible for any omission, mistake nor for any loss or damage including without limitation to any loss of profit which may arise from reliance on any information supplied by Signal Centre.
Hg1

CopperCopper looking to start the 5th wave of the C wave of the super cycle degree here IMO. Should hit around $7.50

Copper Futures ( HG1! ), H4 Potential for Bearish DropTitle: Copper Futures ( HG1! ), H4 Potential for Bearish Drop
Type: Bearish Drop
Resistance: 4.2215
Pivot: 4.1205
Support: 3.9245
Preferred case: Looking at the H4 chart, my overall bias for HG1! is bearish due to the current price being below the Ichimoku cloud , indicating a bearish market.
Expecting price to continue heading down towards the support at 3.9245, where the overlap support is.
Alternative scenario: Price could head up towards the resistance at 4.2215, where the overlap resistance is.
Fundamentals: There are no major news.

Copper showing mixed signals with Bullish bias to $4.80Cup and Handle formed on Copper
Price >200 Bullish
21>7 Bearish
RSI <50
Target $4.80
Mixed - Bullish bias
Resources definitely showing upside to come in the medium term, but right now there is a but of a breather which is causing a bit of selling pressure. We need to weather through this sideways range before the market chooses a direction. My bias is up but there needs to be the next catalyst. Also the US Dollar is showing short term strength which is also not great for resources as resources is priced in US dollars. and so when US strengthens the price for resources become less profitable for imports to countries.

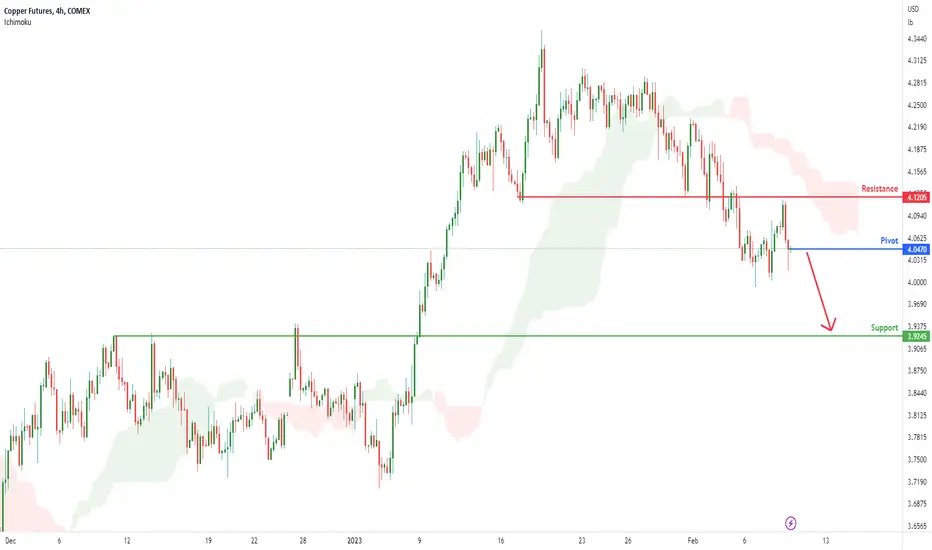
Copper Futures ( HG1! ), H4 Potential for Bearish DropTitle: Copper Futures ( HG1! ), H4 Potential for Bearish Drop
Type: Bearish Drop
Resistance: 4.1205
Pivot: 4.0470
Support: 3.9245
Preferred case: Looking at the H4 chart, my overall bias for HG1! is bearish due to the current price being below the Ichimoku cloud , indicating a bearish market.
Expecting price to continue heading down towards the support at 3.9245, where the overlap support is.
Alternative scenario: Price could head up towards the resistance at 4.1205, where the overlap resistance is.
Fundamentals: There are no major news.
Copper bulls to return around $4.00?Price action on copper has caught our eye, as its pullback from the YTD highs has paused above the November highs despite a surging US dollar. RSI (2) is overbought on the daily chart, and yesterday’s Doji held above the 20-day EMA. It's also holding above $4.00, whilst money managers and large speculators have continued to increase their net-long exposure to copper futures despite the pullback on prices.
- From here, the bias is bullish above 3.95 and for prices to have another crack at the YTD high
- Another approach is to scale into such a position with a wider stop, with a view to increase exposure if or when momentum turns higher sufficiently enough to call a swing low.

Copper Futures ( HG1! ), H4 Potential for Bearish DropTitle: Copper Futures ( HG1! ), H4 Potential for Bearish Drop
Type: Bearish Drop
Resistance: 4.2300
Pivot: 4.1165
Support: 3.9245
Preferred case: Looking at the H4 chart, my overall bias for HG1! is bearish due to the current price being below the Ichimoku cloud , indicating a bearish market.
Expecting price to continue heading down towards the support at 3.9245, where the overlap support is.
Alternative scenario: Price could head up towards the resistance at 4.2300, where the overlap resistance is.
Fundamentals: There are no major news.

Copper potential for bearish drop to overlap supportLooking at the H4 chart, my overall bias for HG1! is bearish due to the current price being below the Ichimoku cloud, indicating a bearish market.
Looking for a sell entry at 4.1165, where the overlap resistance is. Stop loss will be at 4.2065, where the overlap resistance is. Take profit will be at 3.9335, where the overlap support is.
Please be advised that the information presented on TradingView is provided to Vantage (‘Vantage Global Limited’, ‘we’) by a third-party provider (‘Everest Fortune Group’). Please be reminded that you are solely responsible for the trading decisions on your account. There is a very high degree of risk involved in trading. Any information and/or content is intended entirely for research, educational and informational purposes only and does not constitute investment or consultation advice or investment strategy. The information is not tailored to the investment needs of any specific person and therefore does not involve a consideration of any of the investment objectives, financial situation or needs of any viewer that may receive it. Kindly also note that past performance is not a reliable indicator of future results. Actual results may differ materially from those anticipated in forward-looking or past performance statements. We assume no liability as to the accuracy or completeness of any of the information and/or content provided herein and the Company cannot be held responsible for any omission, mistake nor for any loss or damage including without limitation to any loss of profit which may arise from reliance on any information supplied by Everest Fortune Group.

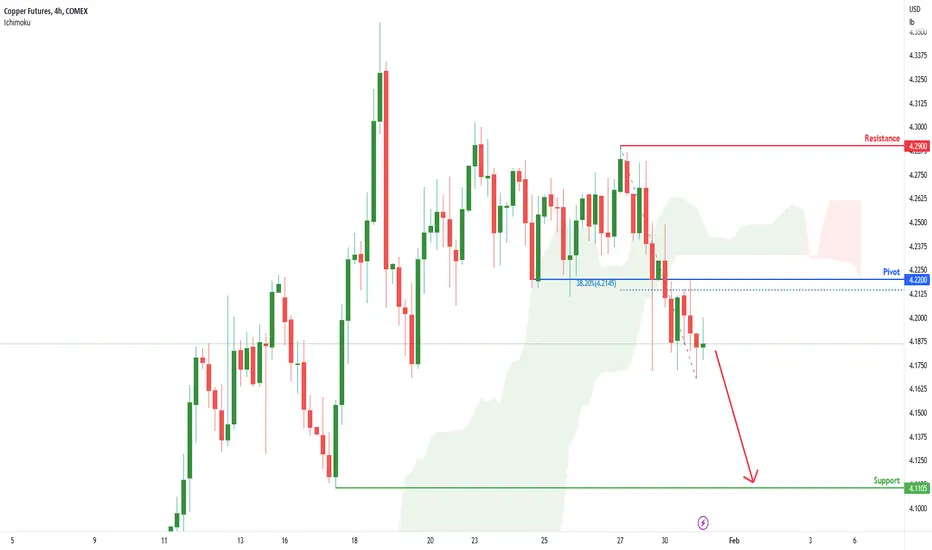
Copper Futures ( HG1! ), H4 Potential for Bearish DropTitle: Copper Futures ( HG1! ), H4 Potential for Bearish Drop
Type: Bearish Drop
Resistance: 4.2900
Pivot: 4.2200
Support: 4.1105
Preferred case: Looking at the H4 chart, my overall bias for HG1! is bearish due to the current price being below the Ichimoku cloud, indicating a bearish market.
Expecting price to continue heading down towards the support at 4.1105, where the previous swing low is.
Alternative scenario: Price could head up down to retest the pivot at 4.2200, where the 38.2% Fibonacci line is.
Fundamentals: There are no major news.
Copper to see a breakdown?XCUUSD - Intraday - We look to Sell a break of 4.209 (stop at 4.249)
We are trading at overbought extremes.
Although the bulls are in control, the stalling positive momentum indicates a turnaround is possible.
A break of the recent low at 4.221 should result in a further move lower.
Reverse trend line resistance can be seen at 4.290.
A Doji style candle has been posted from the high.
Our profit targets will be 4.109 and 4.089
Resistance: 4.270 / 4.305 / 4.330
Support: 4.250 / 4.220 / 4.180
Please be advised that the information presented on TradingView is provided to Vantage (‘Vantage Global Limited’, ‘we’) by a third-party provider (‘Signal Centre’). Please be reminded that you are solely responsible for the trading decisions on your account. There is a very high degree of risk involved in trading. Any information and/or content is intended entirely for research, educational and informational purposes only and does not constitute investment or consultation advice or investment strategy. The information is not tailored to the investment needs of any specific person and therefore does not involve a consideration of any of the investment objectives, financial situation or needs of any viewer that may receive it. Kindly also note that past performance is not a reliable indicator of future results. Actual results may differ materially from those anticipated in forward-looking or past performance statements. We assume no liability as to the accuracy or completeness of any of the information and/or content provided herein and the Company cannot be held responsible for any omission, mistake nor for any loss or damage including without limitation to any loss of profit which may arise from reliance on any information supplied by Signal Centre.

Copper futures could drop like a rock to $1.94The retracement in wave (X) (orange) could be over as it reached 61.8% of wave (W).
It unfolds in a triple three WXYXZ (yellow).
Y and Z are greater than W, which is healthy.
The target is the previous valley of Jan 2016 at $1.94.
At this target point the wave (Y) will reach the distance of 1.272 of wave (W), which is Fibonacci ratio.

Copper's momentum has changed.XCUUSD - Intraday - We look to Sell a break of 4.099 (stop at 4.139)
Our bespoke support of 4.130 has been clearly broken.
Offers ample risk/reward to sell at the market.
We look for losses to be extended today.
Short term bias has turned negative.
Our profit targets will be 3.999 and 3.979
Resistance: 4.130 / 4.160 / 4.185
Support: 4.075 / 4.030 / 3.990
Please be advised that the information presented on TradingView is provided to Vantage (‘Vantage Global Limited’, ‘we’) by a third-party provider (‘Signal Centre’). Please be reminded that you are solely responsible for the trading decisions on your account. There is a very high degree of risk involved in trading. Any information and/or content is intended entirely for research, educational and informational purposes only and does not constitute investment or consultation advice or investment strategy. The information is not tailored to the investment needs of any specific person and therefore does not involve a consideration of any of the investment objectives, financial situation or needs of any viewer that may receive it. Kindly also note that past performance is not a reliable indicator of future results. Actual results may differ materially from those anticipated in forward-looking or past performance statements. We assume no liability as to the accuracy or completeness of any of the information and/or content provided herein and the Company cannot be held responsible for any omission, mistake nor for any loss or damage including without limitation to any loss of profit which may arise from reliance on any information supplied by Signal Centre.

Copper to see a higher correction.XCUUSD - Intraday - We look to Sell a break of 4.128 (stop at 4.168)
Although the bulls are in control, the stalling positive momentum indicates a turnaround is possible.
A higher correction is expected.
A break of the recent low at 4.130 should result in a further move lower.
50 2hour EMA is at 4.129.
Bearish divergence is expected to cap gains.
Our profit targets will be 4.028 and 4.018
Resistance: 4.200 / 4.223 / 4.250
Support: 4.165 / 4.150 / 4.130
Please be advised that the information presented on TradingView is provided to Vantage (‘Vantage Global Limited’, ‘we’) by a third-party provider (‘Signal Centre’). Please be reminded that you are solely responsible for the trading decisions on your account. There is a very high degree of risk involved in trading. Any information and/or content is intended entirely for research, educational and informational purposes only and does not constitute investment or consultation advice or investment strategy. The information is not tailored to the investment needs of any specific person and therefore does not involve a consideration of any of the investment objectives, financial situation or needs of any viewer that may receive it. Kindly also note that past performance is not a reliable indicator of future results. Actual results may differ materially from those anticipated in forward-looking or past performance statements. We assume no liability as to the accuracy or completeness of any of the information and/or content provided herein and the Company cannot be held responsible for any omission, mistake nor for any loss or damage including without limitation to any loss of profit which may arise from reliance on any information supplied by Signal Centre.

HG1! Potential for Bullish Continuation Looking at the H4 chart, my overall bias for HG1! is bullish due to the current price being above the Ichimoku cloud , indicating a bullish market. Looking for a pullback buy entry at 3.9335, where the 23.6% Fibonacci line is. Stop loss will be at 3.7085, where the recent low is. Take profit will be at 4.4555, where the 88% Fibonacci line is.
Please be advised that the information presented on TradingView is provided to Vantage (‘Vantage Global Limited’, ‘we’) by a third-party provider (‘Everest Fortune Group’). Please be reminded that you are solely responsible for the trading decisions on your account. There is a very high degree of risk involved in trading. Any information and/or content is intended entirely for research, educational and informational purposes only and does not constitute investment or consultation advice or investment strategy. The information is not tailored to the investment needs of any specific person and therefore does not involve a consideration of any of the investment objectives, financial situation or needs of any viewer that may receive it. Kindly also note that past performance is not a reliable indicator of future results. Actual results may differ materially from those anticipated in forward-looking or past performance statements. We assume no liability as to the accuracy or completeness of any of the information and/or content provided herein and the Company cannot be held responsible for any omission, mistake nor for any loss or damage including without limitation to any loss of profit which may arise from reliance on any information supplied by Everest Fortune Group.

Copper rally to be capped.XCUUSD - Intraday - We look to Sell at 4.185 (stop at 4.230)
With signals for sentiment at overbought extremes, the rally could not be extended.
Although the bulls are in control, the stalling positive momentum indicates a turnaround is possible.
Early optimism is likely to lead to gains although extended attempts higher are expected to fail.
We look for a temporary move higher.
Our profit targets will be 4.075 and 4.055
Resistance: 4.160 / 4.187 / 4.250
Support: 4.150 / 4.080 / 4.030
Please be advised that the information presented on TradingView is provided to Vantage (‘Vantage Global Limited’, ‘we’) by a third-party provider (‘Signal Centre’). Please be reminded that you are solely responsible for the trading decisions on your account. There is a very high degree of risk involved in trading. Any information and/or content is intended entirely for research, educational and informational purposes only and does not constitute investment or consultation advice or investment strategy. The information is not tailored to the investment needs of any specific person and therefore does not involve a consideration of any of the investment objectives, financial situation or needs of any viewer that may receive it. Kindly also note that past performance is not a reliable indicator of future results. Actual results may differ materially from those anticipated in forward-looking or past performance statements. We assume no liability as to the accuracy or completeness of any of the information and/or content provided herein and the Company cannot be held responsible for any omission, mistake nor for any loss or damage including without limitation to any loss of profit which may arise from reliance on any information supplied by Signal Centre.

Fibonacci Retracement on CopperCOMEX:HG1!
Fibonacci Retracement applied on daily timeframe of COMEX:HG1! suggests that it will rally towards 4.47 after crossing 4.16 as strong candlesticks are being made.

XCUUSD ( COPPER / USD ) Commodities Analysis 10/01/2023Fundamental Analysis:
china is the biggest copper consumer and as of now we can see the most of its manufacturing plants and factories are getting shut due to Protests and ongoing havoc in the country.
DXY is very bullish which can go up to 130 and ultimately will result in the more price fall in the commodity sections.
World economic Crisis and Supply chain Disturbance which will lead to the Manufacturing Halt.
Technical Analysis:
Bearish Divergence of Price and MACD,
Hidden Bearish Divergence Formation in the process which is a very strong Bearish Trend continuation sign.
Nest Resistance and Potential Pivot Point 9500$
lower Support at 8450%
Bearish Targets: 5800$, 5250$, 4300$

#DR copper broken solid resistance and back above 200dmaHard to be bearish on global markets when probably the biggest proxy for growth is showing really strong technical action. Dr Copper has broken out its triangle which has kept price action constrained and under the 200dma for the better part of 2 months. It has now also broken above the 200day moving average with higher targets in play

HG1! Potential For Bullish ContinuationLooking at the H4 chart, my overall bias for HG1! is bullish due to the current price being above the Ichimoku cloud, indicating a bullish market. Looking for a pullback buy entry at 3.9335, where the 23.6% Fibonacci line is. Stop loss will be at 3.7085, where the recent low is. Take profit will be at 4.4555, where the 88% Fibonacci line is.
Please be advised that the information presented on TradingView is provided to Vantage (‘Vantage Global Limited’, ‘we’) by a third-party provider (‘Everest Fortune Group’). Please be reminded that you are solely responsible for the trading decisions on your account. There is a very high degree of risk involved in trading. Any information and/or content is intended entirely for research, educational and informational purposes only and does not constitute investment or consultation advice or investment strategy. The information is not tailored to the investment needs of any specific person and therefore does not involve a consideration of any of the investment objectives, financial situation or needs of any viewer that may receive it. Kindly also note that past performance is not a reliable indicator of future results. Actual results may differ materially from those anticipated in forward-looking or past performance statements. We assume no liability as to the accuracy or completeness of any of the information and/or content provided herein and the Company cannot be held responsible for any omission, mistake nor for any loss or damage including without limitation to any loss of profit which may arise from reliance on any information supplied by Everest Fortune Group.

HG1! Potential For Bullish ContinuationLooking at the H4 chart, my overall bias for HG1! is bullish due to the current price being above the Ichimoku cloud, indicating a bullish market. Looking for a pullback buy entry at 3.9280, where the 23.6% Fibonacci line is. Stop loss will be at 3.7085, where the recent swing low is. Take profit will be at 4.2575, where the 78.6% Fibonacci line is.
Please be advised that the information presented on TradingView is provided to Vantage (‘Vantage Global Limited’, ‘we’) by a third-party provider (‘Everest Fortune Group’). Please be reminded that you are solely responsible for the trading decisions on your account. There is a very high degree of risk involved in trading. Any information and/or content is intended entirely for research, educational and informational purposes only and does not constitute investment or consultation advice or investment strategy. The information is not tailored to the investment needs of any specific person and therefore does not involve a consideration of any of the investment objectives, financial situation or needs of any viewer that may receive it. Kindly also note that past performance is not a reliable indicator of future results. Actual results may differ materially from those anticipated in forward-looking or past performance statements. We assume no liability as to the accuracy or completeness of any of the information and/or content provided herein and the Company cannot be held responsible for any omission, mistake nor for any loss or damage including without limitation to any loss of profit which may arise from reliance on any information supplied by Everest Fortune Group.

Copper Futures (HG1!), H4 Potential for Bearish DropTitle: Copper Futures (HG1!), H4 Potential for Bearish Drop
Type: Bearish Drop
Resistance: 3.9600
Pivot: 3.6885
Support: 3.5545
Preferred case: Looking at the H4 chart, my overall bias for HG1! is bearish due to the current price being below the Ichimoku cloud , indicating a bearish market. If this bearish momentum continues, expect price to head back down towards the pivot at 3.6885 where the 61.8% Fibonacci line is.
Alternative scenario: Price may possibly head towards the resistance at 3.9600, where the previous swing high is.
Fundamentals: There are no major news.

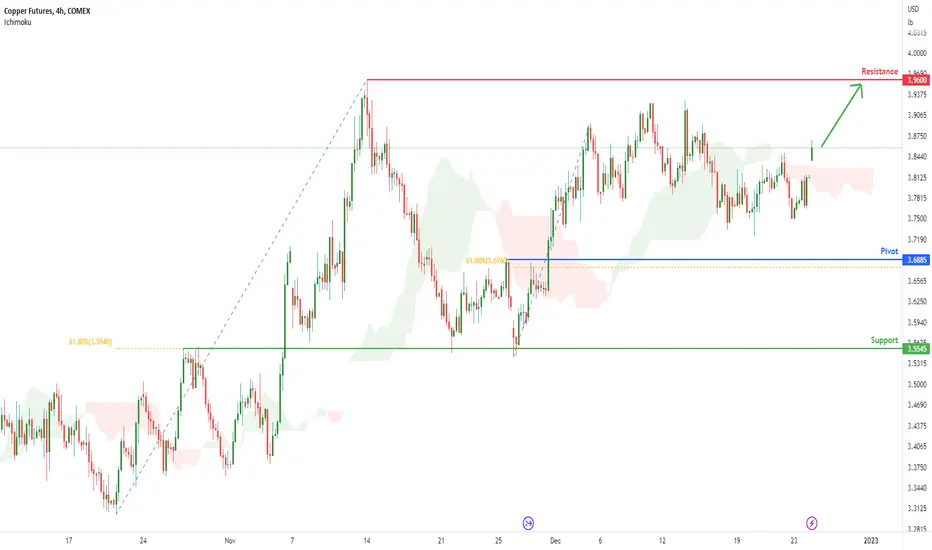
Copper Futures (HG1!), H4 Potential for Bullish RiseTitle: Copper Futures (HG1!), H4 Potential for Bullish Rise
Type: Bullish Rise
Resistance: 3.9600
Pivot: 3.6885
Support: 3.5545
Preferred case: Looking at the H4 chart, my overall bias for HG1! is bullish due to the current price being above the Ichimoku cloud , indicating a bullish market. If this bullish momentum continues, expect price to possibly head towards the resistance at 3.9600, where the previous swing high is.
Alternative scenario: Price may head back down towards the pivot at 3.6885 where the 61.8% Fibonacci line is.
Fundamentals: There are no major news.

Copper Futures (HG1!), H4 Potential for Bullish RiseTitle: Copper Futures (HG1!), H4 Potential for Bullish Rise
Type: Bullish Rise
Resistance: 3.9600
Pivot: 3.6885
Support: 3.5545
Preferred case: Looking at the H4 chart, my overall bias for HG1! is bullish due to the current price being above the Ichimoku cloud, indicating a bullish market. If this bullish momentum continues, expect price to possibly head towards the resistance at 3.9600, where the previous swing high is.
Alternative scenario: Price may head back down towards the pivot at 3.6885 where the 61.8% Fibonacci line is.
Fundamentals: There are no major news.