NZDUSD Hidden Negative Divergence Suggests More DownNZDUSD hidden negative divergence suggests that the NZD will move down further and
this is not the bottom. Bulls are thinking
'great, double bottom" but this suggests there the NZD remains weak and the selloff should likely continue.
We need a conter trend candle (a red candle)to confirm the entry point. Stops: 20 pips or so stop.
We are aiming for a lower low
Just wait for confirmation.
Hidden Bearish RSI Divergence

Nas100 Hidden Negative DivergenceAs it states in the title, hidden negative divergence for the Nas100.

Hidden Bearish Divergence on the Weekly BTC Dom. ChartI expect BTC Dominance to retest 48%, then get rejected and breakdown from its range. The support is at 35%, which means that in the 3-5 months that follow this breakdown, the Alts will outperform BTC by 13%.

What is Hidden Bearish Divergence?Price rises to lower highs when RSI rising, hence 'hidden divergence'; RSI looks bullish but price remains bearish, each rally a bulltrap.
Some of these rallies can get pretty fierce, shaking bears loose and sending shorts for cover. Then the trend resumes, trapping bulls.
These bear market whipsaws just kill all the players. When you're in these, you get the feeling; "I just can't win for losing!" ... all traps.

BTC Hidden DivergenceBulls thinking "wow! what a discount". But this is
just more of the same and bulls haven't learned a thing.
Hidden bearish divergence suggests this will continue to fall.

AUDUSD Hidden Bearish DivergenceHidden bearish divergence suggests that the AUDUSD will resume the
larger trend down and we have not bottomed yet. A new low? We can't not say.
This is not a buy here. Most instruments are showing similar divergences.

Tue 14th Jun 2022 XAU/USD (Gold) Daily Forex Chart Sell SetupGood morning fellow traders. On my Daily Forex charts using the High Probability & Divergence trading methods from my books, I have identified a new trade setup this morning. As usual, you can read my notes on the chart for my thoughts on this setup. The trade being a XAU/USD (Gold) Sell. Enjoy the day all. Cheers. Jim

NZDUSD Hidden Negative Divergence Hidden negative divergence suggests that the NZDUSD will resume the larger trend
lower. A similar condition is happening in the AUSDUSD.

Fri 10th Jun 2022 XAG/USD (Silver) Daily Forex Chart Sell SetupGood morning fellow traders. On my Daily Forex charts using the High Probability & Divergence trading methods from my books, I have identified a new trade setup this morning. As usual, you can read my notes on the chart for my thoughts on this setup. The trade being a XAG/USD (Silver) Sell. Enjoy the day all. Cheers. Jim

Fri 10th Jun 2022 EUR/USD Daily Forex Chart Sell SetupGood morning fellow traders. On my Daily Forex charts using the High Probability & Divergence trading methods from my books, I have identified a new trade setup this morning. As usual, you can read my notes on the chart for my thoughts on this setup. The trade being a EUR/USD Sell. Enjoy the day all. Cheers. Jim

AUDUSD Hidden Divergence Suggests PullbackWe may be in a longer term trend change but pullbacks are
not a good time to buy and possibly trade short instead.
This 4hr hidden divergence suggests that AUD will pullback
and we can wait for the 4hr Stochastic RSI to set up
a new buy signal in the near future. For now this is
a sell or wait patiently for the buy set up.

LINKUSDT Fibonacci 88.6% - 78.6% updateThe price is revisiting the Fibonacci Retracement short zone at 88.6%-78.6% range showing candlestick weak in a bearish hidden divergence with Fisher Transform and Awesome oscillator, facing great selling pressure, forming bearish pivot point to a short recharging.

Hidden Bearish Divergence on TwitterThe setup for Facebook is still looking quite Bullish as it's double bottomed and Reacted at the PCZ of the Bullish Cypher that can be seen in the related tab it's currently targeting a Gapfill to the upside; However Twitter is starting to look quite Bearish on the 4 hour and if it starts going down from here it will have confirmed Hidden Bearish Divergence on the Weekly which could very well send Twitter down to Fill the downside Gap at the very least but at the most it could go down all the way to the 88.6% Retracement.

$MCD Short Unhappy MealLook for an entry between 250-253
Approaching bullish trend resistance. Bearish Divergence on the Daily time frame.
Entry $252.25
TP 1 $248.24
TP 2 $246.15
TP 3 $242.40

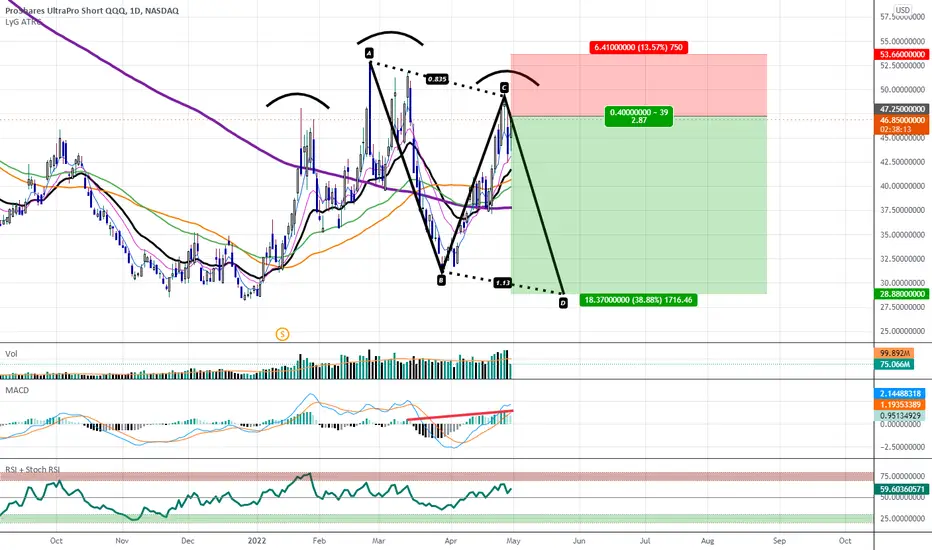
Potential Right Shoulder with Hidden Bearish Divergence on SQQQI will be Selling Monthly and Quarterly Calls against the SQQQ at the $47.5 Strike as well as using this chart to establish a Bullish Bias on other trades.
DAX Week ahead. High probability!!!Hello Traders
Here is an idea to trade the German Index next week.
Last Wednesday we saw a break through the neckline. If someone missed this chance to go short, there will be another two chances next week. One at the resistance between 14300 & 14330 and the second at 14200. TP is at 13700 - 13750.
Good Trades!!!

$APE COIN (Bored Ape Yachts) Short Scalp 20% ProfitCongrats to those who continued to hold on to this short signal. We might see it bounce from the 0.618 level in which case I might be long on this coin and I do see a hidden bullish divergence on the RSI
Move SL in front of the entry and remember to book some profits!

BP: Rising Wedge with MACD Hidden Bearish DivergenceWe are trying to hold a demand line of a rising wedge pattern but are showing clear Hidden Bearish Divergence on the Daily and are likely to rollover rather than hold and upon breaking down one would expect it to come down to fill the gap below us at around $15.50

SPY Continued Downside - Hidden DivergenceChart Even t: Bearish Divergences on multiple timeframes. Rising wedge pattern on 65m and lower timeframes.
Confluence : Bearish Divergence on 65m timeframe. Hidden Bearish Divergence on daily timeframe. Rising Wedge pattern (bearish) on 65m and lower timeframes. MACD very wide. Volume decreasing. Death Cross moving average event occurred a few days ago. Price action is nearing old resistance levels along with the 61.8% Fibonacci Retracement level. RSI overbought on 65m timeframe.
Trade Idea : Put Swings
Contract Suggestions (depending on Monday's open) :
Best: 4/8/22 450P
Riskier 4/6/22 450P
Riskiest 4/1/22 450P
I will likely buy both the 4/8 and the 4/1 contracts, heavily weighted to the 4/8 contracts to allow this time for this move to play out.

SLP DivergencesWe have a hidden bearish divergence in the 1H TF. We might dip back to 0.0192 and from there we will bounce back to 0.0201. From a bigger perspective we have a hidden bullish divergence growing stronger and stronger. After the small dip we might go back to 0.0216 and if the candle closes above 0.0216, SLP will go back to 0.0238 and possibly higher up to 0.0252 and 0.0280.

DXY: Potential 3 Falling Peaks with Hidden Bearish DivergenceThe US Dollar Currency Index is showing a Potential 3 Falling Peaks Pattern on the 4 hour and is showing signs of Hidden Bearish Divergence on the MACD; If it breaks below the Previous Low represented by the orange horizontal line on the chart and doesn't make a higher high then it's target will be the .886 retrace below between the areas of 95 and 94.

Watch Ya Dolla Dolla Bills YallLooking at the idea of a head and shoulders forming here for the dollar. Larger timeframes such as the two week timeframe are beginning to form hidden bearish divergence and will eventually need to come back down and reset

SLPWe might dip back to 0.0170 and most likely bounce from there. We might reach levels back to 0.0185 and possibly 0.0190. RSI resistance is being retested, we will know if we will bounce back or dip back inside the RSI triangle. We might also dip lower than 0.0170 which is 0.0162 due to the hidden bearish divergence.
- Hidden Bearish Divergence
- RSI resistance being retested once again
- Bearish Butterfly Pattern
