SLP Bullish butterfly pattern appearing at 1H TF. We might bounce back again back to 0.0172 and retest the resistance. There is also a chance of a dip due to another hidden bearish divergence in the chart. If RSI goes below the green line then we might dip to 0.0155 or lower. As long as we stay above the green line in the RSI levels, SLP is still bullish.
Hidden Bearish RSI Divergence

SLP UpdateWe've expected the dip to 0.0165 and lower than that. Hidden bearish divergence appearing at 1H TF. We might dip more to below 0.0152 or possibly lower. From there it is a possible bounce play to go back to 0.0165. If we break the RSI resistance levels we will most likely retest the resistance of the falling wedge pattern which is around 0.0172.

Thu 3rd Mar 2022 NZD/CAD Daily Forex Chart Sell SetupGood morning fellow traders. On my Daily Forex charts using the High Probability & Divergence trading methods from my books, I have identified a new trade setup this morning. As usual, you can read my notes on the chart for my thoughts on this setup. The trade being a NZD/CAD Sell. I'm leaving the remaining partial Buy trade on but have brought its stop up to lock in a little more profit. Enjoy the day all. Cheers. Jim

Andrews pitchforkPrice exited from the upgoing channel, and shows indications of weakness,
as well as there is hiddden divergence (price went down but ossilator went up )which means the contuniations of weakness of price,
at the result: a selling opportunity can emerge if local countertrendline breaks.

Dow Jones Hidden Bearish DivergenceI saw a Hidden Bearish Divergence on the DJ30 movement. This moment shows the price has potential to continue the bearish movement. there is
small support at point 35539.2. So I will assume the price will reach the support area.

Inverted/reverse cup and handle pattern - BTCThis could have been either a H&S or Inverted Cup & Handle.
Either way, confirmation of this pattern with a breakout below 59k could see a measured downside move to high 48's.
This matches up precisely with the 38.2% Fib from the JUL low, and would be a perfect re-test of the medium term trend & 2/1 Gann line. By the time it gets there, it will be a good bounce on the 200 EMA also.
All this coupled with yesterday's confirmation of Hidden Bearish Divergence on the monthly RSI points to a decent pull back end point.
The completion of a Minor wave 1 down would be confirmed by a strong bounce at this level. Further confirmation of a downside Minor 5 wave will be found at the possible top of wave 2, back up at resistance in the low-mid 60's.
If the downside pattern ends up being invalidated later on, this bounce point at 48-50 is still likely in the mean time.
We'll See.

Monthly RSI Hidden Bearish Divergence confirmation.Lets not forget this little bad boi either!
Hidden divergence is indeed considered an indication of trend continuation, but have a look at the bigger picture here.
Eeeeeeven if BTC remains bullish on the macro trend, this confirmation of hidden bearish divergence could see a comparatively massive pullback. This would fit the "Expanded Flat" paradigm mentioned in my other post today. After a redonkulous 91 level on the monthly RSI one could expect the old dog might be a bit clapped out and in need of a rest.
With 2 touches on each side, Bitty appears to be in a positively gigantic Ascending Broadening Wedge. A 3rd tap on macro trend support due to Hidden Bearish Divergence could see the asset return to 15 or 20k... or LESS!
The Ascending Broadening Wedge is known to be a continuation pattern, so if this scenario plays out the measured upside move is astronomical. But honestly, this will take years and years and years. A lot can happen to change the course of history in that time, so who knows!?
Food for thought anyway.

NDX/SPY Continues to look like a bull trapI have been watching this formation develop for what feels like a year now and it is slowly grinding its way through and it seems we are finally on the verge of having the performance begin
Generally speaking, since the dotcom crash NDX has gone up faster than SPY and so that has made it the bet for people to "just by the index" to make their gains. But now with this long term pattern forming it is signaling that NDX isn't the main bet to make. There are two main propositions from this formation: either SPY will start to outperform NDX to the upside or given the situation of the broader markets, NDX is going to lead the charge downward in a recession. Given how much negativity we see in the system combined with the topping pattern I think it will be the downside.
If you compare the NDX/SPY chart to NDX you can see that these top formations on the pair do predict a dip on NDX. So far these dips on NDX have been great buying opportunities because they have been higher lows. Eventually NDX is going to print a lower low. After that lower low we are at risk for a lower high and that sets the bearish trend.
Imbedded in the fib extension on the main chart is the notion that we are facing an ABC correction on NDX/SPY and we will see a C wave that is 1.618 or greater than the length of Wave A. If we look at the chart the last bit of serious price action has been between the 2.618 and 3 extension levels and so over the course of the next leg down I will be watching for NDX/SPY to chop its way down there for another consolidation.
I am not sure most people are emotionally prepared for the long term targets. I have been watching for it and I am not sure I am emotionally prepared for this. People that buy the index to hold, whether it be retirement accounts or something else might not get to break even for over a decade. Last time NDX/SPY had a bull trap NDX went down 80% from here. Here is the annoying thing, both NDX and the pair had a bull trap. Right now NDX has just got done setting an all time high. If both the NDX/SPY pair and NDX were both looking at bull traps I think more people would take this seriously.
Lots of questions remain unanswered if the broad conclusion of this post is correct. Will any bear market still be multi-year? What will happen to the money supply generally? Interest rates? All hard to predict if anything resembling the scope of what I think will happen will happen.

Weekly Crossing Below The 55SMA With Hidden Bearish DivergenceThe Weekly has gone below the 55 Week SMA and has closed below it. Now we look to have some Hidden Bearish Divergence on the MACD and the RSI is going below the 50 line which signals the beginning of a downtrend.

Hidden Bearish Divergence Before Potential Breakdown Of TriangleLets see if we can reverse off the bearish divergence then break through the triangle from here. Nice risk to reward from shorting at this level.
Volume and MACD situation on BTC shows signs of weaknessVolume is used to confirm our biases on chart patterns and trends and lots of studies are done on how different chart formations are confirmed with volume. Likewise when looking for a breakout people often look at the volume to consider if it will be maintained or if a chance of throwback is likely. Generally people look at volume by time and the OBV does that well.
On Balance Volume
Many volume analysis look for bullish or bearish divergences and you can also put some moving averages on the volume to see what is going on for the last so many periods. Here I have the 10, 20 and 100. Much like any moving averages crosses can provide useful signals. This volume situation is pretty bearish. Price has to go a long way to the upside for the OBV to get above the 100 EMA long enough for the 10 and 20 to get above the 100 again and complete a bullish stack.
Significant rallys are possible with the OBV below the 100 and the OBV, 10 and 20 can do a lot of braiding and changing of position but large dumps are very probable afterwards.
It also a bearish sign that the on balance volume is setting a lower high while price action is setting a higher high with some of these topping candles. The candlestick pattern isn't complete yet but it is staged bearish.
Volume Profile Visible Range
Right now price is stalling at this volume node. It isn't particularly large but it does coincide with previous support around %49.5k and the 0.786 fib retracement level (not shown). The center of the next node of volume support is lower than many analysts I listen to are calling at about $35k To me that isn't a solid target despite it being the top of the Value area as both major trendlines I see that could provide support are way benign that.
The MACD
The MACD is showing a lot of hidden bearish Divergence. The main chart does a decent job but below is the MACD settings developed by Mr. Asprey after he did some tinkering. I have split the histogram and signal line into two different charts to view the divergence more easily. Both are very divergent. This is important because hidden bearish divergence is the best indicator that a bull trap is in play.
I was using hidden bearish divergence when I was predicting a bigger spill than most prior to the dump in early May on the daily chart. Once again the chart is the MACD-AS with the signal and histogram separated. It does not take a lot to rip a uptrend to shreds.
Closing thoughts
Lots of things look bullish. On chain metrics look bullish with the Hash ribbons flashing a buy. People looking at commitment of traders also see a lot of buy interest. Lots of coins have been taken off of exchanges. All these things are generally fundamentally bullish. But the Volume situation does not seem to back up some of the fundamental bullishness. The MACD is also in a vulnerable situation. All this makes analysis complicated. We might see a vicious sell off and a rapid rebuy like the Covid 19 dump. We might see lots of people loose interest in BTC specifically while other coins stay strong.
Truth be told I am pretty uncomfortable with the disagreement in the charts and the fundamental analysis. Makes me think I am missing something and I don't like it. But right now it seems to be a bad time to be recklessly long to me. I do have a small position on short with a low level of leverage.

Bearish Bat PCZ ReachedWe have 3 Hour Bearish Divergence and Hidden bearish Divergence at the PCZ of a Bearish Bat

XAUUSD August 20th Analysis Bearish Divergence 1H. Hidden Bearish Divergence 1H. Meaning Bearish Divergence activated pullback. Was expecting buy to go higher. Hidden Bearish Divergence changed bias. Hidden bearish means continuation to downside. Next Support/TP area is at 1775. Expecting push to 1770-1766.

Right-Angled Ascending Broadening Formation Partial-RiseWe've broken down after a partial rise fakeout i'm going to be buying put options for this ticker as i'm really not that bullish on commodities anymore at the moment.

Bearish Gartley Becomes Logscale BatThe bearish Gartley on ETH has evolved to form a Logscale Bearish Bat

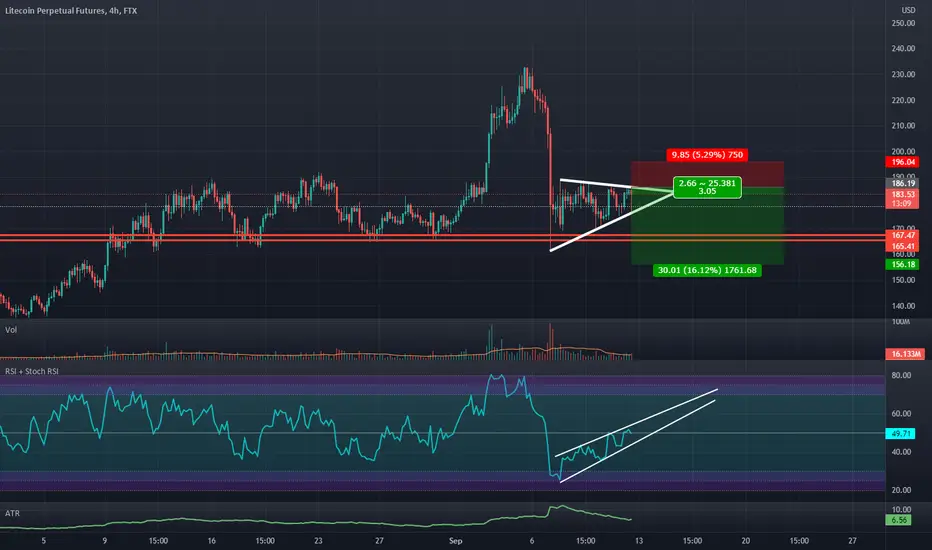
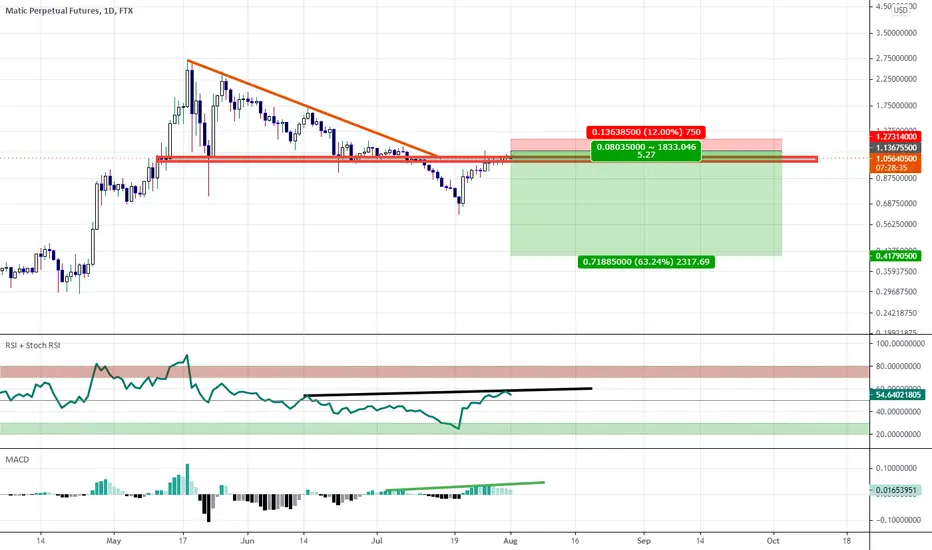
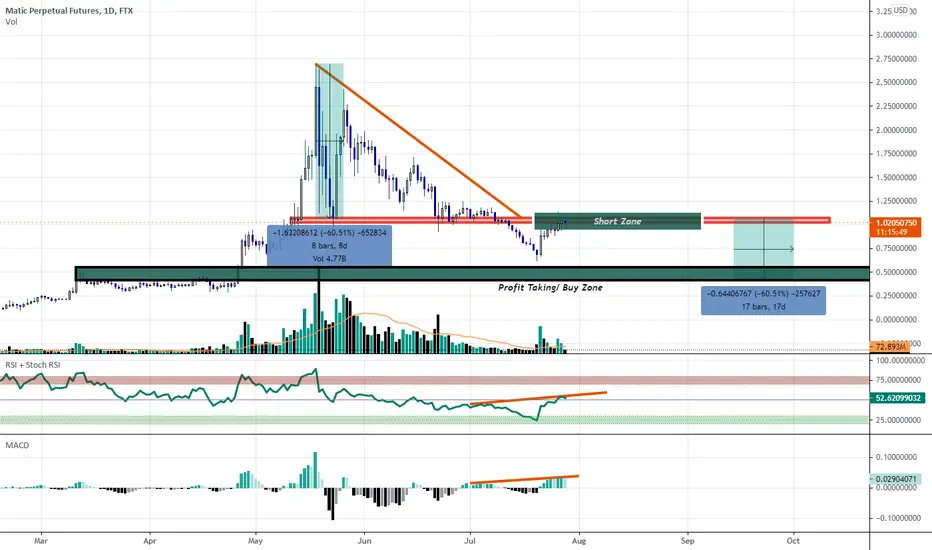
Descending Triangle: Daily MACD & RSI Hidden Bearish DivergenceMatic could be due for a 60% dump real soon as it's been testing the neckline of a descending triangle as resistance for days now and has begun to show weaknesses on the MACD and RSI in the form of Hidden Bearish Divergence.
Bearish Pennant Early EntryENJ has pumped up to the top of a triangle and looks to be breaking out i plan to fade this move by shorting this breakout and trading this like a bearish pennant.

Descending Triangle at Resistance with Hidden Bearish DivergenceIf this plays out we could see a 60% decline in price really soon.
Hidden Bearish Divergence at a 50% RetraceI think XRP has had enough upside from here and will reverse between the 50% and 61.8% retraces.
A few days ago i was Bullish on XRP at the bottom of a descending broadening channel but we have since reached the top of this channel and are now showing signs of 4 hour hidden bearish divergence on the RSI.
If this continues and we see a reversal from here then i'll expect XRP to go as low as 37 cents near the 886 retracement on the daily timeframe.

NZDJPY, 4hr tf, sell the hidden bearish divergence
We got another sell setup for JPY crosses which is NZDJPY.
As you can see price making a hidden bearish divergence and it occurs exactly at EMA-50. We might see price rotate lower from this point.
Sell NZDJPY 77.65
Stop loss 78.00
Take profit 75.80 (5.3R)
Use only 1-2% risk
Good luck

ENJ/USDT expecting continuation of the bearish movement.Hi every one
ENJIN COIN / TETHERUS
as you can see ENJ/USDT has been falling for a while and the Bearish Trend line which It has created has not been broken so there is a chance that the price remain bearish. also we can see that the price has formed a Descending triangle which of course means the price has still room for Decreasing .there is also a Hidden bearish Divergence(-HD) on RSI as well which well suggest a bearish Movement as well!
Traders, if you liked this idea or have your opinion on it, write in the comments, We will be glad.
Things can change...
The markets are always changing and even with all these signals, the market changes tend to be strong and fast!!
Thank you for seeing idea .
Have a nice day and Good luck

Just one of the possible scenarios that COULD play out. An interesting insight that might play out as there is hidden bearish divergence on daily timeframe and BTC can stay in this range for quite a while and potentially weeks which will be good for BTC in longer term.

Hidden Bearish Divergence on BTCUSDHidden Bearish Divergence revealed on BTCUSD... Could be in for another dip. Or could bounce to recovery land, but need lots of bull volume for that.
