ETH: Running Triangle. Time to go lower.While the daily chart remains neutral, on lower timeframes the sentiment is Bearish.
Here we can spot a couple of signals that give credence to this bias:
- The formation and execution of a Running Triangle (white ABCDE Triangle Wave).
- Bearish hidden divergence on the RSI and MACD (yellow lines).
- The EMA 10 (baby blue) and MA 20 (yellow) crossing the MA 50 (magenta) from above.
Should it be confirmed, ETH's price might observe further losses towards the 1600$ range.
Hidden Bearish RSI Divergence

BTCUSDT The Dirty Technical Analysis 6/1/2021
BTCUSDT / BTC USDT Bitcoin US tether.
HOW I WILL FARM THIS MARKET GAINIING TOTAL OF 500% from alts / bitcoin / alts to Fiat USDT. (strong week for alts - but bearish for long term(monthly))
Pink rectangle should be the Sell area,
Green rectangle should be my buy area.
*Tips to myself is I will never fomo in to an alt that has huge gain already if I miss the btc flight...
if I hold something; I will sell it all (or 50%) on the reds then continue to buy it back at the greens and time to accumulate more.
never chase rather be patient.
Be patient enough; That's the secret of the rich taking more profits from the impatient ones.
Trade this with me... the reason why I did this is because not that I have the crystal ball with me.
nor part of the whales; anytime, whales can always decide to FUD and crush the market if they have big institutions coming in.
If HNS (blue) is a success expect that dip to 22K then people from huge co. or industries and retailers will buy their coins, and those who sell from 62k
will buy more from 33k and waiting for 22k possibilities. from there i can say that we will be able to send greens that will break the sky and fly to the moon.
possibilities: 110K from 22K BTC = expect ALTS with strong projects such as $ZIL $MATIC $XVG $VET $DOT $LUNA $ICP $TRIAS $HORD $KSM $EGLD $ADA $MATIC $XLM $XRP
Psychanalysis: I always remember myself, when people fail to sell top. they hit the 7% decrease they will be afraid to sell still... afraid of "it may go up"
Stop right there myself (i am talking to yself), always do the ABC break/retest whether we are coming up or coming down. Never ever fell in love with the coins when we are in a choppy momentum. Never deny that we are in the bear market (not season) because from there that the time you will lose many of your savings and profits that you could actually have pulled up long time ago. Trade the charting Trade the TA... Block all the noise. Stick to those who really know the process.
BITBAY:BTCUSDT

Quickpost:Dash Looks Like a shortThe main chart says a lot so I am going to go into the 12 hour because that shows a lot. Quite simply price action is still very bearish with both the VSTOP and MTF VSTOP situated bearishly and the 20 period SMA acting as resistance. This is the time frame I have my stops set on and my entry was at $207, My take profit is of course a bit shy of full performance. I am almost but not quite ready to move my stop loss to guarantee a profit.
These are very risky times and only the nimble should be trading. This is not the time to learn new skills. If you try and push your limits here with your full account most of y'all will get wrecked, like I got wrecked 3.5-4 years ago. One of the reasons this is a quickpost and I don't need a lot more TA is all the TA I have done recently that points to the begining of a bear market, and I trust my divergences and stop strategy. If I take an L on this it will be a very small one.
Here is a quick confirmation on ethbtc, which loosk to be setting up a classic bear trap. Given ETH and BTC .9ish correlation and ETH higher beta it seems we are due for the next leg down marketwide.

Weekly Bearish Pinbar followed by a Shooting Star Retest2 Weeks ago DPZ tried to conquer the level of 432 and failed then tried again this week and confirmed it's failure. We now have Hidden Bearish Divergence on the MFI and we have Weekly Momentum Pointing downwards on the Momentum Indicator. I will be looking for around an 80 percent pullback towards the $330 area from here.

I suspect SPX will end up like BTCAnd I just need some indicator confirmation before pulling the trigger on some puts.
I don't want to crow too loudly, but lots of crypto analysts on Tradingview and/or YouTube have been posting temperamental TA when they wake up, see a candle, and feel compelled to post an update to their TA. Whipped around all over the place as BTC zig and zagged. Many did not zoom out and have forgotten how to look for bull traps. And a lot of these guys are good, I have seem then call bull traps before. Some of them even saw the bearishness but hand waved it away because "we are in a bull market" and a couple of them got liquidated due to stops being too loose. And I stood on my BTC short call, like I am standing on the over-all bearishness of the S&P and Nasdaq and everything else for the next while.
BTC on the right had a perfectly predictable bull trap due to wedge support support flipping as resistance and hidden bearish divergence on the histogram, and all the other stuff I went into on my linked ideas
Likewise a bull trap on SPXUSD can be very predictable. I have SPXUSD up because it has more price action than SPX or SPY. There are some dissimilarities based on percent gains and slope of the resistance and somewhat concerning, it doesn't look as "wedge-ie" as BTCUSD due to the whitespace. What is similar:
Rising wedge
broke down
Very similar resistance zone (in blue)
I will be watching for price action to go to the blue resistance zone and the wedge. I expect price action to thrash around there for a while and then dump. The most ideal thing I could see is there to be hidden bearish divergence from the peak that is about to form to the SPX all time high, and then! classic bearish divergence within the peak, such as a second retest of the wedge after a small dip. The media will be near schizophrenic trying to come up with news stories and will be contradicting themselves all over the place. But I am not going to be caught flat footed by some tweet by Elon or some bungling statement from the "President."
sidenote
I see a potential descending triangle on BTCUSD... It isn't the main point of the post but still, it means that BTC can bounce and meander around resistance for a couple of weeks even, alts can resume going crazy, and then the rug gets proper pulled. I did a quick skim of some of the BTCUSD ideas and could not see anyone eyeballing the same potential pattern, so I thought I would throw it out there.

Bitcoin The Bull Trap is inPretty straight forward follow up of some of my recent bearish calls on BTC. The red arrow shows hidden bearish divergence on the price action in the rising wedge and the MACD Histogram which suggest we are going to get some continuation, or in other words, a lower low. The Purple flagpole target shows a rough area where we should land and I expect some over-performance before we settle on the bollinger band.
The 8h MACD is about to cross bearishly and we can see how devastating that was on the last occurrence. Signs of illness are showing Old Man is picking up and it is going to affect all the kiddos. All the youtubers looking at TA on the hourly, 4h or likewise are going to miss the year long trendline which sets up our bear trap.
Please see my linked idea on how this break down was high probability and predictable with high probability. The green aro shows the most volatile possible larger bull trap and the thin orange line shows where BTC could go if we have a top that more rounds off than a typical bull trap.
I am standing on this call like I stood on a bullish call in January when BTC was damn near free falling and TrVe and the youtubers were predicting we go to 20k again. I was predicting more upside and we got it.

GBPUSD have Hidden Bearish Divergence and Bearish DivergenceHellooo...My Dragon Friends
I see GU at
- Time Frame H1 has Regular Bearish Divergence
- Time Frame H4 has Hidden Bearish Divergence
time to sell it now...
Lets See
Happy Trading
Smart Trading
Money Management
Risk Management
Disclaimer On

BTC break out of fake out?Bitcoin looks to have temporarily broken out of its descending channel (red solid lines) over the past few hours. But many eyes are wondering if BTC will retain its positive trend.
On the one hand, a normalization around a round number like $55K would be fairly common leading to a potential to jump out to near $56K before potentially retracing back to the trend line (as is common during breakouts) and hence solidify a breakout.
On the other hand, volume is not strong and hidden bearish continuation divergence still exists on RSI, indicating that the price might head back into the channel and either continue downward (toward 40-44K) or form a more forgiving descending channel (dotted red lines) approaching near $47K.
It is truly anyone's guess in my opinion as the daily chart shows fairly positive trends and may continue upward upon zooming out, but the bearish scenario definitely looks to be in play unless further price increases continue over the next day(s).
But please don't take this as advice, particularly with all the volatility occurring, as this is not financial advice but solely my opinion.
But definitely like or comment if you agree or have similar or different thoughts!

BTC divergence/resistance at 54K FibonacciBTC looks to have reversed (at least temporarily) after demonstrating some reversal trends (see my previous posts). However, there is still a bit of resistance on the horizon in my opinion.
For the current price action, BTC looks to have come close to the downside channel's top (red lines) near some strong Fibonacci resistance from the original 43K bottom retracement (which it looks like this current dip has greatly respected those Fibonacci levels). However, as BTC approaches the channel top, it is now showing some hidden bearish continuation divergence (yellow dotted line). Hence it looks like it is more likely to be rejected in the short term at or slightly above the current price.
However, the daily trend is starting to turn positive for bitcoin, so it is quite possible that after a few dips, the price might continue out of the channel. However, if the reversal trend continues, there is still a bit of downward potential in the current descending channel down to near 40-44K. If the latter case occurs, there are some good potential patterns that can arise, such as a double bottom or a shark pattern, however, it is far too soon to tell if any of these might be the case. However, with weekly MACD crossing negatively, one shouldn't rule out these as possibilities.
As always, consider this as just my opinion and not advice, but please like or comment if you agree or a see anything to the contrary.

Bearish Price Action Below 50k May Signal a Decline to 39kBTC is attempting to test 50k as resistance and may drop down the the next major support from here. This entry is a little higher risk than the previous entry at 63k but if you want to try to get in late then it's worth taking a shot here.
For further context on the Short entry at 63k and the bigger Targets check the related ideas tab.

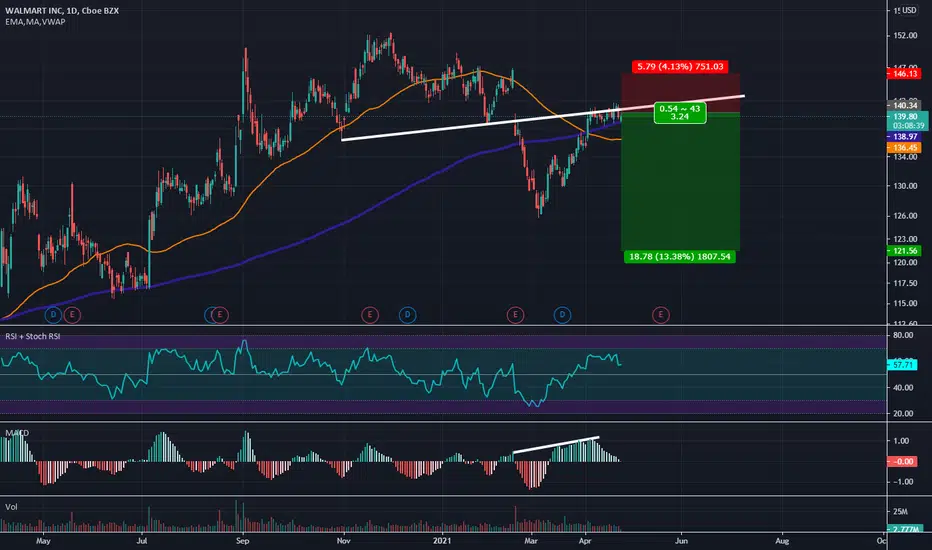
Nice Chance to Enter or add to Short Positions on WalmartSeems like a weak rally so far I feel like WMT will reverse again from here and make a slightly lower low as it is showing a huge amount of MACD Hidden Bearish Divergence on the Daily at Resistance and the RSI seems to be rolling over.
BTC bearish divergence, will wedge break downward?BTC has been forming a wedge after the dip occurred a few days ago. As the wedge has continued to form, hidden bearish continuation divergence has also appeared on RSI giving confirmation that further downward trends may continue as the wedge has begun to break downward.
There are still a few bullish patterns that are possible, for example, this could be the beginning of an inverse head and shoulders formation or the wedge could really look like an ascending triangle, but from what I can tell, most trends look bearish.
If a dip does occur, a new descending channel may be forming that looks to trend toward $50K in the short term toward longer term support, however, stronger support looks to be around 46-48K where there are stronger Fibonacci support levels.
Please like if you agree or leave a comment as to what you see, as I would love to hear your thoughts.

EUR/USD can form a reversed head and shoulder!Hi every one
Euro / U.S. Dollar
EUR/USD is trying to form a reversed head and shoulder pattern in our opinion! as you can see the Left shoulder and head has already formed but the right shoulder has yet to form! if you pay attention you can see that there is a hidden bearish divergence on RSI as well which will make the expected correction for forming the right shoulder more likely to happen! after the completion of this pattern and breaking of the neckline, the bullish movement can happen as much as the measured price movement!
Traders, if you liked this idea or have your opinion on it, write in the comments, We will be glad.
Things can change...
The markets are always changing and even with all these signals, the market changes tend to be strong and fast!!
Thank you for seeing idea .
Have a nice day and Good luck

MACD 4HR Hidden bearish Divergence near top of Parallel ChannelLooking to target the potential bottom of the channel at the 0.786 retracement for profit taking

USD/JPY is still gonna dump!Hi every one
U.S. Dollar / Japanese Yen
the USD/JPY has a strong bearish trend going on as you can see after a long time the price couldn't increase from it's previous top price (the chart is in weekly time frame but there is a strong support as well which the price reached it multiple times and increased from that point.there is Hidden bearish divergences as well on both MACD and RSI which makes the bearish trend stronger!
Traders, if you liked this idea or have your opinion on it, write in the comments, We will be glad.
Things can change...
The markets are always changing and even with all these signals, the market changes tend to be strong and fast!!
Thank you for seeing idea .
Have a nice day and Good luck
The DEFINITION of Divergences!

USDJPY 16/01/2021 Short 300 Pips TP here we can see the Price is ranging in a descending Channel and it is showing a bearish wave
we can see a Hidden Divergence with the MACD as the price is making Lower Highs but MACD is making Higher High so it can be sign of trend Continuation with a higher volatility...
in order to speculate the next target we have specified the supports on its way, by Fibonacci Projection we can have some higher probability that the price shall reach the Minimum of parallel level which is 101.33 and henceforth
i have specified our TP Zone too
please comment your ideas

EURUSD Hidden Divergence Bearish trend Continual Hi
as we had observed the Convergence in our bullish trend and it reversed the bullish trend to bearish now
We can see a Hidden Bearish Divergence with MACD and RSI, which is a sign and confirmation of Bearish Trend Continual and we can target our short for -61.8 of our Fibonacci projection which is having confluences with our 61.8 bullish Fibonacci retracement.
the Suggested TP are
1-TP=1.1605
2-TP=1.1505
please comment me your opinions

Looking Bearish Potential Gap fill could take us down over 20%They recently got charged $3.2bil more info here: www.abc.net.au
Travel restrictions are not going anywhere anytime soon thanks to covid-19; Nothing looks nor sounds Bullish about this stock to me.
You've got Hidden Bearish divergence on multiple timeframes.
Lets fill the gap.


BTC - Hidden Bullish Divergence The KDJ indicator is showing hidden bearish divergence as it has made a higher high while bitcoin has made a lower low.
Proceed with caution.

EURUSD Short UPDATEDHi
as we had analysed the EURUSD on 24-08-2020
as we were bearish on the pair, i am updating that analysis based on some more new confluences.
which are a bearish hidden divergence with MACD and a break through the lower bound of formed Triangle as well as our higher time frame Chanel's top band
which was earlier a support and now turned to the resistance
currently the trend retesting its resistance
i am expecting a continual bearish trend up to the parallel leg of our Fibonacci projection at 1.1725 which is ultimately the lower band of our long Chanel
please comment your ideas and opinions for me
and follow the page for further updates if you liked the idea

Bearish Hidden Divergence Bearish Hidden Divergence on this pair and we have been seeing price ranging for weeks on, for a good entry I would suggest you go down to the lower tf and wait for the breakout below the range and enter at a retest of it. Cheers

Tricky MondaysPreviously looking for buys at 1.23500 support but decided to wait for price to form support above 1.24055. Price may just be moving funny or wee still may have a weak pound looking bearish. I've also spotted Hidden Bearish divergence on the 1hr timeframe so we may see a nice push back to the downside.
