Golden Shark Doo Doo DooDooI think I found a harmonic pattern known as a bullish shark on GNOG. This is how I'd trade it. I'm waaay too tired to get verbose on this one, sorry.
Hidden Bullish RSI Divergence

ATOM can reach 33$ and than start it's correction!Hi every one
COSMOS / TETHERUS
ATOM/USDT is in a crab pattern. AB movement has been completed but CD movement has yet to complete .the price can reach around 33$ (EX ret 1.618) and than start It's correction .if we use the Fib retracement the correction is expected to reach the 0.618 line of the Fib.
there is also a Hidden bullish divergence on RSI indicator which strengthen the completion of the crab pattern!
Traders, if you liked this idea or have your opinion on it, write in the comments, We will be glad.
Things can change...
The markets are always changing and even with all these signals, the market changes tend to be strong and fast!!
Thank you for seeing idea .
Have a nice day and Good luck
Our more recent analysis of ATOM/USDT :

ANKR/USDT can still make Bullish movements!Hi every one
ANKR / TETHERUS
the ANKR/USDT is in a bullish flag which has not broken yet. there is a Hidden Bullish Divergence on RSI and MACD indicators as well which make the expected bullish movement stronger! after the upward break out the price can increase as much as the Flag pole length which when the movement finishes the price will sit around 0.28 $ !!!
Traders, if you liked this idea or have your opinion on it, write in the comments, We will be glad.
Things can change...
The markets are always changing and even with all these signals, the market changes tend to be strong and fast!!
Thank you for seeing idea .
Have a nice day and Good luck
Our more recent analysis of ANKR/USDT :

AVAX/USDT is about to do an awesome movementHi every one
AVAX/USDT
AVAX/USDT is in a bullish flag the upward break out can happen in a few days there is also a Hidden bullish divergence (+HD) on RSI as well which strengthen the expected bullish movement which is as much as the flag pole Length!
Traders, if you liked this idea or have your opinion on it, write in the comments, We will be glad.
Things can change...
The markets are always changing and even with all these signals, the market changes tend to be strong and fast!!
Thank you for seeing idea .
Have a nice day and Good luck


Precioius GOLD w Fibs & ARCs on WEEKLiA very important level, there's some hidden divergence, that may be very bullish.

The DEFINITION of Divergences!Hi every one
So in this post we want to talk about a thing that If you've been following us you would've see a lot of it !
we wanna talk about Divergences! and how to use them to our advantage!
there 4 kind of divergences in total which we will describe one by one!
1-regular Bearish Divergence (-RD)
2-regular Bullish Divergence (+RD)
3-Hidden Bearish Divergence(-HD)
4-Hidden Bullish Divergence(+HD)
first let's talk about the effects of divergences and than get into each one. divergences are strong signals that will reassure us of the continuation of the trend or the ending of them! so let's get into each one!
note that the trend is pretty important in finding divergences! for finding regular divergences on a bullish trend we must look at the tops and in a bearish trend we must look at the bottoms. for Hidden divergences though we must look at the bottoms (in a bullish trend ) and tops (in a bearish trend)
so let's get into it!
1.regular bearish divergences (-RD): these divergences accrue when the tops are higher than each other(in a bullish trend),but on RSI or MACD indicators the tops are lower or in the same position next each other (in a bullish trend) in this situation we can be sure that the trend is about to change and start the bearish movement at least for a while!
these are examples which clearly show the effect of (-RD) on the trend of the market.
2-regular bullish Divergence (+RD) : this divergence is accrued when the trend is bearish (bottoms are lower than each other ) but on RSI or MACD indicators the Bottoms are higher or next to each other. in this situation we can come to a conclusion that the trend can't be bearish for ever and the trend must change!
this is an example for (+RD) which you can see It's effect on the market!
3-Hidden bearish Divergence(-HD):The tops are lower than each other ( in a bearish trend) but the tops on MACD or RSI indicator are higher or in the same position next to each other in this situation we can be sure that the trend can still be bearish .
this is an example for(-HD) :
4-Hidden Bullish Divergence(+HD): these divergences accrue when the bottoms of a bullish trend are higher than each other but on the MACD or RSI the bottoms are lower or in the same position next to each other in this situation we can be sure that the bullish trend can still continue!
this is a clear example of (+HD) and It's effectiveness!
We hope that you've learn something with this post .
Have a nice day and Good luck.

FLOW/USDT growth is just in the beginning !Hi every one
FLOW / TETHER USD
FLOW/USDT had great growth lately but it seems this growth is just the beginning!
there is a bullish flag visible on the chart and also a hidden bullish divergence(+HD) on RSI as well! with these signs we can be sure that there is a potential in this token!
Traders, if you liked this idea or have your opinion on it, write in the comments, We will be glad.
Things can change...
The markets are always changing and even with all these signals, the market changes tend to be strong and fast!!
Thank you for seeing idea .
Have a nice day and Good luck

MANA/USDT has promising signals for it's bullish trend!Hi every one
DECENTRALAND / TETHERUS
the MANA/USDT chart is pretty interesting. the price is in an ascending channel and there is an ascending triangle which has done It's job and the price has increased as much as the expected movement(AB=CD) and also there is a bullish flag which the price has done the upward break out! there is also hidden bullish divergence on both MACD and RSI indicators as well! if we use the ELLIOT waves principle we can understand that the 4th Impulse wave has been completed and now the price is on It's way to complete the 5th wave! with these bullish signals we can be sure that MANA has a lot of potential to continue It's bullish trend!
Traders, if you liked this idea or have your opinion on it, write in the comments, We will be glad.
Things can change...
The markets are always changing and even with all these signals, the market changes tend to be strong and fast!!
Thank you for seeing idea .
Have a nice day and Good luck

DOT/USDT expected movement in the future!Hi every one
DOT / TETHERUS
DOT/USDT is in an ascending triangle which means that after the upward break out we shall see a good amount of pumping in the price there is also a hidden bullish divergence (-HD) on RSI indicator as well which strengthen the expected bullish movement!
Traders, if you liked this idea or have your opinion on it, write in the comments, We will be glad.
Things can change...
The markets are always changing and even with all these signals, the market changes tend to be strong and fast!!
Thank you for seeing idea .
Have a nice day and Good luck

BTC/USD situation right now and expected movement in near futureHi every one
Bitcoin / U.S. Dollar
in this analysis we want to see what is going to happen to BTC so let's get into it.
the first chart is showing us that there is an ascending triangle pattern with hidden bullish divergences (+HD) on both MACD and RSI indicator after the upward breakout we can see that the price has decreased so this could be a pullback to the upper line of the triangle and than continue the upward movement.
the second chart is showing us a little bit different thing. the harmonic butterfly pattern has formed in the chart which is a bearish pattern as well! another thing is that there is a regular bullish divergence (-RD) on MACD indicator which can be the reason to strengthen the bearish movement! we expect that the price decrease between the 0.618 to 0.5 line of Fibonacci and than start pumping again from that point!
Thank you for seeing idea .
Have a nice day and Good luck.
Our more recent analysis of Bitcoin :
and

Zcash Long Chance 01/02/2021we have analyzed this asset using the Price Action analysis and we could notice a Hidden Bullish Divergence with MACD and it is the sign of trend continuation
we can target the parallel leg level of Fibonacci Projection and it is an easy target to achieve as the price is range bounding rally in a ascending channel and we can estimate to have our target areas in a month time
please comment your opinions

DOGE- Bullish reversal or Bearish continuation?This swing setup might be overly conservative, but given the uncertainty of BTC price and the complete lack of fundamental of DOGE. I tend to be extra careful when my swing trade has no chance of turning into the long-term holding.
Just my two cents. Not the trade advice.

ADA/USDT signals tell of a bullish movementHi every one
Cardano / US Dollar
The ADA/USDT has formed a bullish flag which means that after the break out of this pattern we shall see a pump in the price!
there is also a hidden bullish divergence (+HD) which makes this pattern more reliable!
Traders, if you liked this idea or have your opinion on it, write in the comments, We will be glad.
Things can change...
The markets are always changing and even with all these signals, the market changes tend to be strong and fast!!
Thank you for seeing idea .
Have a nice day and Good luck.

Hidden and Classic Bullish Divergence: Falling Wedge BreakoutWe could see it retrace up to the 618 or even higher from here.

SE- My international E-Commerce playLast year, SE turned cash flow positive and posted the triple digit revenue growth quarter after quarter. It is a digital entertainment/gaming + E-commerce + Fintech all in one company and is turning into a behemoth in south east asia.
In addition, SE was a favorite buy for several top hedge funds in Q4 2020.
It seems like we will see some weak rally tomorrow as the bottom-buying pressure seems to have waned compared to previous occasions in which buyers showed up almost immediately as soon as the price touched the bottom of the long-term trend. Not saying the trend will be broken, but it's likely that we will see a brief consolidation first, then another swing low before the reversal happens. Nonetheless, I will buy the dip tomorrow and aim to fill the remaining of my positional size inside the demand zone.
Not the investment advice. Just my two cents


USOIL might decrease (or not?)Hi very one
This is the USOIL chart which shows us that the chart has formed a triple top pattern (shown in the picture) which you might think that the price will decrease but please note that there are two divergences which makes us think otherwise!
So there can be two scenarios:
1. The price breaks the support line and will decrease due to the regular bearish divergence (-RD)
and the triple top pattern!
2. The price can't break the support line and will obey the hidden bullish divergence (+HD)
and ignores the triple top pattern as well.
You just have to wait for the breaking of the support line which will happen in short time after that we can make deals with more assurance!

Complex Inverted Head & Shoulders with Hidden Bullish DivergenceI'm pretty sure many of you know about the plans many people have for silver at the moment but here i am to provide a chart that could explain in a technical way why silver may rise up.
We have hidden Bullish divergence on the daily time frame on both the RSI and MACD and we look to have formed some sort of complex inverted head and shoulders pattern a breakout above the resistance that i shaded in grey could take us to atleast 36 dollars.
This may also relate to my previous chart from weeks ago where i stated that i was bullish on gold, I will leave my gold chart under the related links section.

BTC.D Looks ready to beggar altcoinsThe chart is pretty simple and most the details are already on the main chart. Triangles are some of the easiest patterns to recognize and some of the worst at meeting full performance and are the most likely to bust if they are not nested in a larger macro structure. The pattern recognition is easy, we have three alternating points of support and resistance. Due to the size of this ascending triangle there is no larger structure.
At the blue 3 we see that BTC.D is at double support, both the top of the channel and the rising support of the triangle. Triangles are the most likely to bust but since we are at double support I feel we have a good chance of increasing our odds to the upside. Target area is of between the 0.618 and 0.786 fib extension levels but there may be the basic price action behaviors, such as going to a fib extension and pulling back to retest the neckline as support.
A zoom in of the channel with the nine season's rainbow shows we are getting some basing behavior as determined by the indicator showing blue. The light red indicates selling is relatively weak. Read up on the indicator here:
The standard indicators are showing a massive amount of hidden bullish divergence on the daily. which is a great place to be if we are forecasting BTC.D will go up. MACD very likely to have a bullish cross and the histogram is divergent to price. Generally speaking, if RSI hits over-sold on the daily with hidden bullish divergence there is a strong chance that there will be a move to the upside.
Below are the times that btc.d went up while the price of bitcoin actually traded down. Which means that quite simply the alts sold of at a higher rate than bitcoin. It does not necessarily suggest that BTC was used as a store of value because they could have been tethering up or going into fiat. This chart is therefore tagged long only for BTC.D and cannot be used to suggest BTC will go up or down at this time.
In conclusion:
The chart is suggesting we should stay away from trading alts long in the short term. We might even need to stay away from trading BTC long depending on if BTC.D and BTCUSD diverge from one another again. This is a chart to keep an eye on.

EUR/AUD bullish movement in a descending triangle?Hello every one
EURO / AUSTRALIAN DOLLAR
the EUR/AUD has formed a descending triangle which means that the price would decrease but MACD shows that there is a hidden bullish divergence(+HD) which means that the price must increase according to MACD!
as we know the oscillators show the future of the market so bullish movement for EUR/AUD is more reliable.
Traders, if you liked this idea or have your opinion on it, write in the comments, We will be glad.
Things can change...
The markets are always changing and even with all these signals, the market changes tend to be strong and fast!!
Thank you for seeing idea .
Have a nice day and Good luck.

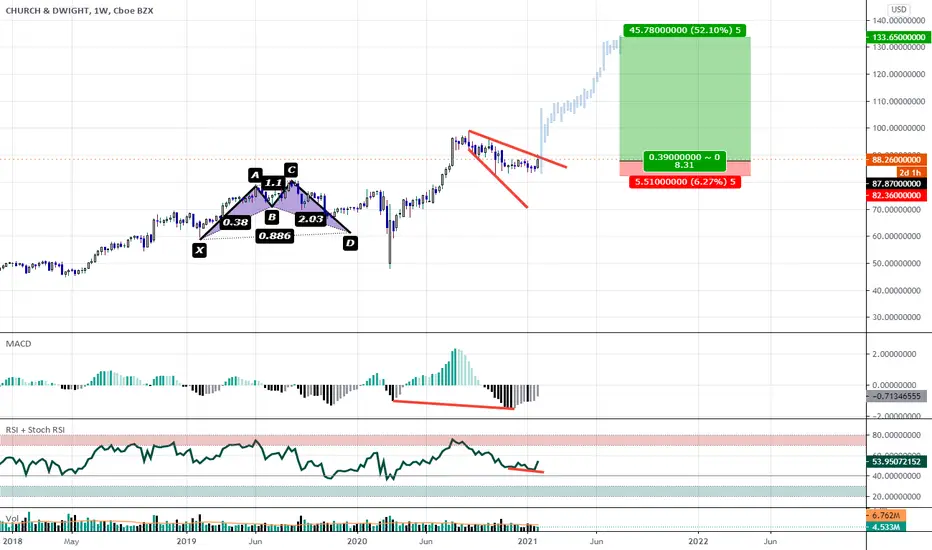
Weekly Hidden Bullish Divergence: Bullish Price Continuation.We have a huge amount of Weekly MACD Hidden Bullish Divergence and small amount of it on the RSI
There's also a small amount of Classic Bullish Divergence on the Daily as seen here:
I expect that we will eventually break the downward trending line and bust out to new highs; Possibly up to as high as $135