Maximum pain with an expanding ending diagonalBitcoin:
Hidden Bullish divergence on the 12H RSI, confluent with trendline support of a potential expanding diagonal triangle to complete wave 1 of a larger 5th/C at around $13k.
Expecting a SFP rejection from $13k and a short-term correction to follow with major support at $11.1k and confluence of major support between $10.2-10.3k where there is a strong weekly level and a 4H order block which I suspect will be tested. Should only be a wick to these levels with $10.5k holding on a higher TF close.
12H Hidden bullish divergence:
Hidden Bullish RSI Divergence

Look this Hidden Bullish Divergence.This chart is so Bullish.
Thanks JpMorgan.
Hidden Bullish Divergence :
www.perfecttrendsystem.com

Tips to pay attention to before open any positionCheck the chart carefully. And pay attention to the written description.
Thanks for your like and support.

BTC looks primed for another move but beware the CME gapSellers look to be losing and I'm long. But cautiously long as there is still that CME gap down to $9645. So half my usual risk on this one.
Ascending triangle
Hidden bullish divergence
Respecting moving averages
Positive sentiment
A lot of things in our favour here


BATBTC Trade Setup | Trend Reversal | Hidden Bullish Divergence Today's chart - BATBTC – Consolidating at key support; a successful re-test validates technical targets above.
Points to consider:
- Trend Reversal
- 21 EMA visual guide
- Hidden bullish divergence
- Stochastics oversold
- Low Volume
BATBTC testing trend support after a strong bull move into daily resistance, price respecting support level will form a higher low on the chart, indicating a trend reversal and will allow for trend continuation.
The 21 EMA will assist as a visual guide, price breaking and trading above the EMA is a confirmation of strong trend continuation.
Although trading below 50, the RSI confirms a hidden bullish divergence: price has made a higher low whilst the RSI has made a lower low, indicating a strong market accumulation. This also allows for ample space before the oscillator reaches overbought conditions as price breaks bullish.
Stochastics are also overextended, although they may remain there for some time, momentum has been stored to the upside.
Volume has been tapering off, indicative of an influx being imminent, likely to coincide with a break in either direction.
Overall, in my opinion, BATBTC needs to hold trend support and break above the 21 EMA to validate a conservative entry for a long trade to technical targets above.
What are your thoughts?
If you’ve read this far - thank you for following my work!
And as always,
Focus on you, and the money will too!


LOW HIGH, RSI BULL DIV. 1H- RSI BULL DIV.;
- LOW HIGH.
- Good R:R (3.66)
- Below MA200 (45m, 1h, 2h, 4h)
-
- Manage ur risks
- NOT A FINANCIAL ADVISOR!!

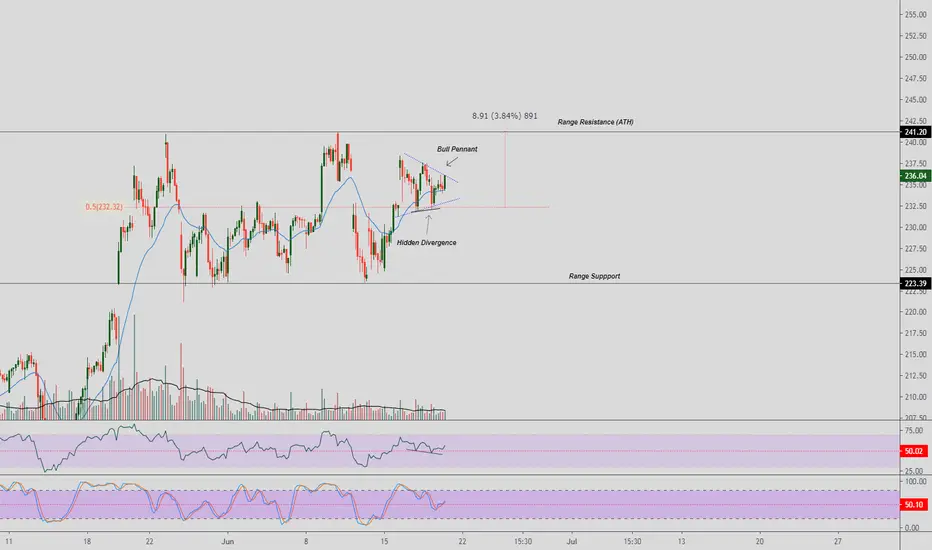
Facebook Hidden Bullish Divergence|Range Resistance|Bull PennantEvening Traders,
Today’s Analysis – Facebook – trading above range midpoint with a hidden bullish divergence , immediate target - range resistance.
Points to consider,
- Trend bull pennant
- Range support respected
- Range resistance target
- RSI hidden bullish divergence
- Stochastics above 50
Facebooks trend is forming a probable bull pennant above range mid-point; this is considered a true pennant ONLY when price breaks out north.
The range support has been respected multiple times; breaking this will put bears in control of the trend.
Facebooks immediate target is range resistance, a very key level, breaking above will initiate a Blue Sky Breakout.
The RSI confirms a hidden bullish divergence ; price has made a higher low whilst the RSI has made a lower low. Both oscillators need to remain above 50 for continued strength in the market.
Overall, in my opinion, range resistance is the current target, breaking the pennant north will validate the pattern and the target will then become more probable.
Breaking the ATH will put Facebook in price discovery mode
What are your thoughts?
Please leave a like and comment,
And remember,
“Hope is bogus emotion that only costs you money.” – Jim Cramer
Bitcoin to $8800? Looking at bitcoin taking off the wicks or just ignoring the one wick to $9130 we have a head and shoulders pattern possible here. But the hidden bullish divergence is holding me back right now I’ll wait for a break of the neckline and maybe a retest of it for confirmation for right now unless something changes.

Bitcoin Daily Bullish SignalsOn the daily Bitcoin chart we can spot several bullish signals:
- Touch support line of parallel channel
- Golden cross 50MA over 200MA
- Hidden bullish divergence on RSI
Target 1: Psychological resistance @10k
Target 2: Long-term resistance line (white) @10.4k

Textbook bullish breakout imminent? Cryptomarket wide!Add up all the bullish indications, patterns and price action. It's just staring us in the face.

GBP/AUD LONGGBP/AUD SHOWING CLEAR HIDDEN BULLISH DIVERGENCE ON MULTIPLE OSCILLATORS AT KEY LEVELS. IF THIS NOT A CLEAR LOW RISK LONG, I DON'T KNOW WHAT IS.

BITCOIN ⚒️ Miner Capitulation Over? 🤔Did strong miners step up the hash rate?
Are the whales buying up the price?
🐋 Whales —
On Balance Volume is testing Resistance. A rejection here and price will most likely drop... but if it continues up, FOMO may kick in.
🐂 Traders —
Relative Strength Index makes a Hidden Bullish Divergence... during a Daily uptrend. This is very bullish.
⚒️ Miners —
BTC Hash Rate is above 200 Day Moving Average and a Buy Signal triggered.
⚠️ This is a tough call. Short positions are loading up at this level... but this could result in a Short Squeeze to take Bitcoin up "temporarily" higher if whales decide to flex. Personally, I'd rather be in a position with a Trailing Stop Loss than sit here on the sidelines watching this possibly moon.

BitShares 4H Hidden Bullish Divergence and MACD Bullish CrossI see Hidden Bullish RSI Divergence in 4H chart of BTSUSD, in combination with a Bullish Crossover in MACD. These are 2 bullish signals for me. I expect growth towards resistance at 0.022.

TRXUSDT Local Support| Hidden bullish Div| Volume Climax Evening Traders
Today’s Technical Analysis – TRXUSDT – trading in a small range with defined levels to breach for either a bull or bearish scenario.
Points to consider,
- Bullish trend (higher lows)
- Structural resistance (triple top)
- Local support holding (wicks)
- RSI possible divergence (Further confirmation needed)
- Stochastics momentum down
- Volume climax evident
The local trend is bullish with consecutive higher lows but it is now important to note that a triple top may be in if structural resistance does not get breached.
Local support is holding true as a current trade location; multiple wicks suggest buy pressure coming in.
Also another important observation is that these wicks are in a higher low fashion.
The RSI has a probable hidden bullish divergence, putting in lower lows as price puts in higher lows.
Confirmation will be on the next confluence touch at local support.
The stochastics momentum is stored down, currently at 50, there is room for further downside as price retraces.
Volume climax is evident, indicating that a temporary top is in; this will obviously be negated with a breach of structural resistance.
Overall, in my opinion, TRXUSDT needs to come for a retest of local support; this is where the hidden bullish divergence will be confirmed and or negated.
What are your thoughts?
Please leave a like and comment,
And remember,
“Fear, inherently, is not meant to limit you. Fear is the brain’s way of saying that there is something important for you to overcome.” ― Yvan Byeajee


Natural Gas Long Opportunity5 waves down is completed with diverging RSI, chance for a reversal uptrend. The plan is to open long positions if break the two lines:
1st at 1.885( breaking the wave 4 high)
2nd at 2.035 (breaking the wave b high, inside wave 2)
Stop loss at 1.470.
You can choose to manage the positions by your own money management.
The first target is at the resistance level coincides the wave (4) but expect higher in longer run.
Wave count is invalid if break bellow 1.470, cheerss.

NZD/CHF BULLISH CYPHER POTENTIAL BULLISH CYPHER PATTERN . NOTICE THE HIDDEN BULLISH DIV FORMING ON MACD. FOR MORE CONSERVATIVE APPROACH , WAIT FOR CONFORMATION CANDLES AT COMPLICATION.

GBPUSD POSSIBLE BUYING OPPORTUNITYGBPUSD 1H
- Triangle formation -----> possible breakout
- Hidden bullish divergence with OBV indicator ----> Bullish breakout

LINK/USDT - time to take profit on your shortsPrevious short idea:
LINK/USDT has retraced 30% without a proper bounce yet and is currently sitting close to the bottom of the uptrend channel and on the 4 hour 200 MA.
We can see hidden bullish divergence on the RSI which usually indicates a good spot to re-enter in an uptrend.
The LINK/BTC pair shows it right on the upper trend line of the previous uptrend channel and is very close to a previous point of resistance (36k-37k sats) which now acts as support.
Bears seem to be too greedy right now so I expect a bounce soon, risk-reward is solid at this point.
In the case of BTC shitting the bed it's likely that this trade will become invalid, consider exiting if 1-2 candles close below the uptrend.
Buy zone: green area
