VIX Pump Part 2 Is Setting UpWe have a Bullish Shark here showing some Hidden Bullish Divergence on the 4 hour. If we can rally from these levels again i expect another decent move towards our target.
Hidden Bullish RSI Divergence

$ADT Bullish Dragon Hidden and Classic Bullish DivergenceWeekly Hidden and Classic Bullish Divergence at Support on the verge of breaking out into a Bullish Dragon

Bitcoin channel and a reciprocal fibonacciwe can see a clear reciprocal Fibonacci on the bitcoin chart so we'll expect that price up to 1.618 extension Fibonacci ratio, in addition, we have a bullish channel on the bitcoin price chart and a hidden bullish divergence in MACD. BINANCE:BTCUSDT

Raydium Cup and Handle with Potential Upside to $100 or HigherI recently uploaded a Bullish Gartley on the4 hour for Raydium and it played out very well but now i can see on the Daily that we have formed a Cup and Handle and the targets could potentially take us up to the low $100s

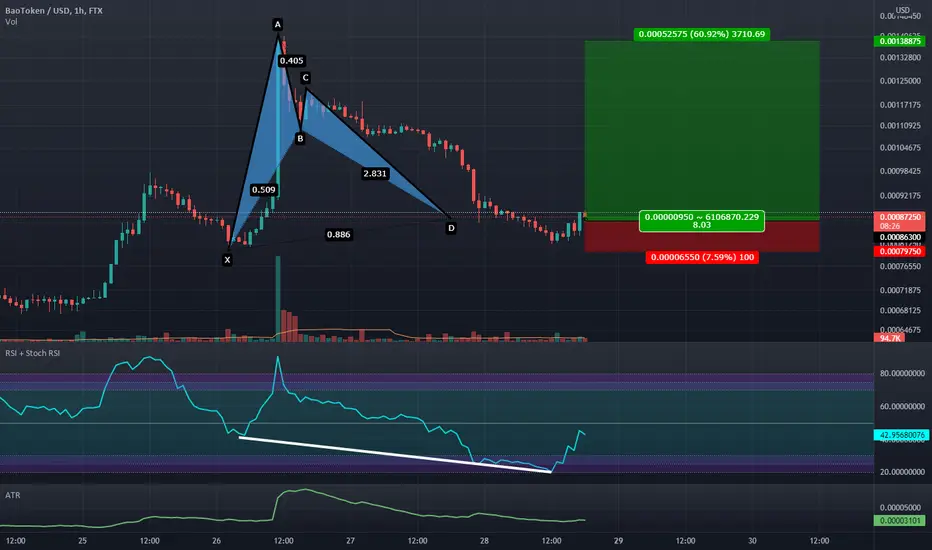
1 Hour Bullish Bat with Hidden Bullish DivergenceThe Risk to reward is pretty good on this one so it's worth a shot.
AUDIO/USD Bullish Gartley 4hr RSI Hidden Bullish DivergenceWill have my stop Below X here. It's very possible that this will greatly exceed the profit taking target on screen.

Piercing Line Above Previous Resistance May Take SOL Up To $320Sol retraced down to the PCZ of a small Bullish Bat Pattern above previous resistance and we reacted well to it and used it as a support to form a Piercing Line Bullish Reversal Pattern, now the RSI is showing signs of Hidden Bullish Divergence as well as the MACD.
This looks like it could be the final test before we finish our ABCD move up that would take us to around $320

Bullish Gartley: Hidden Bullish Divergence: Weekly EngulfingThere is classic divergence on the daily and hidden divergence on the weekly at the PCZ of a Gartley.

LTC Hidden Bullish Divergence at Neckline of Double BottomLitecoin doesn't seem very likely to let BCH outperform it as seen on the LTC/BCH chart, with BCH going up the only way for LTC to outperform BCH would be for LTC to go up as well so i think this Double Bottom has a higher probability of working out for us in the end.

Solana Looks Like it Wants To Take Some of ETH's Market CapSOL/ETH has a potential ABCD BAMM which looks more likely to playout now that we have a nice looking Bullish 5-0 formation at the highs with a decent amount of Hidden Bullish Divergence. This may lead to us rallying up to and above the B point of our ABCD which by then we should have a clear runup to the D point at the 2.618 Fibonacci extension.

BTC.D Looking To Continue It's Ascent Into the 50sBitcoin Dominance showing great amounts of hidden bullish divergence here signaling that the decline in alt coin valuation towards Bitcoin may not be over yet.
On more thing to point out here is that soon we will be getting a golden cross on the daily.

Bullish Hammer at PCZ of Gartley with Hidden Bullish DivergencePTON Had a crazy dump day the other day and lots of v9olume sold out of the stock we then spent a few days at the 78.6% retrace and we now seem to be getting a reaction, so long as we close the day like this, this should be a good bullish signal to enter. i will buy some shares and some calls here.

Bullish Gartley Double Bottom Breaking out on Shiba InuWe may see a 61.8%-78.6% retrace from here if this breakout continues.

$CGC Revisiting The Bat PCZ For a Second Time.CGC had a bullish setup in this area before why not try and go for it again and potentially fill the wick that we created during the last run?
We have bullish Divergence on both the MACD and RSI suggesting that we may get a bounce from this zone again and this time we may even go higher than the last time.
Check out the related idea section if curious as to what conditions CGC was under just before the last bearish reversal.

Perfect AB=CD Early Diamond C Entry on WAVES/USDWe have a Diamond pattern forming at a Potential C leg of a Perfect AB=CD with Hidden Bullish Divergence on the RSI.

Hidden Bullish DivergenceThis can be seen when the pair is in an UPTREND.
Once price makes a higher low (HL), look and see if the RSI or oscillator does the same.
If it doesn’t and makes a lower low (LL), then we’ve got some hidden divergence in our hands.
That's a sign of trend continuation.

Weekend target of 56k possible for an ABC correctionThere looks to be a high possibility that bitcoin is currently in an ABC correction coming down from the current ATH.
As shown, A ended at ~59.5k with a 5 wave correction down and now we are an ABC correction (shown in green) for a larger B correction up.
I think from here bitcoin will fall back to the 61k region with a bounce to 64k to complete the B wave.
Note: A break of 59.5k would invalidate this and we would have to say Wave C down has begun with Wave B ending at 63.7k and have to find new potential targets and Wave counts.
Then after, 5 waves down to complete the C wave which shown by an estimation of a 1 to 1 retrace puts it near 56.5k.
As to the timing I use parabolic curves (I have found to be good at finding reversals) for the B wave ending on the 4H chart:
For the ending C wave:
This also suggests that it may drop to around 56k as there is a strong potential for support here as shown by the green horizontal line drawn in.
I would say most likely a bounce will happen in this area as long as it follows this path.
There currently is hidden bullish divergence on the 4H RSI which I believe to be playing out now and also a hidden bull is showing on the daily.
I believe for the daily RSI though there is potential to be a stronger hidden bull that will occur following this ABC correction
Yellow - Current Hidden Bullish Divergence
Green - Potential Hidden Bullish Divergence at the end of Wave C
To invalidate this being an ABC correction, or to say it already completed, it will need to break the current ATH, then I will need to reassess as to where the new target may be.
As to what this means overall for bitcoin I will wait and see as to what happens next.
If this is a B wave we're currently in I will like to see where it ends first. After that it would be more accurate to figure out where Wave C would end and then determine what count we are starting on the larger time frames (Weekly and up).
I will post more ideas to this and more about the idea of still seeing a new ATH in the near future and what the potential target(s) may be.
***Disclaimer: I am not a financial professional/expert and all ideas from me are all speculation based off of my own research. Please do your own research as well as I am not responsible for others when it comes to their financial decisions.***

Hidden Bullish Divergence at PCZ of Bullish SharkThis is a much quicker and smaller scale trade than the bigger more grand ascending triangle trade on the same pair that can be found in the related ideas tab.

Vechain Possible Hidden Bullish Divergence!!?Looking at Vechain we have recovered nicely off of the little correction we had and we are starting to push back up towards our previous high at 0.16c shown by red horizontal ray, but the main thing i wanted to discuss here is the very possible hidden bullish divergence that could play out in the coming days/week/s. This pattern is a continuation pattern of the current trend we are in and could keep pushing VET to the upside. Before we get into this possible outcome lets discuss the bollinger bands first, the main thing we notice is the squeezing of the bands which means volatility is shrinking and we are set for an explosive move in a matter of time, now the bollinger bands don't indicate which way but that is why we use other indicators to try and determine that. we are holding the midline quite strong and its looking like we will continue too after todays daily close, and keep in mind with the bands so close to price action a little pump could ignite a massive one if price action grabs onto that top band! Now the hidden bullish divergence, what we are looking for and we are already seeing is higher lows on the price chart which is shown by the green uptrend line and then lower lows on the oscillator and in this case i am using the stochastic RSI, look at the yellow horizontal ray, that line shows our previous low and what we are looking for here is a fall below this level and a creation of a lower low, similar to the path ive drawn on the Stoch RSI, the path shows a likely scenario because we have support down there shown by the green horizontal line, but we could see this play out anywhere inbetween the green and yellow horizontal lines and anywhere in that area would be valid for this divergence! and with the stoch rsi just having a bearish crossover this could play out perfectly, on the price chart we still have a bit of room to fall down along with the stoch RSI we just have to make sure price action keeps on making higher lows which can be seen by following the green uptrend line, if we made a higher low on the green uptrend line that will definitely be enough for the stoch RSI to fall into that zone we talked about and then go on to make that lower low. Now something key here is when we look at the RSI we see that we are falling a bit along with the stoch RSI which is completely normal and we are coming up on the midline in a bit and now this is where the hidden bullish divergence CONTINUATION comes into play, we are currently in an uptrend shown by being above the midline and we want to stay above here when the stoch RSI makes that lower low to complete the divergence pattern and the continuation part goes hand in hand with us being in a confirmed uptrend. And when we talked about having room to fall on both price action and the stoch RSI the same thing goes for the RSI, we definitely have room to fall along with both of these other factors and we can likely see ourselves getting a bounce off the midline which is currently support (as shown by path) and then continue back upwards, it really looks like we could see all of these get that bounce which we need for this to complete the pattern and the beauty is that all these indicators play into eachother and follow eachother so that gives us more hope that this is really going to play out similar to how i have it layed out! Then pair this divergence pattern along with the squeezing bollinger bands and we could definitely have ourselves a huge catalyst for a mega breakout to the upside and a continuation of this uptrend! Not financial advice! If you have any questions don't hesistate to ask i will do my best to explain further and answer in good time! Cheers everyone this is very exciting!

audio/usdt forming bullish sharkAUDIO/USDT is forming a Bullish shark harmonic pattern on the 4H chart, price in the buying zone also, it is also making hidden bullish divergence. 2 confluences to take the trade, TP1, TP2, and TP3 are mentioned.

Weekly Hidden Bullish Divergence Within Bull Flag on HSICI will be buying calls here and targeting the 1.618 retrace as a bullish target.

AKRO\USDT [AKROPOLIS]A large Bullish Shark and Bullish Cypher harmonic patterns. Price back above a critical support zone, as well as above the 200 SMA on the 4H, and the 20 SMA on the Daily. Class C Hidden Bullish Divergence on the MACD, signaling a continuation of upward momentum.

Bitcoin Hidden Bullish Divergence... As marked with the arrows on the RSI chart, Bitcoin has formed a LL on the RSI while the price formed a HL at these points on the daily chart. That is a Hidden Bullish Divergence.
To those who shorted the market, I hope you closed your shorts early. To all the Bulls out there, enjoy the confirmation plotted here. It is a monthly candle close, so bring your popcorn and watch the volatility unfold.
