VIB/BTC - hidden bullish divergenceWe see in this chart that there is a hidden bullish divergence.
Also we see a nice uptrend on the RSI and it tries to break trough the ichimoku cloud.
When it will break the ichimoku cloud I think we will get to the resistance level (start ichimoku cloud) on the daily (245).
Nice place to take a position.
position at - 196
Stop loss - 185
profit take - 235 (20% profit target) - you can also take the ichimoku cloud on the daily 245 but don't miss the profit!
Hiddendivergence

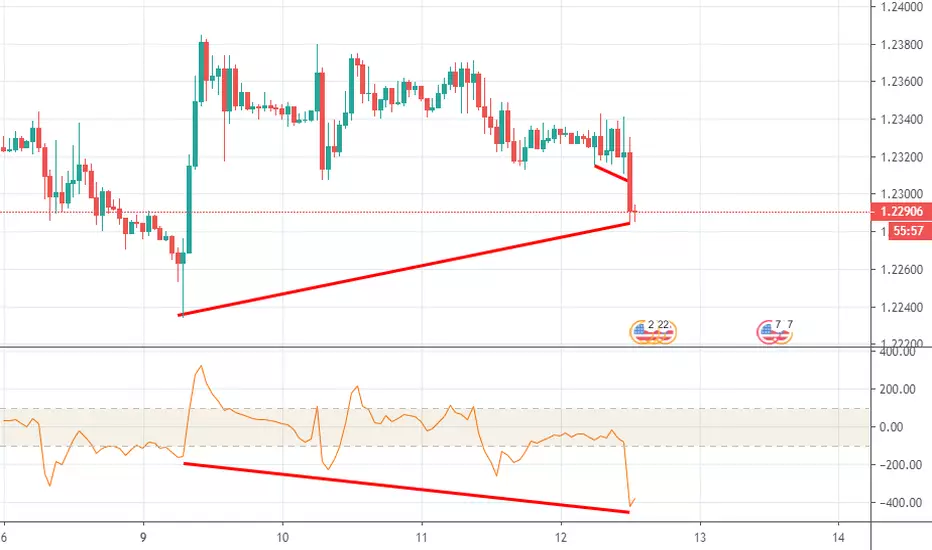
Bear Pennant, Hidden Bearish DivergenceI don't post often, only to point out stuff that sticks out as obvious to me. Red line indicates hidden bearish divergence with higher highs on MACD and lower highs on price. Chart pattern is currently forming a Bear pennant with a target of 148. I've sold and set my buys accordingly.
While there seems to be some drama regarding Parity, as far as I can tell, Ethereum is set for smooth sailing ahead with Phase 0. With that said, Ethereum could still be following Bitcoin's movement as per usual, or the greater economic uncertainty in general. While I'm short short-term, long-term I'm long and am building my stack. With that said, if I read this wrong, I'm still in the green and can look for the next setup.
As always, this is for educational purposes only. I may be awesome, but I'm not a professional and nor is this professional advice.

GBPUSD Time to BuyCCI/Price hidden bullish divergence at H1 TF. Find your buy setup now of you can as well buy now. Target is 1.2664

GBPUSD Confirmation of Retest of Yesterday's Highs There is also a CCI/Price hidden bullish divergence at H1 TF. Price will try to retest highs of yesterday.

GBPUSD Retest of Highs of Yesterday Still VALIDA bad economic data released from UK pushed price a bit down. This down movement formed a regular bullish divergence, confirming the previous hidden bullish divergence.

GBPUSD Price to Retest Highs of YesterdayCCI/Price Hidden Bullish divergence at M15 TF will push price up to retest the highs of yesterday. Find selling opportunities when price move up.

GBPUSD May Be Ready to Retest 1.2384Bullish Hidden CCI/Price divergence developing at H1 TF. Let us look for buy signals.
WAN/BTC -> Correction after bullish move + Hidden bullish Div!WAN is busy with a correction and it seems like it has found his support level.
Also we seen a Higher Low created and a strong/big Hidden Bullish Div.
Position:
Take your position over here (2665)!
Stop loss:
Put in a stop loss below the last Higher low (2570).

XBTUSD Danger zone Bitcoin is in a dangerous zone, and has to break through this resistance ASAP.
If BTC fails, we will see Hidden Bearish Divergence, which is Trend Continuation Signal.
For BTC - It's Now or Never !

Nice trade setup at IOTA (IOTA/BTC)Good R:R
Hidden bullish divergence
Price at the lowest since 2017.
Good luck

#Bitcoin - the importance of Divergences and Pivot 3DI will leave this chart fairly uncommented, it should be very clear what happens, if we start a move up, or will close below the monthly Pivot Level on 3D. Everyone should know how to figure out targets and what happens if they are either met or failed. Pivot´s and Divergences (also Volume) are three of my seven favourite indicators that I have melted into a tool, and that for a very good reason.
*Always set stops. Dyor. No financial advice.
____________________________________________________________________________________________
BitMEX Ref-Link for 10% Fee Discount the first 6 months: www.bitmex.com

Trade Ideas Analysis: GBPAUD S&RAs this looks like a sell at resistance(red) and buy at support(long), it can potentially be a trap to the traders, look how the RSI hidden divergence shows up.
What's your trade plan? Comment down below.

Buy EURJPY (4H)in 4H chart:
head and shoulders pattern
61.8% fibo retracement of last bullish wave
Hidden divergence in RSI indicator (Continuous trend)
Oversold in RSI indicator
Support level at 124.8
> Buy
Entry : 124.85
-Stop : 124.15 (70 pips)
-TP1- : 125.95 (110 pips)
-TP2- : 127.30 (245 pips)

Buy GBPUSD (4H)in 4H chart:
Bottom of the parallel channel
Hidden divergence in RSI indicator
78.6% fibo retracement
> Buy
Entry : 1.3050 (Now)
-Stop : 1.3010 (40 pips)
-TP1- : 1.3165 (115 pips)
-TP2- : 1.3260 (210 pips)

AUDNZD H1 SETUPreasons to take the trade sell : ( waiting for a better momentum candle to confirm the break )
1- double top forming
2- break of the the double top neckline
3- bearish hidden divergence on rsi

Sell NZDUSD (4H)in 4H chart:
top of the bearish parallel channel
pullback to broken support zone
61.8% fibo retracement
hidden divergence in RSI indicator
> Sell
Entry : 0.6705
-Stop : 0.6745 (40 pips)
-TP1- : 0.6605 (100 pips)
-TP2- : 0.6505 (200 pips)
in daily chart:
pullback to broken area and support level
38.2% fibo retracement

Sell EURUSD (4H)in 4H chart:
downtrend line
overbought in RSI indicator
hidden divergence in RSI indicator
> Sell
Entry : 1.1260
-Stop : 1.1280 (20 pips)
-TP1- : 1.1220 (40 pips)
-TP2- : 1.1170 (90 pips)

EURJPY Sell IdeaH4 - As long as 125.70 holds (false breaks are acceptable) we can be looking for sell setups. The hidden divergence started turning into continuing divergence – bottom line is, there is bearish pressure. Testing the 125.40 level would be ideal.
H1 - We can see bearish divergence already forming and the price is inside the resistance zone.

Sell EURUSD (4H)in 4H chart:
top of the bearish parallel channel
61.8% fibo retracement
resistance level
hidden divergence in RSI indicator
> Sell
Entry : 1.1200
-Stop : 1.1235 (35 pips)
-TP1- : 1.1130 (70 pips)
-TP2- : 1.1050 (150 pips)
in daily chart:
pullback to broken daily support level

Sell GBPUSD (4H)in 4H chart:
resistance level at 1.30
hidden divergence in RSI indicator
61.8% fibo retracement
top of the bearish parallel channel
> Sell
Entry : 1.3000
-Stop : 1.3075 (75 pips)
-TP1- : 1.2890 (110 pips)
-TP2- : 1.2790 (210 pips)
in daily chart:
pullback to broken support

Buy XAUUSD (1H)in 1H chart:
support level at 1275
oversold in RSI indicator
hidden divergence in RSI
61.8% fibo retracement
> Buy
Entry : 1275.0
-Stop : 1272.4 (26 pips)
-TP1- : 1282.0 (70 pips)
-TP2- : 1287.5 (135 pips)

Buy GBPJPY (4H)in 4H chart:
Gartley pattern
Hidden divergence in RSI indicator
Oversold in RSI indicator
> Buy
Entry : 144.50
-Stop : 144.15 (35 pips)
-TP1- : 145.25 (75 pips)
-TP2- : 146.80 (230 pips)

Sell EURJPYin 4H chart :
Hidden Divergence & Overbought in RSI indicator
4H resistance
> Sell
Entry : 126.65 (Now)
-Stop : 126.95 (30 pips)
-TP1- : 125.82 (83 pips)
-TP2- : 125.02 (163 pips)
