HIFIUSDT Forming Falling WedgeHIFIUSDT is currently displaying a classic falling wedge pattern, a powerful bullish technical setup that often precedes a major trend reversal. This pattern forms as price compresses within converging trendlines, indicating declining volatility and seller exhaustion. Falling wedges are known for their high breakout success rate, and the current structure on HIFIUSDT is pointing toward a potential explosive upside move once resistance is broken.
The volume profile also supports the bullish case. There has been a noticeable increase in buy-side activity around key support zones, reflecting renewed investor confidence and accumulation at lower levels. When paired with a falling wedge, this kind of volume behavior often marks the beginning of a strong upward rally. Traders and investors anticipating a breakout could potentially see a remarkable 490% to 500%+ gain if the momentum continues to build.
The market interest in HIFI is growing rapidly, with increased mentions across trading communities and social platforms. The fundamentals of the project, combined with this bullish technical setup, are attracting both short-term speculators and long-term holders. The current structure also aligns with historical breakout patterns seen in similar altcoins before major bull runs, making it a compelling chart to watch closely.
For technical traders, a confirmed breakout with above-average volume from the wedge resistance will likely trigger a wave of buying pressure. Managing entries on breakout retests and using proper stop levels will be key to navigating this setup with discipline.
✅ Show your support by hitting the like button and
✅ Leaving a comment below! (What is You opinion about this Coin)
Your feedback and engagement keep me inspired to share more insightful market analysis with you!
HIFIUSDT

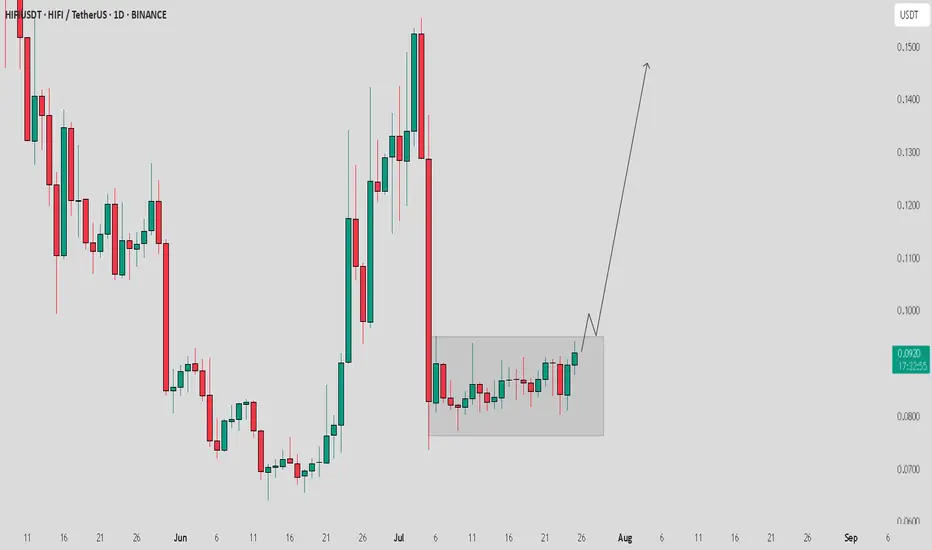
HIFI / USDT in consolidation zone heading to break through itHIFI/USDT Analysis:
HIFI/USDT is currently in a consolidation zone and seems to be heading towards a potential breakout. If it breaks through this zone, we could see a good move towards $0.14 soon, assuming the market remains stable.
Bullish Scenario:
Breakout above consolidation zone could trigger a strong move towards $0.14.
Confirmation: Watch for strong volume during the breakout to ensure the move is genuine.
Bearish Scenario:
Failure to Breakout: If the price fails to break through and stays within the consolidation, the setup might remain invalid.
Note:
Current market situation is not looking very strong right now. I hope the correction happens smoothly soon, but if the market remains unstable, this setup could become invalid. Always manage your risk and stay cautious.
HIFIUSDT Forming Falling Wedge HIFIUSDT is forming a textbook falling wedge pattern on the chart, a classic bullish reversal signal that often precedes strong upside movement. This pattern occurs when price action consolidates between two downward sloping trendlines, gradually tightening before a breakout to the upside. The current structure on HIFIUSDT suggests that the selling pressure is losing momentum, and a breakout could trigger an explosive bullish run. With technical confirmation building and a tightening wedge structure, traders and investors alike are starting to take serious interest in this setup.
Volume analysis further supports the bullish bias. Despite the decline in price, volume has remained relatively stable, a sign that the coin is being quietly accumulated. This kind of price-volume divergence typically precedes major market moves. As the wedge approaches its apex, a breakout with strong volume could ignite a significant price surge. Given the historical price action and chart projections, HIFIUSDT has the potential to deliver an extraordinary 490% to 500% gain from current levels, making it one of the most promising technical plays in the market right now.
Market sentiment around the HIFI ecosystem is also improving, with increased social media engagement, partnerships, and on-chain activity. This suggests that both speculative traders and long-term holders are watching the project closely. As the broader crypto market leans bullish, coins with strong technical setups like HIFIUSDT are well-positioned to outperform.
With its current technical structure, strong community interest, and substantial upside potential, HIFIUSDT presents a rare opportunity for traders looking for high-reward breakout trades. Watch closely for a confirmed breakout from the wedge—this could be the signal that a major rally is beginning.
✅ Show your support by hitting the like button and
✅ Leaving a comment below! (What is You opinion about this Coin)
Your feedback and engagement keep me inspired to share more insightful market analysis with you!

$HIFI - We are at the end of RegressionBINANCE:HIFIUSDT - We are almost at the end of a regression trend. This is probably the last chance to get into this and at this price, before it blows up. All the best !

Forming Potential Cup and Handle Pattern🚨 $HIFI
Forming Potential Cup and Handle Pattern 🚨
$HIFI
is forming a potential cup and handle pattern. For this bullish pattern to be confirmed, the price needs to break out above the red resistance zone.
📈 Technical Overview:
Pattern: Potential Cup and Handle
Resistance Zone: Red area currently being tested.

$WIF Breakout Confirmed 🚨 SEED_WANDERIN_JIMZIP900:WIF Breakout Confirmed?
Dogwifhat has officially broken out of the descending channel and is trading above key resistance with strong momentum.
If bulls hold this zone, we could be eyeing major upside moves.
Key targets:-
• $0.774
• $1.474
• $3.006
• $4.659
SL: $0.305 | Entry: CMP
Is this the start of SEED_WANDERIN_JIMZIP900:WIF ’s next moon mission? 🌕
DRYO, NFA

HIFIUSDT Strong Bullish!HIFIUSDT technical analysis update
HIFI's price is breaking resistance after a 100-day range-bound market, and it is currently trading above the 100 EMA on the daily chart. This can be considered a bullish signal for HIFI.

HIFI ANALYSIS (4H)From where we put the green arrow on the chart, it looks like a triangle is forming on the chart.
It seems that we are now in wave D of this triangle.
The E wave can start from the green range.
We are looking for buy/long positions in the green range.
Closing a daily candle below the invaliation level will violate the analysis.
For risk management, please don't forget stop loss and capital management
When we reach the first target, save some profit and then change the stop to entry
Comment if you have any questions
Thank You

HIFI ANALYSIS#HIFI Analysis : Channel Breakdown
📊As we can see that #HIFI was following ascending channel on 4hr time frame. But we can see a breakdown and 2 times retest the same channel. Right now there is a major support level at 0.4855 and if #HIFI breakdown that level then we would see a dump otherwise it will take reversal from its major support zone.
⁉️ What to do?
- Keep your eyes on the chart, observe trading volume and stay accustom to market moves.🚀💸
#DYOR #CRYPTOCURRENCY

HIFIUSDT | Ready for a Move Higher?Market Context
Is HIFIUSDT poised to climb from this point? It’s looking possible!
Chart Analysis
We recently hit a new low on the daily chart, thanks to a Friday flush. However, this could be the recovery point we’ve been waiting for. Today’s price action hints at a potential false break on the daily timeframe, setting the stage for a rebound.
Strategy
This is a risky trade, but I’m a risk-taker! I’m betting on a bounce and aiming for our profit target. Let’s see if HIFI hits the right notes and moves higher!
Stay tuned for updates and let’s watch this play out!

Hifi/Usdt Plan Hifi/USDT) appears to be on the verge of a potential breakout, with indications pointing towards a forthcoming bullish movement. It is advised to closely monitor this pairing for a potential successful breakout in the near future. If the breakout occurs as anticipated, there is a possibility of a significant bullish move of approximately 40% to 80% in the short term.
It is important to note that the information provided here is not financial advice. As always, it is recommended to conduct your own research (DYOR) and exercise caution when making investment decisions. It is essential to gather comprehensive information from various sources before engaging in any trading activities.
Monitoring key technical indicators, market trends, and potential catalysts can aid in gaining a better understanding of the market conditions surrounding HiFi/USDT. Stay informed and remain vigilant in order to make well-informed decisions regarding your investments.

HIFI/USDT BIG BREAKOUT LOADING HiFi/USDT
HiFi/USDT price is currently in the process of forming a symmetrical triangle pattern on the 4-hour time frame. A breakout is anticipated due to some positive news circulating about this coin. In the event of a breakout, a potential bullish movement of 80-160% is expected.
Please note that the information provided is not financial advice.

HIFIUSD 3DHIFI ~ 3D 📈
#HIFI Make purchases gradually from here, with a minimum target of 20%+. This is the LSE:RWA Sector, the Narrative of which will Evolve for the next few months.

HIFIUSDT (Hifi Finance) Daily tf Range Updated till 13-03-24HIFIUSDT (Hifi Finance) Daily timeframe range. this thing got some insane amount of range space. means if one can catch a opening swing position easiest money to make. cut through 1.1864 clean here but need to sustain above it to reach above level.

HIFI soon will break above the channelHIFI soon will break above the channel and it will continue to go up
🔵Entry Zone 0.7082 - 0.7308
🔴SL 0.6419
🟢TP1 0.7848
🟢TP2 0.9548
🟢TP3 1.1200
Risk Warning
Trading Forex, CFDs, Crypto, Futures, and Stocks involve a risk of loss. Please consider carefully if such trading is appropriate for you. Past performance is not indicative of future results.
If you liked our ideas, please support us with your likes 👍 and comments.

HIFI is going up in the uptrend channelHIFI is going up in the uptrend channel. I expect that it breaks above the channel line
🔵Entry Zone 0.6692 - 0.6918
🔴SL 0.6074
🟢TP1 0.7189
🟢TP2 0.8058
🟢TP3 0.8755
Risk Warning
Trading Forex, CFDs, Crypto, Futures, and Stocks involve a risk of loss. Please consider carefully if such trading is appropriate for you. Past performance is not indicative of future results.
If you liked our ideas, please support us with your likes 👍 and comments.

HIFI buy setupGiven the bullish CH, we have a bullish view on HIFI.
We have sevral liquidity pools above, which is expected to move from the demand range towards this pool.
Closing a daily candle below the invalidation level will invalidate this analysis.
Note that the financial market is risky, so:
Do not enter any position without confirmation and trigger.
Do not enter a position without setting a stop.
Do not enter a position without capital management.
When we reach the first TP, save some profit and try to move the stop continuously in the direction of your profit.
If you have any comments please post them, comments will help us improve our performance
Thanks

📈🚀 HIFI/USDT: No More Choices! 📈 HIFI/USDT is confidently smashing through the trendline resistance, simultaneously encountering a stubborn horizontal resistance. Is this the launchpad for its next bullish move? Let's wait and watch! 🚀
Disclaimer: ⚠️ This is not financial advice. Please DYOR (Do Your Own Research) before making any investment decisions. 🧐💼


HIFI ready to retest 1.0 ++ levels and beyond!HIFI corrected significantly since peaking at 1.30 range. This parabolic move warranted a much needed trim down -- and the market gave way to that correction. HIFI touched 61.8 FIB level with precision and it is currently bouncing off this major order block of support.
Expect some significant ascend from here on -- with a possible new attempt to a fresh peak if it can break its previous resistance at 1.31.
Accumulation has re-started at the current range.
Spotted at 0.840
TAYOR.

HIFI bullish OBHIFI is looking weak atm and is looking to mitigate that 1hr OB below before more run up
Wait for the OB to be mitigated and take a long from there
Follow for more marker update

HIFI reversal might come into playWe are now at 12HR bottom VIDYA support line (green line) and also we are after a breakout of the downtrend and we are in the retest phase of that said breakout, so if the trend and the support holds i can see this going up to somewhere in the green rectangle

HIFI/USDT - Hifi Finance: Failure_Swing◳◱ We've detected a Failure Swing pattern on the $HIFI / CRYPTOCAP:USDT chart. This pattern is a bullish indication and could indicate a potential trend reversal. The next resistance key levels are at 0.5864 | 0.659 | 0.7887 and the major support zones are respectively at 0.4567 | 0.3996 | 0.2699. It is a bullish indication and we may consider buying at the current price zone of 0.6765 and targetting higher levels.
◰◲ General info :
▣ Name: Hifi Finance
▣ Rank: 356
▣ Exchanges: Binance, Kucoin, Bybit, Huobipro, Gateio, Mexc
▣ Category/Sector: N/A
▣ Overview: Hifi Finance project overview is currently unavailable. I'll try to update this in the upcoming analysis.
◰◲ Technical Metrics :
▣ Mrkt Price: 0.6765 ₮
▣ 24HVol: 18,557,676.901 ₮
▣ 24H Chng: 4.189%
▣ 7-Days Chng: 31.78%
▣ 1-Month Chng: 2.46%
▣ 3-Months Chng: 106.77%
◲◰ Pivot Points - Levels :
◥ Resistance: 0.5864 | 0.659 | 0.7887
◢ Support: 0.4567 | 0.3996 | 0.2699
◱◳ Indicators recommendation :
▣ Oscillators: SELL
▣ Moving Averages: STRONG_BUY
◰◲ Technical Indicators Summary : BUY
◲◰ Sharpe Ratios :
▣ Last 30D: -28.54
▣ Last 90D: -13.49
▣ Last 1-Y: -13.87
▣ Last 3-Y: N/A
◲◰ Volatility :
▣ Last 30D: 0.48
▣ Last 90D: 1.34
▣ Last 1-Y: 0.93
▣ Last 3-Y: N/A
◳◰ Market Sentiment Index :
▣ News sentiment score is N/A
▣ Twitter sentiment score is N/A
▣ Reddit sentiment score is N/A
▣ In-depth HIFIUSDT technical analysis on Tradingview TA page
▣ What do you think of this analysis? Share your insights and let's discuss in the comments below. Your like, follow and support would be greatly appreciated!
◲ Disclaimer
Please note that the information and publications provided are for informational purposes only and should not be construed as financial, investment, trading, or any other type of advice or recommendation. We encourage you to conduct your own research and consult with a qualified professional before making any financial decisions. The use of the information provided is solely at your own risk.
▣ Welcome to the home of charting big: TradingView
Benefit from a ton of financial analysis features, instruments and data. Have a look around, and if you do choose to go with an upgraded plan, you'll get up to $30.
Discover it here - affiliate link -
