XAUUSD Daily Outlook | June 23, 2025👋 Hello Gold traders!
We’re entering a new week with structure sharpening around key zones. Price is now hovering just below the decision shelf at 3385, and all eyes are on whether bulls defend structure — or bears trigger the first real trap. Let’s zoom in with pure Daily focus and zero noise.
🔸 DAILY STRUCTURE OUTLOOK
Gold remains in a clear bullish trend on the Daily timeframe, with the last confirmed Higher High at 3452. However, current price is in a retracement phase, testing the area just below the BOS and reacting to recent liquidity sweeps.
Despite rising USD pressure, the bullish structure remains intact unless a daily close breaks below 3315.
📌 Daily Bias: Bullish (retracement phase active)
🧭 Macro Context:
Heavy Fed week: Powell testifies Tue & Wed, Core PCE and Consumer Sentiment hit Fri.
USD may remain supported short-term, but gold still benefits from long-term inflation hedge + geopolitical risk flows.
🔹 STRUCTURAL KEY ZONES (D1)
Type Zone Confluences
🟢 Buy Zone #1 3320 – 3340 Daily OB, FVG base, EMA50 , structure HL defense
🔵 Buy Zone #2 3265 – 3285 Untapped OB + imbalance, deeper fib retrace
🟠 Flip Zone 3363 – 3385 Former BOS, FVG retest, minor liquidity shelf
🔴 Sell Zone #1 3405 – 3425 First sweep of equal highs, premium OB, FVG pocket
🔴 Sell Zone #2 3440 – 3460 Extreme bull trap: clean OB top, imbalance cluster
🎯 EXECUTION PLAN
🔍 Flip Zone is your battlefield — if bulls reclaim this zone cleanly, we may revisit 3405.
📉 3405–3425 offers the first sniper short opportunity: liquidity sweep + OB + FVG = prime short trigger.
📈 3320–3340 is the cleanest high-RR long zone — only enter if price reacts with strength and forms a rejection candle or bullish engulfing.
🧊 If 3320 fails, standby at 3265–3285 for a deeper correction entry backed by clean OB/FVG logic.
✅ SUMMARY & ACTION PLAN
Wait for confirmation at the Flip Zone — do not force direction.
Most precise sniper trades expected:
🔻 Sell from 3405–3425 → target Flip Zone
🔺 Buy from 3320–3340 → target 3385–3400
Only engage with clear OB reactions and strong PA confirmation — no bounce chasing.
💬 If this outlook gave you clarity, drop a 🚀 and a like to support the work — it helps more traders find it.
💡 Got feedback or want to ask something? Comment below — we read everything.
📌 Follow GoldFxMinds for high-precision sniper plans, every single day.
📌 Disclaimer: I'm part of Trade Nation's Influencer Program and receive compensation for using their charts on TradingView. This content is for educational purposes only.
— GoldFxMinds
High

Good KOMA growth potentialAt the end of last week, I recommended keeping KOMA memcoin in mind as having a very high growth potential, as it is only at the development stage. Against the background of a new wave of growth in the second half of this week, we can expect much stronger growth. The minimum goal is to consolidate above the key level of 0.05, which will open the possibility of continuing the trend to the range of 0.075-100. With sufficient volatility, there is a chance of a breakdown immediately to the 0.1 test.
In addition to koma, I am considering chess and fio for work. Also on the weekend, a bul run on fantokens up to 3-5X atm city acm is likely.

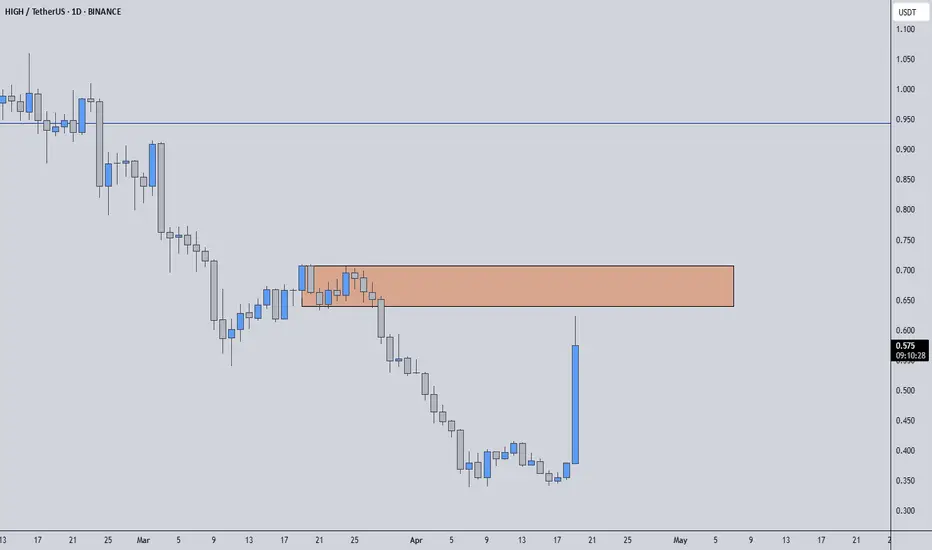
HIGHUSDT Analysis D1HIGHUSDT Already Broken Descending Broadening and started Recovery in D1 Chart
Continuity of momentum can see 80-120% Bullish Rally in Short-term .

HIGHUSDT | +1800% Daily Volume Spike – Major Move Loading?Today, HIGHUSDT is one of the most explosive coins on the market, with an insane 1800% volume spike—this kind of surge never goes unnoticed. When a coin pulls this much liquidity in a single day, it's a clear sign that a major move is coming, and smart traders start watching it like a hawk.
🔍 What I'm Watching:
📈 Scenario 1 – Long Opportunity:
If HIGH breaks out of its current range with strength, ideally with confirmation from LTF breakout structures and sustained volume, I’ll be looking for a potential long setup targeting the next major resistance zone. This move could be fast and aggressive, so reactivity and confirmation are key.
🔻 Scenario 2 – Short Opportunity:
However, if we approach the resistance zone and sellers begin stepping in (especially if CDV divergence or delta weakness shows up), this could give us an ideal short setup. I’ll only consider it with strong LTF confirmations.
📌 Why You Should Care:
I only analyze coins that rank at the top in volume increase, this is how we isolate the setups with the most eyes and liquidity. And if you've been following my setups, you already know: timing and confirmation are everything.
🔥 Stay close. HIGH is about to make a serious decision,and when it does, we’ll be ready to capitalize.
📌I keep my charts clean and simple because I believe clarity leads to better decisions.
📌My approach is built on years of experience and a solid track record. I don’t claim to know it all but I’m confident in my ability to spot high-probability setups.
📌If you would like to learn how to use the heatmap, cumulative volume delta and volume footprint techniques that I use below to determine very accurate demand regions, you can send me a private message. I help anyone who wants it completely free of charge.
🔑I have a long list of my proven technique below:
🎯 ZENUSDT.P: Patience & Profitability | %230 Reaction from the Sniper Entry
🐶 DOGEUSDT.P: Next Move
🎨 RENDERUSDT.P: Opportunity of the Month
💎 ETHUSDT.P: Where to Retrace
🟢 BNBUSDT.P: Potential Surge
📊 BTC Dominance: Reaction Zone
🌊 WAVESUSDT.P: Demand Zone Potential
🟣 UNIUSDT.P: Long-Term Trade
🔵 XRPUSDT.P: Entry Zones
🔗 LINKUSDT.P: Follow The River
📈 BTCUSDT.P: Two Key Demand Zones
🟩 POLUSDT: Bullish Momentum
🌟 PENDLEUSDT.P: Where Opportunity Meets Precision
🔥 BTCUSDT.P: Liquidation of Highly Leveraged Longs
🌊 SOLUSDT.P: SOL's Dip - Your Opportunity
🐸 1000PEPEUSDT.P: Prime Bounce Zone Unlocked
🚀 ETHUSDT.P: Set to Explode - Don't Miss This Game Changer
🤖 IQUSDT: Smart Plan
⚡️ PONDUSDT: A Trade Not Taken Is Better Than a Losing One
💼 STMXUSDT: 2 Buying Areas
🐢 TURBOUSDT: Buy Zones and Buyer Presence
🌍 ICPUSDT.P: Massive Upside Potential | Check the Trade Update For Seeing Results
🟠 IDEXUSDT: Spot Buy Area | %26 Profit if You Trade with MSB
📌 USUALUSDT: Buyers Are Active + %70 Profit in Total
🌟 FORTHUSDT: Sniper Entry +%26 Reaction
🐳 QKCUSDT: Sniper Entry +%57 Reaction
📊 BTC.D: Retest of Key Area Highly Likely
📊 XNOUSDT %80 Reaction with a Simple Blue Box!
📊 BELUSDT Amazing %120 Reaction!
I stopped adding to the list because it's kinda tiring to add 5-10 charts in every move but you can check my profile and see that it goes on..
HIGHUSDT 1DHIGH ~ 1D Analysis
#HIGH This coin is still in the channel decreases, waiting for this resistant line successfully penetrated. Maybe with a minimum target of 10%+.

Breaking: Intuitive Machines ($LUNR) Up 2% In Mondays Premarket The shares of Intuitive Machines, Inc. (NASDAQ: NASDAQ:LUNR ) are up 2.35% in Monday's premarket session. A company that designs, manufactures, and operates space products and services in the United States.
Its space systems and space infrastructure enable scientific and human exploration and utilization of lunar resources to support sustainable human presence on the moon. The company offers lunar access services, such µNova, lunar surface rover services, fixed lunar surface services, lunar orbit delivery services, rideshare delivery services to lunar orbit, as well as content sales and marketing sponsorships.
Technical Outlook
As of the time of writing, shares of Intuitive Machines, Inc. (NASDAQ: NASDAQ:LUNR ) are up 3% in premarket session. Trading in tandem with the 1-month low pivot albeit close to the support point, NASDAQ:LUNR is gaining momentum with a break above the 38.2% Fibonacci retracement point set to be the catalyst to spark a bullish renaissance for NASDAQ:LUNR shares.
Though the Relative Strength Index (RSI) is oversold at 30, NASDAQ:LUNR is looking poised to break the psychological 38.2% Fib level. Intuitive Machines, Inc. earnings is coming up Tuesday, May 13, 2025, before market open.
Analyst Forecast
According to 6 analysts, the average rating for LUNR stock is "Strong Buy." The 12-month stock price forecast is $15.5, which is an increase of 118.62% from the latest price.

XAUUSD selling prediction after breaking All time highAfter sweeping All time high Sell XAU/USD at 2800 - 2803 📉
Stop Loss: 2806 🚫
Take Profit:
TP1: 60 pips 💰
TP2: 100 pips 💸
TP3: Open 🔓
Please ensure to apply proper risk and money management practices ⚖️.

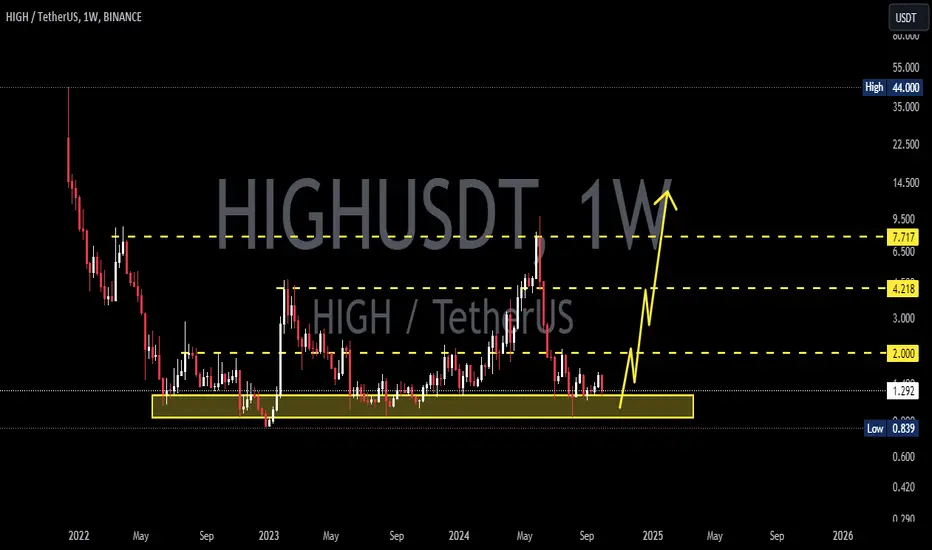
HIGHUSDT 1WHIGH ~ 1W
#HIGH If you still have Conviction on this coin,. This support block would be a very good buying place for now,. buy in stages with a target of 20%++

#HIGH (SPOT) IN ( 1.100- 1.400) T.(7.000) SL(1.051)BINANCE:HIGHUSDT
#HIGH / USDT
Entry ( 1.100- 1.400)
SL 1D close below 1.051
T1 2.200
T2 2.600
T3 3.300
T4 4.000
T5 5.000
T6 5.800
T6 7.000
______________________________________________________________
Golden Advices.
********************
* collect the coin slowly in the entry range.
* Please calculate your losses before the entry.
* Do not enter any trade you find it not suitable for you.
* No FOMO - No Rush , it is a long journey.
Useful Tags.
****************
My total posts
www.tradingview.com
**********************************************************************************************
#Manta #OMNI #DYM #AI #IO #XAI #ACE #NFP #RAD #WLD #ORDI #BLUR #SUI #VOXEL #AEVO #VITE #APE #RDNT #FLUX #NMR #VANRY #TRB #HBAR #DGB #XEC #ERN #ALT #IO #ACA #HIVE #ASTR #ARDR #PIXEL #LTO #AERGO #SCRT #ATA #HOOK #FLOW #KSM #HFT #MINA #DATA #SC #JOE #RDNT #IQ #CFX #BICO #CTSI #KMD #FXS #DEGO #FORTH #AST #PORTAL #CYBER #RIF #ENJ #ZIL #APT #GALA #STEEM #ONE #LINK #NTRN #COTI #RENDER #ICX #IMX #ALICE #PYR #PORTAL #GRT #GMT #IDEX #NEAR #ICP #ETH #QTUM #VET #QNT #API3 #BURGER #MOVR #SKL #BAND #ETHFI #SAND #IOTX #T #GTC #PDA #GMX #REZ #DUSK #BNX #SPELL #POWR #JOE #TIA #TFUEL #HOT #AVAX #WAXP #OGN #AXS #GALA #ONE #SYS #SCRT #DGB #LIT #QI #FIL #GLMR #ATOM #LTC #MANA #ONT #TLM #SLP

MORPHO/USDT Ascending Trendline Support and Long Retest Setup This 4-hour chart for MORPHO/USDT highlights a potential long setup at a critical zone. The price action shows a consistent upward trajectory, supported by an ascending trendline. The recent pullback respects a key horizontal support zone around $3.25-$3.05, aligned with previous resistance turned support.
The setup suggests entering a long position at the current retest level. The risk is managed with a stop loss below the trendline and the support zone at $2.95, ensuring protection against invalidation. The target is bigger, offering an attractive risk-reward ratio.
While the structure remains bullish, caution is advised due to market volatility and potential downside pressure if the support zone breaks. Monitoring price action near the trendline is essential.
Also always make sure to book profit on every 10% of the movement and move SL to Entry for a safe ride and keep reaping more profits without any lose

ALGD, cup and handle could see this coin soarI prefer to keep things simple when conducting analysis. I sift through a number of indicators until I find my favourite few that when used together often 'jive' creating a harmony and increased confidence in an up, or downward trajectory. This time, the most standout items is the Cup and Handle, a labelled in the diagram. Drawing a line that is equal to the height of the cup to the neckline and repositioning it to the neckline and up, we could see significant all time new highs here. The pattern is robust and holds up well. Other coins have seen similar patterns such as BTC, so it would make sense also here. Good luck, follow for more.

<HIGH> FOR BUY!!!Hello friends
This coin has succeeded in turning the trend due to the good flooring it has done.
Now considering that the price is a good place, it increases the value of buying it.
If you like it, we will be happy to support us with likes and comments.

Can #High Bulls Sustain Current Bullish Momentum? Key Levels Yello, Paradisers! Is #HIGH gearing up for a massive breakout, or could we see a bearish trap unfold? Let’s uncover what’s next for #HIGHUSDT:
💎The breakout of #HighStreet from the descending channel formation marks a significant turning point. After months of being trapped in a bearish structure, the breakout above the descending resistance line signals a potential trend reversal. However, the $2.547 level now acts as a major resistance zone. A decisive close above this level is crucial for confirming bullish momentum and opening the path toward the next resistance target near $4.50–$5.00.
💎If buyers manage to take control and break through the $2.547 barrier, we could see an explosive rally into the $4.50-$5.00 resistance zone, aligning with the key levels of previous price action. This move would confirm the bulls are back in charge and could even set the stage for a larger bullish structure in 2025.
💎On the flip side, the $1.600 support level and $1.266 demand zone are critical areas to watch for potential bearish invalidation. A daily candle close below $1.266 would signal a breakdown of the bullish structure, likely driving the price back into the descending channel. This could trigger further selling pressure, pushing the market toward the $0.94 region or lower.
Stay focused, patient, and disciplined, Paradisers🥂
MyCryptoParadise
iFeel the success🌴

#HIGH On the Edge of a Major Breakout From Descending ChannelYello! 👀 Is #HIGHUSDT on the edge of a major breakout, or are we setting up for another fakeout? Let's see the latest analysis of #HighStreet:
💎After 4-5 months of a sharp downtrend, #HIGH is finally approaching a critical moment. It’s testing the upper boundary of a Descending Channel, fueled by a strong Bullish Order Block (OB) around $1.177. While this might look like the turning point we've been waiting for, don't get too comfortable just yet.
💎To truly ignite this rally, #HighStreet needs to overcome a significant hurdle—the Bearish OB between $1.55 and $1.65, which previously served as a strong support level. A breakout above this zone, coupled with increasing volume and confirmation from the 20 EMA, could signal that the bulls are ready to take over. If that happens, expect a push toward the next major resistance.
💎However, if momentum slows down, we could see a pullback toward $1.177, retesting the breakout zone. A failure to hold this level might signal trouble, potentially dragging HIGH back down to the $0.95-$1.03 demand zone.
💎And here’s the real risk—if it breaks below this major support, it would hand control back to the bears, opening the door for a deeper correction and likely crushing hopes of a short-term bullish recovery.
Stay focused, patient, and disciplined, Paradisers🥂
MyCryptoParadise
iFeel the success🌴

AGAIN WITH EURNZD, IS THIS A REVERSAL OR A PULL BACK?EURNZD is currently making a channel move on the 1h which indicates a pull back to previous weekly close. now we are looking for price reaction at 1.79500, a double top forming at this zone will indicate the coming in sellers to drive the price lower. this trade can make as much as 1:7. LOOKING for price to for an engulfing candle on the 1h and 4h or a pin bar candle on the 1h and 4h from this price level. 1.79500 is a key levle.

HIGHUSDTHIGH ~ 1W
#HIGH If you have Conviction on this coin,. Maybe this support Block will be a very good buy for now. at least for 20%++ profit
ICZOOM Group Inc. China Online Sales chips and electornics parts Hear Me out. YES this is one of the craziest up candles I missed !! being scared and went out very soon..and I said this is for pension...and missed a 40x here..
But now it's back to be alive.. I'm not saying the same would happen.
But I do think there is a NICE SPECULATION TRADE here
As such VERY Cautious

ETH Journey to 2025: Key Levels and Market ScenariosHello friends,
In late 2021, Ethereum ( BINANCE:ETHUSDT ) reached an all-time high of approximately $4,900 before experiencing a significant correction, dropping around 80% to a low of $880. Since that dip, ETH has been consistently making higher highs and higher lows, suggesting a potential long-term bullish trend.
I'm focusing on these key levels as important points for any macro cycle movement:
Pivot Points High Low Levels:
HH: $4,100 (Near ATH)
HH: $2,700 (Previous resistance)
HH/LL: $2,100 (Critical pivot)
LL: $1,500
LL: $880 (2022 low)
Bollinger Bands Analysis :
Currently, ETH is within the lower Bollinger Band, indicating a potential oversold condition. Historically, this has been a favorable zone for accumulation, as the price may revert to the mean once the selling pressure eases.
Potential Scenarios:
Bullish Case:
The most critical level to watch is $2,700. A decisive break above this level could pave the way for ETH to challenge the psychologically important $3,000 mark. If ETH can establish $3,000 as support, it would confirm a higher high and potentially signal the start of a new macro bull cycle.
Consolidation Case:
ETH may continue to trade between the $2,100 support and $2,700 resistance, forming a tightening range. This consolidation could set the stage for a significant move once resolved.
Bearish Case:
A failure to hold above $2,100 could lead to a retest of lower support levels. However, as long as ETH maintains its pattern of higher lows, the long-term bullish structure remains intact.
Conclusion:
The $3,000 level appears to be the key for initiating a potential macro bull cycle. Accumulation near the lower Bollinger Band could be a strategic move for those bullish on ETH's long-term prospects.
Risk Management:
Consider using the $2,100 level as a potential stop-loss for long positions, as a break below this level could invalidate the bullish thesis.
Happy Trading!

HIGHTUSDT.4HReviewing the HIGH/USDT chart on a 4-hour timeframe provides a comprehensive look at its recent trading activity and hints at potential future trends. The chart displays a significant downtrend followed by a recent consolidation phase, suggesting a possible change in market sentiment.
Key Observations:
Price Movement: The price has undergone a steep decline since mid-June, bottoming out near the $0.959 mark, which now serves as a major support level (S1). After hitting this low, the price action has shifted into a consolidation phase, indicating a potential stabilization or base formation.
Resistance Levels: There are marked resistance levels at $1.717 (R1) and $2.087 (R2). The price has recently shown attempts to recover, touching and retreating from R1, suggesting this is an immediate hurdle for any bullish momentum.
MACD Indicator: The MACD line is currently above the signal line but very close, suggesting a potential bullish crossover. However, both lines are near the zero line, indicating a lack of strong momentum either way.
RSI Indicator: The Relative Strength Index is currently just below 60, which indicates a slightly bullish momentum but still far from being overbought, providing room for potential upward movement if buying pressure increases.
Technical Analysis and Conclusion:
The recent stabilization and attempts to push towards R1 suggest that the market might be absorbing selling pressure and could be preparing for a bullish reversal. However, the resistance at $1.717 remains a significant barrier that needs to be broken convincingly for a sustained upward move. The next target after R1 would be R2 at $2.087, but this would require substantial buying momentum, which is currently not evident from the MACD.
Trading Strategy:
Given the current market conditions, a cautious approach would be advisable:
Bullish Scenario: Should the price convincingly break and hold above R1 at $1.717, it could present a buying opportunity with R2 as the next target. Traders should consider setting a stop-loss just below R1 to protect against potential pullbacks.
Bearish Scenario: If the price fails to breach R1 and starts turning downwards, a retest of the support level at $0.959 could be likely. Traders might look for short selling opportunities if the price breaks below the support with a stop-loss just above the most recent high.
Investors should closely monitor the volume and other market indicators to confirm the strength of any breakout or breakdown before making significant trading decisions. Always ensure to use risk management techniques to mitigate potential losses.

HIGH's Strong downtrendThe price of HIGH is currently in a strong downtrend, moving towards lower levels. It is oscillating within a defined descending channel, experiencing fluctuations between the upper and lower bounds of this channel. At present, the price is situated in the middle of the channel. The expectation is that it will move towards the upper boundary before potentially dropping back down to the lower boundary.


Get HIGH while low BINANCE:HIGHUSDT.P been dumping hard for the past 5 days and today is 6th in a row. I believe we may expect a bounce soon. Momentum is already decreasing which is the first sign. Might dip lower under 2.6 to collect last portion of liquidity and then bounce back to 4 / 4.4 / 5

