10% !!! Bounce back towards support zone |Overbought|Quick profit, 5 - 10 percent!
RSI: HIGH (75) It's overbought for now...
Trade on your own risk
High

GOLD DECADE CUP AND HANDLEGOLD has a monster CUP and HANDLE playing out on the Weekly TF spanning over 10 years now.
The Housing Market seems to have reached a BUBBLE/HIGH.
What are your thoughts on the markets for the future, please like and comment.
NFA.

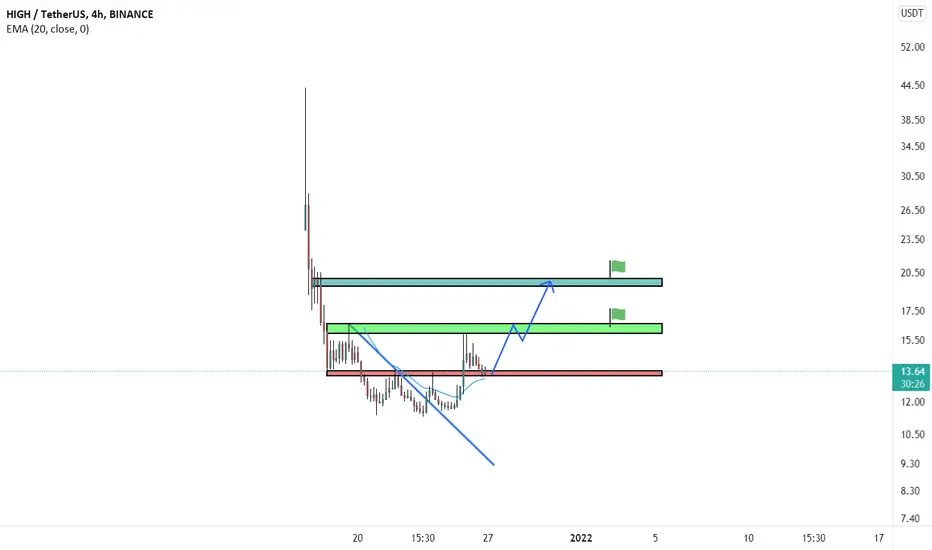
HIGHUSDT - 4Hsee and watch :)
After breaking the red resistance range, it has pullback that range and it seems that it can start moving again from this range ...
EURCHF Trade PlanIf you like my analysis please like and hit the follow button. I need your encouragement.
EURCHF has has been on a decline since it formed a high at around 1.093 in mid-September. The price action however has seen a lot of slowness in the bearish trend as momentum has been diminishing of late. Over the past three weeks we have seen price ranging behavior. We have a break of a major swing to the upside preceded by what appears to be price sweeps of lows. We may be in a great trade if we see PA on LTF as indicated in the chart. We want to see clear intent of price breaking upwards with strong momentum and a slow retrace to the QM level for the buy setup to be valid.

BTC/USDT AnalysisATH Flip level for BTC using Fibonacci and confluence of important levels including structural support, Fibonacci and Monthly High, RSI
RSI : Oversold Zone
Scenario 1) BTC Flips from Fib 0.5 (54300)
Good consolidation and breakout
Target - 81056
Scenario 2) BTC Flips from Fib 0.618
Target - 78600
Further update upcoming
Thank You.

XAUUSD gold will grab bull liquidity!Xaausd (gold) made a trap as seen in my recent post and its back in the POINT of interest so I will be looking for shorts I think it will hit the breakeven from the shorts that got in early at the top its not much liquidity but its something and after that, it will make the move down, in the worst-case scenario we will get above the POI and then get down even harder so keep your eyes open on gold

GBPJPY AnalysisWill be adding to my numerous buy positions with an intraday buy. If price breaks above the resistances lvl of 150.510, this will signify a change of trend to bullish.
Besides on our daily lvl, price seem to have rejected 150.010 lvl.
Weekly be looking plain

GBPJPY Analysis
GBPJPY FORECASTING
Getting a buy off this, price is rejecting the counter trendline on a third touch. Projection to the trendline above current price level.
www.tradingview.com
Meanwhile, a confluence prints on the monthly with an inside bar rejection, will it print a fakeout? Or will the double top prevail in the long run?
Weekly looking ambiguous, will the bullish harami hold out?
Intraday longs can be taken at the break of our penant.

Let the moment begin 580+ PipsFree moment with great vision right now.
TP1# 1.89667
TP2# 1.91493
OANDA:GBPAUD

ATOM COSMOS at 1 day chart is respecting the strong support Strong support since may 21 is maintained by Cosmos, if this support does not break then 1 more All time high may occur, and most probably this will be the last ATH and cosmos will down then... lets hope for the best...


Bullish Move to $400About 2 weeks ago we got some strong bullish momentumfrom $200 to $290-$300 area, after months of consolidating/ranging. Once that momentum died we came back to retest $200 and it seems to be holding as a strong Support and price has yet to break lower. My projections is that bulls step back in and get us across to our all time high of $400.

Potential Gold long swing to 1980Hi Trader,
please see above my current idea on Gold. We are currently forming an expending diagonal. This may explain why we have seen such a deep retrace in the last days.
For more informations please see below,
RT

The Dollar Index is at its ultimate topHi Trader,
please see my idea above. This could help the weak EURUSD to reverse in price and become bullish again.
For further informations see below,
RT

KITEX GARMENTS LTDstrong momentum build in this stock
retail sector in a bullish mode
ema also support
risk/reward favourable

Amyris impulse wave breakout from downward channel ENG/GERENG
Currently, the price is in wave 2, ABC correction.
The correction phase I suspect to 9.20USD
Should the price fall below the 9.20USD would still be a support at 6.10USD to expect.
At 9.20USD or 6.10USD I expect the beginning of the impulse wave 3 which could rise between 44.10USD and 65.21USD.
My primary target is here at the 62.21USD, from there I expect at the latest with an ABC correction to 26.08 USD.
The rise of wave 5 I see up to a maximum of 121.74USD
The red lines serve as resistance lines.
The green lines are the price targets
The orange lines are the support lines of the current correction phase.
Alternative scenario:
If the price falls through the 6.10USD I expect a rebound on the upper line of the trend channel, here I expect a final support to the upside, if the price also falls below here I expect further downward movement.
Amyris Ausbruch durch Impulswelle aus dem Abwärtskanal (ENG / DE)
Aktuell befindet der kurs sich in Welle 2, ABC Korrektur.
Die Korrektur Phase vermute ich bis 9.20USD
Sollte der Kurs unter die 9.20USD fallen wäre noch mit einem Support bei 6.10USD zu rechnen.
Bei 9.20USD bzw 6.10USD rechne ich mit dem Beginn der Impuls Welle 3 die ca zwischen 44.10USD und 65.21USD steigen könnte.
Mein Primärziel liegt hierbei bei den 62.21USD, ab dort rechne ich spätestens mit einer ABC Korrektur auf bis zu 26.08 USD
Den Anstieg von Welle 5 sehe ich bis maximal 121.74USD
Die Roten Linien dienen als Widerstands Linien.
Die Grünen Linien sind die Preisziele
Die Orangen Linien sind die Supportlinien der Aktuellen Korrektur Phase.
Alternatives Szenario:
Fällt der Kurs durch die 6.10USD rechne ich auf einen Rückfall auf der oberen Linie des Trendkanals, hier rechne ich mit einem letzten Support nach oben, fällt der Kurs auch hier drunter rechne ich mit weiteren Abwärtsbewegungen.

GBPUSD +9R Trade - Supply Demand, Liquidity, ExplanationVery nice Trade that I took today.
This is actually the way on how to approach your trades by looking at the options that the market is giving you. In this case I was not sure which Demand Zone the market will pick so I decided to use all 3 Demand Zones. The first was activated and ran into profits. Then I secured the position by moving SL to entry which was a very important decision. We do not want to risk our position if we know exactly that the price can use the liquidity below us. And this is what the market did at the end.
What do you think about this approach?

Shiba inuShiba Inu (SHIB) continued its march upward on Oct. 27 with its price hitting a record high of nearly $0.000060 before correcting lower.
SHIB rallied by more than 25% to an all-time high of $0.00005959, crossing above its previous all-time high of 0.00005000 (data from Binance). The latest move upside pushed the token's month-to-date (MTD) returns to approximately 726%, making it the fifth highest-grossing cryptocurrencies entering the final quarter of 2021.
SHIB's October gains had slipped to near 606% following a price correction from its record high, still higher than the rest of the top-cap crypto rivals, including Bitcoin (BTC), Ether (ETH), Cardano (ADA), and Solana (SOL).

ETH will hit new All-time-high, upcoming $6,000 and $8,000 ETHEthereum has remained strong but slow this year, which has a lot to do with the failures it has faced, or challenges it has faced in becoming scalable. It was first to come out, as a leader of the pack, and showed other projects what not to do. But, it still remains very much a leader today, and I wouldn't be surprised if this eventually jumps Bitcoin for highest market cap.
We have an ascending triangle pattern, with a recent ATH. Once we move past this region, which can bring a lot of resistance to break through. Depending on if Bitcoin remains bullish, and continues to go up - Eth will absolutely cross to new highs, and beyond. Personally, I think Bitcoin will take a minor break here, starting the real rally in early - mid November.
When ETH does reach upwards, it will shoot for these 2 areas: $6,000 and $8,000 - which are fibonacci extension targets on the 1w chart.

algo/usdtalgo break its triangle and can pump soon. its sl is 1.76 usdolar, tp1 is 2.45 and tp3 is 3

Play the breakout on GRTOn the weekly chart we see a large pattern forming, my bias is to an upside break to continue the rally from earlier this year.
Once a weekly candle closes above this pattern expect new all time highs in weeks/months.
If prices fall out the bottom of this pattern and sets a weekly close, that would invalidate this idea.

EGLD to $400 and beyondRisk to reward ratio on EGLD looks very attractive right now.
1. Its just broken bullish out of a huge pattern
2. DEX is due to launch soon driving up demand
3. wen coinbase listing <3
$400 is the most conservative target.

Cardano (ADA) to all time highsCardano has done this in the past, it turns into a stablecoin and looks like its painting a head and shoulders pattern, but then blasts to the upside.
I see the same pattern happening, price is already getting pulled tight. I think once RSI breaks above 50 (seen below) and price breaks UP out of this pattern, we will see cardano returning to all time high within weeks/months.
If we break down out of this pattern, it would invalidate this idea.
