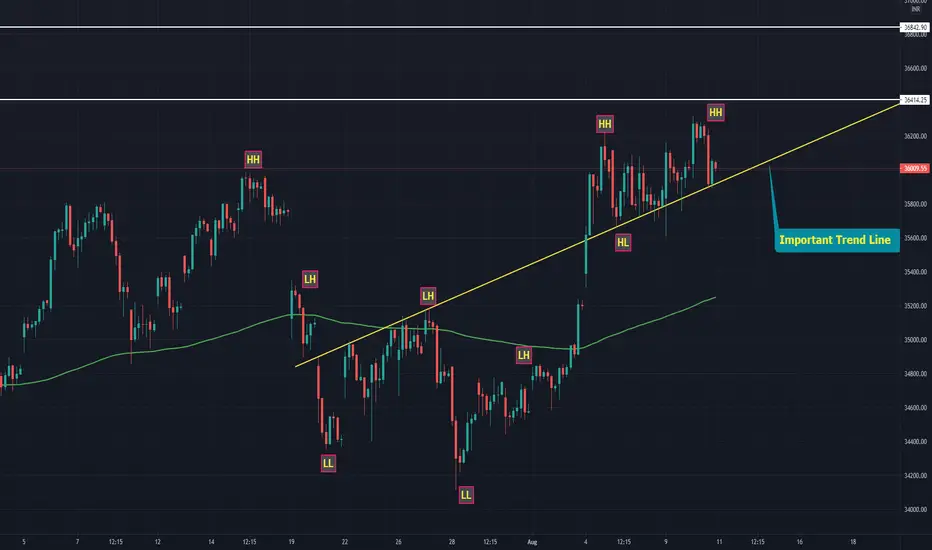
BTCUSDTfor now HHs and HLs of bitcoin is formed an uptrend. the new HL of bitcoin should not be below the last HH in the uptrend. the last HH of bitcoin is shown in the chart.
Higherhigh

AMD: Is it a good time to buy?Hello my friends! Let’s how AMD is doing today!
First, in the 1h chart, it is in a bull trend again, as we have higher highs/lows. The first pivot point triggered was at $ 109.77, and we have a second one that has yet to be triggered at $ 111.70. We are above the 21 ema again, and everything looks bullish from here.
Let’s look for more clues in the daily chart:
Yes, AMD just did a pullback to the area between the 38.2 and 50% Fibonacci’s Retracements and it is reacting nicely. I would prefer to see it at the 21 ema, and there’s still a good chance that we’ll see this happening. If we drop below the 38.2% retracement level again, I see a sideways correction on AMD, something like AAPL is doing.
A sideways correction is the healthiest movement on AMD, in my view, but if it triggers the pivot point in the 1h chart again, and if it keeps above the 21 ema, probably we’ll see a retest of the ATH, and then we’ll see how to proceed.
During the pullback seen in past few days, we see that the volume is decreasing, indicating that this is just a healthy pullback, not necessarily a sell-off. That’s one of the reasons why I don’t see AMD reversing the trend in any level. In the worst-case scenario, I see an annoying congestion. In the perfect world, we would retest the 61.8% retracement, but I’m not counting on that. Personally, I would only buy it if we get closer to the 21 ema.
AMD is a great stock, but I see better opportunities around. Maybe if I had a portfolio of 50 stocks, I would buy AMD right now, but that’s not the case.
If you liked this analysis, remember to follow me to keep in touch with my daily studies.
Have a good weekend.

Candlestick Analysis Only Based on this candlestick analysis will ZM return to a higher high? OR is a down trend about to start?
You are the analyst
Comment your thoughts below

Bank nifty Creating Hight High and Higher Low on Hourly chartBank Nifty is on uptrend keep this chart in mind. Can use on Hourly basis
EURAUD 8 HourPrice currently is following an uptrend making higher highs & lows. Price is now at a very powerful zone making a new higher low, & momentum seems to be slowing down here. From this zone, I will be watching price action for confirmation for price to resume the uptrend for a new potential higher high next.

EUR/USD LIKELY TO MAKE NEW HIGH !! #BUYEUR/USD Seems Strong enough to make New Highs!
Buying of this pair was already recommended at 1.18300 on previous chart.
Note: Please do your own research before any trade action.
Buy Zone: 1.18430 - 1.18530
Stop loss: 1.17730
Target Zone: 1.19920 - 1.20137

BTC BTC BTC <310 day green candle streak and finally a higher high off of this omega downtrend. Close to a 45% pump, this feels so good. Now dump it to 33.5K for a juicy retest and let the alts have a 2x! That would be...perfection.

AUDUSD: Short IdeaHello, Traders!
I expect a short term continuation of this downtrend. If we take the current movement to the downside into account we can see that it's pretty weak and that a flag consolidation is being formed. On the daily time frame the 200 MA indicator might act as a support. It is better to watch this pair closely as it could soon move up again.
What do you guys think? I'd be happy to know your thoughts about it.

Bullish Baise ict Bullish Basie Because price react weakly and daily level h4 clearly bullish so waiting for retracement ..

Bullish trade IdeaNow In dxy and GBPUSD make SMT dvergance .So my baise is Bulish i started looking day and osok Setup in Kill zone

SPCE bound Signals for a bullish Butterfly pattern currently forming.
We might be gearing up for a possible retracement back into the $35-$40 range upon completion of the butterfly, which is where I’d look for an entry.
SPCE seems to be consolidating for the moment, as it builds momentum for the next push to an all time high.
As we gear up and advance towards the July 11th launch date, I expect the volume and volatility to spring back into action for us investors.

Is the Bearish Trend still Possible??Considering the Bearish Trend which created a LLs and LHs inside the Ellipses, we saw an invalidation through the channel which tried to create a HHs and HLs but then the ZONE from the HH was a SUPPORT AREA which we saw a consolidation and a break below, the Break-out was also a consolidation which we were expecting a break either above or below but the certainty was a SELL OFF because we needed to observe the previous price action to determine what to expect ahead. Price has now invalidate the channel up and a break below the ZONE Area. I am anticipating a continuation of the DOWN-TREND because the recent HH is a Swing High and were we have an invalidation of the recent HL as a Swing Low. From the the Fibbonnaci we have seen a correction of 50% towards the Resistance Area, a Bearish Engulfing has been confirmed at the Resistance Area which a SELL OFF is possible and likely to resume a LH and a LL...

GBPUSD, H1 - price at decision pointSequence of higher lows on the chart. Strong key resistance at 1.40. Breaking of this level will continue bullish momentum. Breaking down support at 1.3950 can cause down move.

NOCIL for solid returnsNocil looks great on all the time frames, though it is trading near its all-time high, the price structure looks quite positive on higher to lower timeframes.
Now if the stock sustains 200 levels on the daily timeframe, it could move fast towards its all-time high i.e 236 levels.
For swing traders SL can be kept below, 200 levels.
For Positional trading, Sl is a little far, but it worth it, because of current and previous price action, suggesting that it could go beyond its all-time high if it sustains 180 levels on its weekly timeframe.
The post is for educational purposes, if you are trading this, you are trading at your own risk.
This is my view/analysis on NOCIL, do let me know, what's your view on the stock.

Bullish and Bearish Trend | ForexbeeBullish Trend
Bullish trend refers to consecutive higher highs
and higher lows in the price of a currency pair in forex during a specific timeframe. it shows that there is strong buying pressure.
Bearish Trend
The formation of consecutive lower lows and lower highs in the price of a currency during a specific timeframe is called a bearish trend. It indicates strong selling pressure.

Gold Spot BullishHello traders this is my analysis on gold spot my one of my favorites CFDs Using Heikin Ashi 4H candlestick charts showing higher highs and higher lows price action on this parallel channel still growing strong and still showing bullish signs.
However, I see that we are heading towards psychological resistance price level 1958$ which is a very strong resistance zone denoted in red rectangle which price has tested twice around November 2020 and early January 2020 partly of the decline of corrective wave B.
Price action set up now to break this resistance point with strong buying volume and bullish sentiment from traders and analysis.
I'm 85% confident gold is set up for a bullish market. Get your orders in; place your long positions from anywhere between EP@1890-$1910 ;TP@ 1950
Meanwhile if you enjoyed my content/ ideas, please leave a like and comment and don't forget to follow my trading view account thank you so much.

GME longI believe that GME will have a positive week ahead. I can say the technical aspect of this stock gives me a better perspective that it will turn to have an ideal trade with the help of a good volume.

DELTA CORP LTD Long term trendline BreakThe stock has broken its 3 years downtrend trendline in Dec 2020 and has been able to sustain above it and consolidating in the range of 200- 150.
Currently, prices are trading at and taking support at the lower range.
And it is likely that it might bounce and move towards the upper side of the range at the minimum.
One more positive thing to notice here is the higher high and higher lows structure of this recent rally that started in March 2020.
This could be traded with a stop below 140 levels for an initial target of 200 and if the stock reaches its initial target, it could be trailed for higher targets.
Type of Trade: Positional


EMAMI LTD. - Looking BullishAs per my analysis, EMAMI LTD. is trading in a higher high - higher low formation on a weekly timeframe which confirms bullishness in the stock.
It is currently trading near the support trendline which can be a low-risk entry.
It has the potential of reaching the target of 550+ within the next 1-2 months with a stop below 460 levels.

JMIA Daily analysisPossible HOLD now. Unusual options activity today. Needs to clear that top trendline and get some volume behind it.

LTCUSDT Short tradeHello traders!
LTC has touched the peak of the current trend and now it's will aim to touch the bottom.
Set tight stoploss to avoid big loss
Don't forget to hit the like button and follow to stay connected

