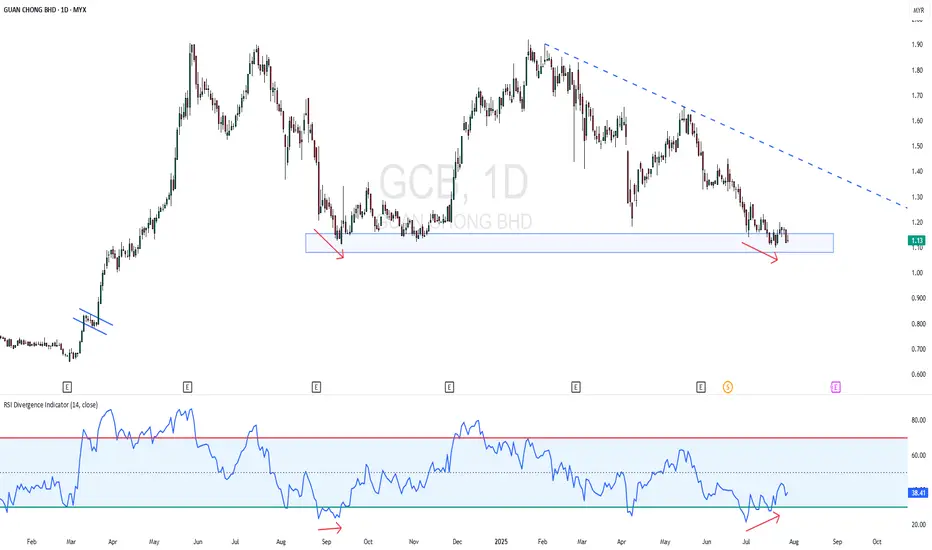
GCB - Near 52 Week LowGCB - CURRENT PRICE : RM1.13
GCB is in a downtrend as the highs and lows both getting low. The stock is near 52 Week Low. However, the stock may rebound higher for short term as there is a bullish divergence in RSI. Price is making lower low while RSI making higher low. Rising in RSI reading indicating there is slightly bullish momentum picking up. Aggressive trader may anticipate for buying with tight stop loss level.
ENTRY PRICE : RM1.13
TARGET : RM1.20 (+6.30%)
SUPPORT : RM1.10 (-2.65)
Higherlow
DRBHCOM - The LOW is getting HIGHER !DRBHCOM - CURRENT PRICE : RM0.815
The stock made a HIGHER LOW recently - this may consider as a half portion of new uptrend is completed. A breakout above RM0.930 will form the higher high structure - which confirm the new uptrend phase.
For short term trading purposes, short term traders may anticipate to buy if the stock breakout nearest resistance of RM0.830 - which will give an entry point at RM0.835. So this is a pending breakout stock. Nearest target will be RM0.870 and RM0.910. While support will be RM0.795. Take note also that MACD give a bullish hint.
ENTRY PRICE : RM0.835
TARGET : RM0.870 and RM0.910
SUPPORT : RM0.795
Notes : If the stock breakout RM0.930 in the future, it is a sign of strong bullish momentum (strong uptrend). So at that particular time, trend follower traders may anticipate to buy at RM0.935 - RM0.940.

Wait for HL to Print.BFAGRO Closed at 40.95 (30-06-2025)
Now wait for HL to print. First support is around 40 and next one is around 38 - 38.50

$BANANOUSDT New ATH possible, nay, plausible??
An extreme local inverse head and shoulders formation can be observed in the area circled in white.
trading just under local VWAP, great entry for anyone lacking potassium.
HL double bottom observable on the daily chart.
if recent trends continue to develop, a strong surge past $0.00162477 could lead to a increase in momentum.
$0.00210914 would be the next resistance, although weaker than the one currently testing. if price continues to develop past $0.00236478, ill be looking for TP1 at $0.00274825, another rough patch through til $0.00339408 follows, about 50% thru that zone would be a good TP2 and 100% thru the zone would be my TP3. the last major resistance would be at $0.00385154 (TP4). after that, a new ATH for COINEX:BANANOUSDT becomes an increasing plausibility. i am long potassium at $0.00143801
ANYONE HAVE MUSCLE CRAMPS?

Extremely Bullish.Closed at 281.50 (05-06-2025)
Extremely Bullish.
But 289 - 290 is an Important Resistance.
Needs to cross & sustain 295 - 308 Zone for
further upside.
as mentioned in yesterday's video, 277 - 279
may act as Support.
Breaking 272 will bring more selling pressure.

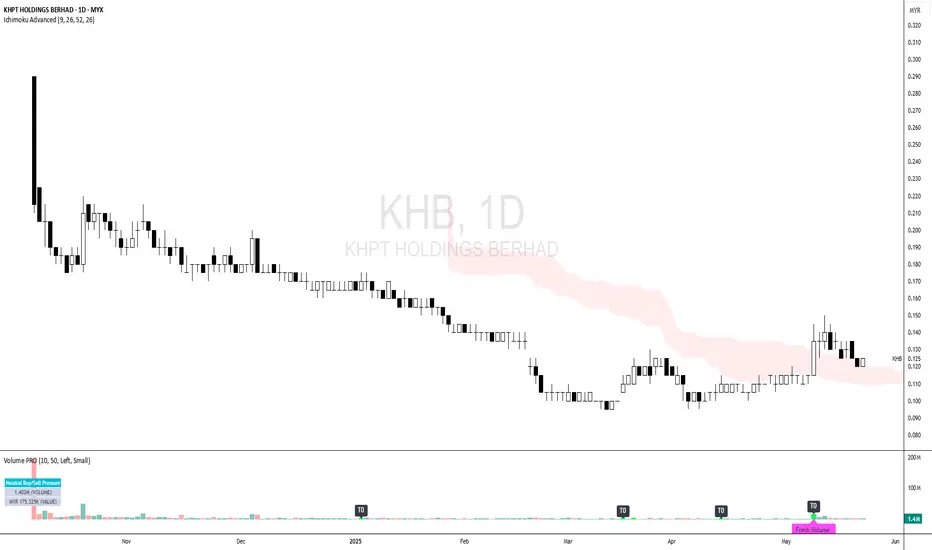
KHB - Downtrend Phase is FINISHED ?KHB - CURRENT PRICE : RM0.125
KHB was in downtrend since its listing day on 08 OCTOBER 2024. Recently the stock price rise with a bullish candlestick on 09 MEI 2025. The stock is making higher high and higher low. This indicates that the downtrend may end. At current price, it gives an attractive RISK REWARD RATIO.
ENTRY PRICE : RM0.125
TARGET PRICE : RM0.140 (+12%) and RM0.150 (+20)
SUPPORT : RM0.115 (-8%) --- The low of long white candle
Though still in Uptrend, but BNL Closed at 37.39 (25-03-2025)
Though still in Uptrend, but
as mentioned earlier, bearish divergence
has started appearing on bigger tf, so
cautious approach should be taken.
It may re-test 35.20 - 36.20 & bounce as this
is an important Support level.
Otherwise next Support seems to be around
32.30 - 32.50

Play on LevelsGGL - Closed at 15.67 (23-05-2025)
Ideal Support levels:
S1 around 15.07 - 15.15
S2 around 13.86 - 14
S3 around 12.80 - 13
Upside targets can be around 17-18
if these supports are respected.

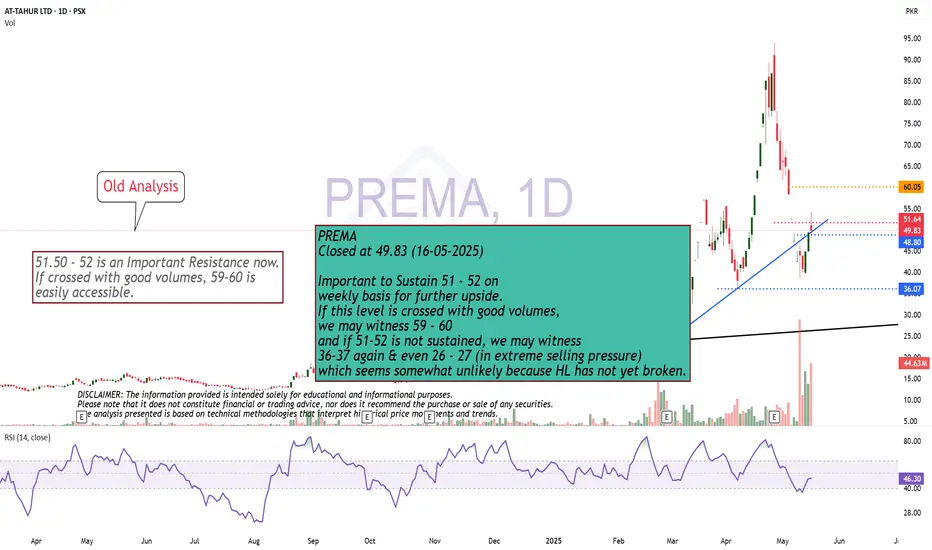
Higher Low intact.Important to Sustain 51 - 52 on
weekly basis for further upside.
If this level is crossed with good volumes,
we may witness 59 - 60
and if 51-52 is not sustained, we may witness
36-37 again & even 26 - 27 (in extreme selling pressure)
which seems somewhat unlikely because HL has not yet broken.
HH HL still intact.
HH HL still intact.
Hidden Bullish Divergence has appeared.
We may expect the reversal only if 36 is not broken.
49-50 can be immediate targets in case of reversal.

$NVDA In, $AAPL Out – AI Supercycle May Be Just Starting🚨 JUST IN: NASDAQ:NVDA surpasses NASDAQ:AAPL to become the second-largest company in the world, right behind $MSFT.
And if that wasn’t enough:
Trump calls Nvidia’s Huang "my friend"
Hints that Nvidia replaces Apple as his go-to tech ally
Meanwhile, Bloomberg reports Nvidia could ship 500,000 AI chips yearly to the UAE until 2027 under revised export rules.
Jensen Huang also confirmed Saudi Arabia is building massive GPU factories, describing them as “energy in, intelligence out” systems.
⚠️ The market may be waking up to the reality that AI is not as cyclical as many feared.
🔍 On the chart:
NASDAQ:NVDA broke to a higher high (HH)
NASDAQ:AMD testing lower high (LH) breakdown resistance
Could AMD follow Nvidia’s breakout? The setup is there.

Support & Resistance
R1 around 95900 - 97100
R2 around 101500 - 101900
S1 around 92400 - 92500
S2 around 88500 - 88900

After Making HH, now towards HL.
After Making HH, now towards HL.
Bearish Divergence is there, so dragging
the price down.
115 - 118 can be a Good Support level.
Couple of Green candles may confirm HL
at this area.
However, if 110 is broken, we may
witness further Selling pressure.

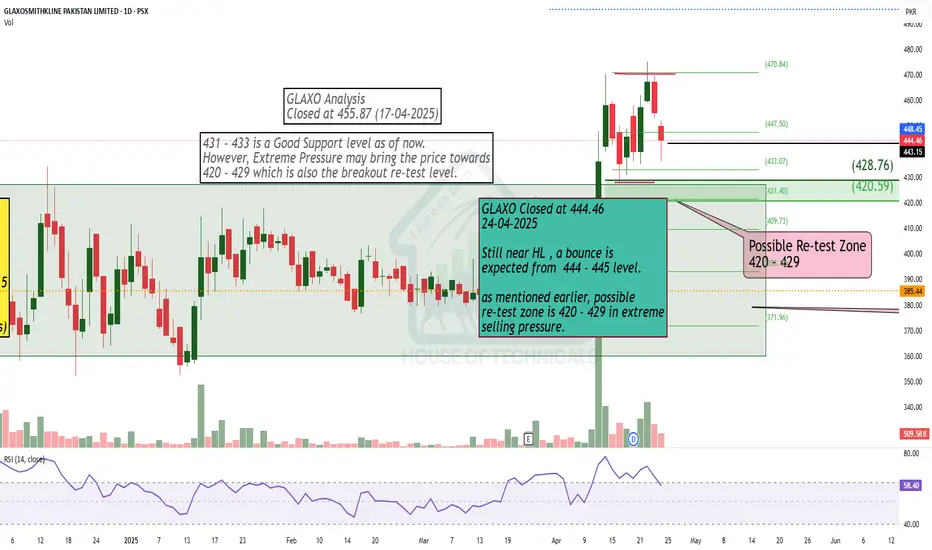
Near HL
Still near HL , a bounce is
expected from 444 - 445 level.
as mentioned earlier, possible
re-test zone is 420 - 429 in extreme
selling pressure.
CHFJPYPrice has been making consistent HHs & HLs on H4. I'll continue looking for buys as long as price respects the support at 169.750.

HL Confirmed on Weekly.HL Confirmed on Weekly TF around 92.
Bullish Divergence on Daily TF.
Crossing 107 with Good Volumes
may lead it towards 112 & then 120+

Weekly+ Monthly ViewWeekly
Recently printed HL on Weekly TF; which is intact
as long as 109400 is Not Broken.
Still Bullish but may remain Sideways unless
Crosses 117200 (Bullish) or Breaks 105000 (Bearish).
Weekly Support is around 110600 - 112200
Weekly Resistance is around 115500 - 115700

Manappuram Buy With Target of 380If Manappuram Closes Above 230 Level in Monthly Candle, Possible to Touch 380 in Long Term

End of Year Palladium Bull Run \o/From the current notation, I see this leveraged ETF on Palladium rising approximately 45% until the end of the year. The reasons are as follows:
Fundamental Factors : With increasing sanctions on Russia, one of the main exporters of palladium, global supply may become constrained. Furthermore, inflationary pressures might drive commodity prices higher. Technical Indicators : The Palladium chart has recently formed a higher high, and a higher low appears to be developing. The price has crossed above the 200-day SMA, and now the 30-, 50-, and 200-day SMAs are bullishly aligned. Seasonality: The seasonal strength in OANDA:XPDUSD is expected to begin the week after next.
So, we could get ready for rising prices in Palladium!

Move up, pull back and up we goAfter reaching its low point in early September, NASDAQ:CPRT appears to have completed its prolonged downward correction and made a sharp bullish move. This move has now been steeply corrected, and I expect the stock price to rise through the end of the year.

SWING IDEA - DELTACORPNSE:DELTACORP has been forming a Lower Low Pattern on the Price Action, while the MACD seems to be forming a Higher High Pattern currently, which could indicate that this stock's Price Action could be reversed and start to form a Higher Higher Pattern too.
In addition, Delta Corp Reports Q1 Consolidate Net Profit At 216.8 Mln.
If all is well, we can start seeing the Price going all the way up to the next Support/Resistance zone.

SWING IDEA - GLANDStock has completed its Correction phase and found its lowest at 860, much below the 1700 IPO listing.
Stock seems to be forming a new Higher High and Higher Low Pattern since Oct 2023.
Also it can be seen following the Trendline as well.
A Hammer on the weekly close last week, could indicate a strong support forming exactly on the Trendline, which is a good sign for further upward move.
If all goes right, the stock could make it to its next leg up.
Stoploss mentioned is crucial. If broken, the stock could start seeing further lows.

SWING IDEA - MAWANASUGStock has currently formed a good support at 116 levels.
It seems to making newer Higher Highs since the last few weeks steadily.
The most recent MACD Crossover has shown a good move upward.
Currently the MACD Cross is in play on the Monthly Charts. Once it completes successfully, the stock could start seeing massive movement upward in the coming weeks/month.
