SPX To 3500 by Friday, Weekend Update - 3800+ ComingThe aggressive pullback we saw after President Trumps tweet was the perfect set up for a bear flag to form and push down further. That didn't happen, instead all the market did was push and grind higher.
This tells us, all time highs are coming. This tells us now is the time to be aggressive. The market still needs a consolidation, a 4 hour higher lower. But it wants to go higher.
Look for a pullback Monday/Tuesday with a push up to 350+ for Friday.
It's important to understand when the market is consolidating, trading in a range or chopping around. It's even more important to identify when it is in an aggressive uptrend. Now is that uptrend. Now is the time to be aggressive.
If you missed out on July/August runs or suffered from FOMO off the March lows. This is your opportunity. This is the time you need to take advantage of the uptrend.
Higherlow

Higher High For Apple In the pure candlestick analysis you can see on the 4 hour chart that I pointed out the higher lows. I also predict the higher high to be $117.50 as of tomorrow as Apple gains momentum going into the special event.

XZC/BTC FALLING WEDGE #XZC#XZC Falling wedge.
2 Patterns in play.
#Rebranding, #Lelantus, #DeFi
Pick your entry and enjoy the ride!


$AAPL 3-Press Low / Higher Low Reversal Attempt$AAPL had their split recently which caused the market to go crazy for a few days after the new pricing came in netting the split buyers a very handsome profit. Once those buyers dumped, prices plunged down to the $100's where it has formed a base of interest just above at $107. Buyers will be looking to maintain a higher low rotation and begin the push back up to wedge highs and further.

XPTUSD Entry 937.512 Exit 1007.768 | PlatinumXPTUSD Entry 937.512 Exit 1007.768 (Parallel Channel) (Platinum)

GBPJPY BUY TRADE USING FIB RETRACEMENTWITH PRIOR BULLISH REVERSAL; EXPECT A HIGHER-LOW ON UPTREND. USING FIB RETRACEMENT WE CAN GATHER PRICE WILL SHOOT UP; 2 TP LEVELS EQUALING 50-90 PIP GAIN

EURUSD Top Down analysisEurusd is in a strong uptrend on the Weekly and daily timeframes.
i am looking for a buy when price touches the weekly and daily timeframes.

2 potential H&S Patterns that could dump price to 9.6k whichever one of these head and shoulders patterns is mroe valid matters not as if either validates the breakdown target is essentiallly the same. If this occurs we will likely fill the 9.6k CME futures gap. I assume once the gap is filled things will be bought right back up and if it does breakdown this will simply be one last effort to liquidate all overleveraged longs. Dipping down to 9.6k will still just be a higher low as long as rebound shortly there after.

USDZAR 17.13930 - 0.69 % SHORT IDEA * TREND CONTINUATIONGood Day Everyone
A look at the DOLLAR / ZAR that has been trading in a descending channel hitting LH, LL looking for a continuation of the trend with the bears on the pair in the coming week looking for a break below support level 17.07766 trading below this level will trigger the trade and we'll be short on the pair.
we'll see how it goes...
HAPPY TRADING EVERYONE
_________________________________________________________________________________________________________________________
ENTRY & SL - FOLLOW YOUR RULES
TP 1 - 16.95705
TP 2 - 16.71227
SL - 17.34574
RISK-MANAGEMENT
PERIOD - SWING TRADE
__________________________________________________________________________________________________________________________
If this idea helps with your trading plan kindly leave a like definitely appreciate it.

Shardacrop chem forming Higher HighsShardacrop chem is continuing to make higher high and if closes above 325 level on daily basis it can rally upto 375-420 levels.

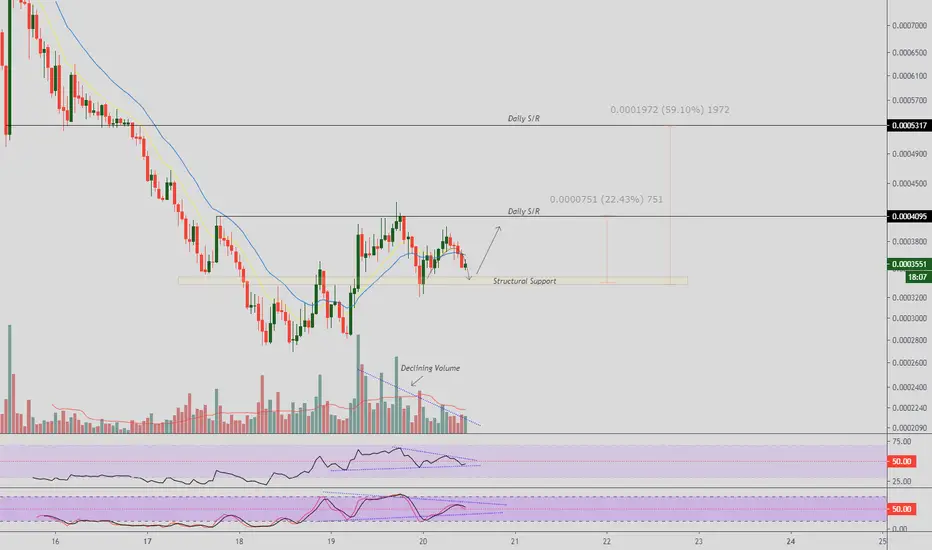
CRVBTC Structural Support|Daily S/R|Equilibrium| Low VolumeEvening Traders,
Today’s analysis – CRVBTC- price action needs to hold structural support for a trend continuation trade.
Points to consider,
- Trend higher lows
- Key support respected
- Daily S/R resistance
- Oscillators equilibrium
- Declining Volume
CRVBTC’s trend needs to establish a higher low to keep market structure intact, allowing for a continued bullish bias.
Structural support has been respected; price action must remain above this level, breaking below will negate structure.
The Daily S/R is immediate resistance; price breaking this level will confirm a higher high, confirming trend continuation.
Both oscillators are trading in an equilibrium towards there apex where a break will be imminent.
This will be in confluence with price breaking key levels.
The volume profile is declining, common in equilibriums, a volume influx will signal a break, follow through is needed to avoid false breaks,
Overall, in my opinion, CRVBTC is a valid long from structural support for a trend continuation trade. Price action is to be used upon discretion/ management of the trade.
What are your thoughts?
Thank you for following my work!
And remember,
“Reaching any goal in trading requires specific domain knowledge and technical skills. But then, after that, it's all mindset management. Yet most people ignore that —they automatically think they have that last part all figured out, and it's a mistake.” ― Yvan Byeajee
Is this the signal of Trend Reversal?It look like public Bank in the Reversal
From last Feb 2019, it start drop
And the downtrend is resisted by 50EMA (Expontetial Moving Avereage)
And last March 2020, it V-shape rebound and break above 50EMA
And create a "higher high" (2 times) & "higher low" (2 times).
if coming week, it trade high, not break down to the lower trendline (Blue) then, it confirm uptrend.
What is your take?

Make It or Break it GBPJPY!!I have much fun analyzing & trading the Great Britain Pound. I'm expecting short term bullish action within the upcoming hours on GJ. Price has been moving back & forth between a 15min Uptrend Channel, while creating higher highs & higher lows during the process. I've identified a few higher lows on the chart. It's also is currently sitting above a 200 moving average after the crossover highlighted on the chart. If price break the 20 ma I set, I see it rising to the local resistance level. Nevertheless, bears could still possibly gain some momentum. I've marked my take profit area. Whats your thoughts on GJ? Love to hear your analysis & remarks!

TEZOS Rhymes With Bezos And Other Reasons To Look For Longs.I normally update Bitcoin, but there is NOTHING to say except that it's still gyrating near the low of the broader range, and we are still long while waiting for it to break higher. MEANWHILE, there has been some unusual and interesting movement in some of the alt coins which in a way reflects the speculative appetite of investors in this increasingly frothy environment. Alt coins have to be some of the highest risk instruments to invest in since they really have nothing to offer besides some kind of "concept". Yet, money flows into anything that can successfully hype its way into the spotlight. Is there any short term value in these things? Sure, wherever there is price momentum, there is opportunity and this is where technical analysis offers the best perspective. In today's video I will evaluate TEZOS and determine what kind of price behavior is reasonable to expect for the coming week.
Usually when I get a question about one of these, it often comes AFTER the market has made it's move. Reasons for these things moving can range from some news about significant advances in the project to "Elon Musk tweeted about it". Either way, IF you are not in from earlier prices, then the next best thing to do is figure out where its inflection points are in order to ANTICIPATE a new potential opportunity. The objective is to isolate locations where reward/risk and probability are attractive RELATIVE to the RISK you are willing to take. If these ideas sound unusual, then you have no business risking real money in alt coins. Novice investors get wrapped up in a "good story" or hype because it offers the illusion of being "informed". The only information of actionable value that most of us have access to is on a chart ESPECIALLY when it comes to short term momentum strategies.
So where are the inflection points on TEZOS? The 2.25 and 2.50 support levels offer historical and proportional areas to look for bullish price action (pin bar maybe?) in the coming week. There is also a minor support at 2.90, which price is testing at the moment without offering any signs of a long setup. The 3.35 area is the current resistance that is in play which is one reference point to measure when it comes to reward potential. The recent structure (since March) is bullish, which means it is reasonable to expect a higher high, so the question becomes WHERE should we take risk? In this situation, I would prefer to WAIT for a setup IF one develops around the mid to lower 2 area. That is where we can assume the least amount of risk relative to testing that 3.35 high area (IF it attempts to test that high). What I like most about this coin (besides the fact that it rhymes with Bezos), is that recent momentum is independent of Bitcoin. A change in this correlation can be related to new capital flowing into this market, and where there is new money, there is potential for it to outperform.

USDCHF LONG, trendline breakoutDOLLAR SWISS made a breakout on the trendline and retested it recently.
Made a seriea of higher lows and is approaching the nest resistance that it may react to.

USD/JPY - Great Opportunity To Buy The Dip!Hello Traders!,
Today I've come across some short-term USD weakness which seems to be playing out as a bullish retracement for further impulses. In this instance I've located a great opportunity to buy the UJ pair with a great 50 PIP target. Lets see how it plays out!
What Is The Market Telling Us?
Market has reversed on previous bearish trend @ around the 106.600 level and has been trending upwards with higher lows
We have had a clear break and retest of our initial support which was previously respected
14EMA sloping downwards which confirms our retracement phase, MAs are still showing bullish sentiment for the market environment
When Should We Enter?
Since we are already in a clear break and retest phase within the market, we should look to execute BUYS soon
BUY as soon as we have a bullish closure above our initial support as it confirms support is holding

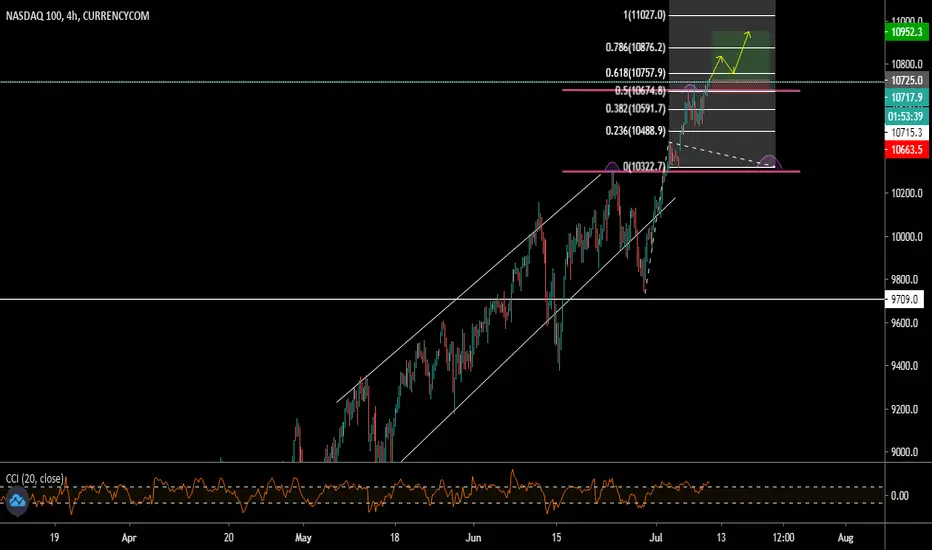
US1000 1072.1 +0.4% LONG IDEA Good Day Evryone
Here's a look at the US100 index , the H&S setup didnt hold as we see the index continues hitting HH & HL we remain in an uptrend on the index so looking for longs from here we just hit a swing low so perfect time to look for entries on lower timeframes...
Good luck and happy trading everyone
_________________________________________________________________________________________________________________________
ENTRY & SL - FOLLOW YOUR RULES
RISK-MANAGEMENT
PERIOD -DAY TRADE
TARGET - 10952.2
__________________________________________________________________________________________________________________________
If you like the idea kindly leave a like and a follow will definitely follow back and leave your idea & Comment on the pair in the comment section. APPRECIATE IT
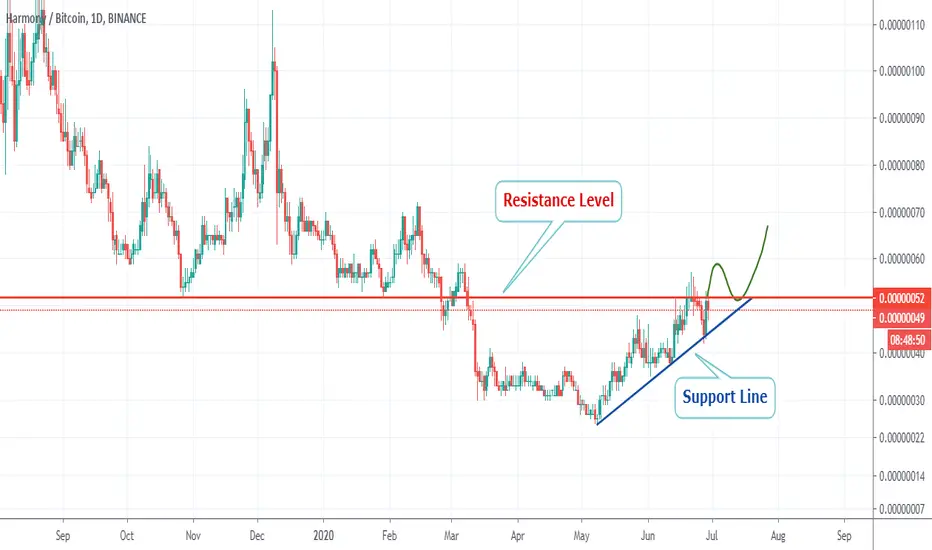
Trading Idea on ONE/BTCHello, Traders.
HARMONY is testing an important resistance region and is above a short-term support line so we are presuming that this asset is on the short term bullish trend, but we need to see the price break this resistance to continue the bullish structure with higher highs and lower highs.
Push the like button and follow us on Tradingview.
GBPJPY LONG, waiting for retest, sign of strengthsGJ has made higher lows, a classic set up of finding strength in the price.
All we have to do is wait for it to break the trend line and previous resistance.
Can either breakout trade or wait for retest, depends on the next coming candle if it has a long momentum candle with large body.
If it ever the price bounced off the resistance or trendline, and breaks off support too, will now find short opportunities.

Trading Call : Buy Century Textile & Industries Ltd.NSE:CENTURYTEX has made CUP N HANDLE pattern and it is about to break neckline of the pattern on Daily Chart. Stock has recently made Higher Bottom and it will going to make Higher Top soon. ADX & RSI has just recently given positive crossover.
We are strongly recommending Buy above 321 level with Stop Loss below 290 on closing basis with Target of 380 in next 6-8 weeks.

Trading Call : Century Textile & Industries Ltd.NSE:CENTURYTEX has made CUP N HANDLE pattern and it is about to break neckline of the pattern on daily chart. Stock has recently made Higher Bottom and It will going to make Higher top soon. ADX and RSI has just recently given positive cross over.
We are strongly recommending Buy above 321 level with Stop Loss of 290 on closing basis with Target of 380 in next 6-8 weeks.

Trading Call : Buy Britannia Industries Ltd. NSE:BRITANNIA is making Higher Top and Higher Bottom on Daily Chart. Stock is trading above all key moving averages. RSI & ADX is also showing strength.
We are recommending Buy around 3425-3450 range with Stop Loss below 3300 on closing Basis with Target of 3700 in next 3-4 weeks.
