Bitcoin Needs More Shorts To Squeeze Please.#Bitcoin peaks at 10,400 before confirming a bearish outside candle formation. Is this the beginning of the next bear market? Maybe for 1 hour chart enthusiasts, but broader price structure CLEARLY hints toward further strength. In this video, I am sharing the ideas and elements that we evaluate in order to gain a sense of perspective that is RELATIVE to the intent of the market. This is part of the decision making process that governs the performance of our LONG only swing trade strategy. The text portion provides a summary of the key points of the video.
1. 9564 to 10,168 is a notable resistance zone where there is a greater probability of a bearish reversal (particularly above the 10,300 peak established in November). For our LONG only swing trade strategy, this provides an inflection point to reduce risk (partial profits) or exiting a trade completely. 3 out of 4 of our previous swing trades reached all 3 profit targets. We sent out an exit signal on our most recent alternate trade to lock in the profit which had not reached target 3 (we shared this idea at 9500). Why exit? The next relevant support is the 8900 area and there is no reason to let this profit erode any further at this point.
2. Just because there is a sell signal, does not mean we are bearish by any means. The broad reversal pattern (inverted head and shoulders) off of the 7275 support zone has established a bullish impulse structure (from 6400 area to 10,400). UNTIL this structure is compromised, we will be open to taking aggressive long signals while interpreting sell signals lightly. 8945 is the support that price needs to maintain in order to maintain bullish momentum.
3. We are waiting for the next higher low and price action reversal to go long. Those who short this are the ones who provide the buying pressure when they are margined out of their positions. This short covering effect is likely to lead price through the 10,400 high and into the next resistance zone in the mid 11Ks. Price action will need to establish a bullish reversal somewhere between the current price and 8900, otherwise we take no action. Can price retrace to the 7K area? Sure, but the probability is low until order flow can provide evidence that such selling pressure exists. Long term opinions mean very little when operating short term strategies. Order flow determines reality, read order flow, not opinions.
Whenever a sell signal appears, the bears pile in, typically with unrealistic profit targets RELATIVE to their time frames and this environment. Difference in opinion is what makes a market because in order to win, someone has to lose. The mark of inexperience is focusing on being "right" in an environment that is highly random. You can be wrong and win, and you can be right and still lose. Sound familiar? Just look at all of the charts posted in the comment section, all trying to prove who's right. Long term performance is a product of two things: ADJUSTING to variable probabilities AND making more when you win, relative to when you lose. Our track records serve as realistic examples of a philosophy that is focused on risk management, not win rate.
Higherlow


US30 LongHighlighted we have US30 make is first low near support.
Then when market open we see a pullback being formed.
Check the 30 min time frame we have a morning star formed and take off.
I think its best to let the candle closed first and then enter.
You could have secured an overall of 2200 pips and only risking about 400 pips.
This is just going through market structure, candlestick formation, and then opening of New York session and the stock exchange.

Oversold Bounce| .50 Fibonacci | Structural Support| Higher Low Hello Traders!
Today’s chart update will be on XRPBTC, testing structural support with oversold conditions poising the probability of an oversold bounce.
Points to consider,
- Trend broke key resistance (S/R Flip)
- .50 Fibonacci current support
- Local resistance to break
- RSI closing in on apex
- Stochastics projected up
- Volume decreasing
XRP broke a key structural resistance that is now probable support; this will confirm the S/R flip which is a very key bullish indication. The .50 Fibonacci is in confluence with structural support, this level must hold true to confirm a higher low in the trend.
Local resistance must break to continue the trend; this will allow XRP to attempt to take out current local highs.
The RSI is interesting as it is closing in on its apex, a breakout is imminent and will dictate the next probable move in XRP, that being an oversold bounce but it must break its current resistance. The Stochastics on the other hand is currently projecting upwards momentum with no real signs of reversing.
Volume is clearly declining which signals a move is imminent, especially when key technical levels come into confluence.
Overall, in my opinion, XRP needs to maintain support above the .50 Fibonacci for a confirmed higher low. The RSI is clearly oversold, increasing the probability of an oversold bounce coming to fruition.
What are your thoughts?
Please leave a like and comment,
And remember,
“Fatigue and mental overload create a loss of concentration – The demands of watching the screen hour after hour make it difficult to be sharp, creating fatigue effects that are well-known to pilots, car drivers, and soldiers.” Brett Steenbarger

AUDUSD Inverted Head N ShouldersFor those that may have issues identifying inverted head n shoulders.
You can use the higher time frames to see if the picture is clearer.
The lower time frames can give you a lot and make a bad trade setup especially if you are not with the trend or not near significant price.
By that I mean if you are not at resistance or support, if you find yourself in the middle of nowhere let price touch that area first then reactive after.
You could have enter at the right shoulder at the opening of New York session, fortunately this trade had no drawdown but you could have given your self a 15 pip stop loss.
This overall trade hit TP for 55 pips it took about a day because AU is a slow moving pair.

GBPJPY LONGLooking for GJ to create an inverted head n shoulder on the 15 min time frame.
Previously has just bounce off 4 hour support.
I would say wait for the right shoulder.

New Bitcoin Buy Signal In Play. Look Out Bears.#Bitcoin new buy signal has triggered upon the development and break of the previous inside bar high. Yet, many still argue that Bitcoin is a short. In this video I point out why I believe Bitcoin is going to low the 9Ks on the next leg, and what common mistake blinds the majority of participants to such a move. The goal here is to provide perspective, and insight into how our decision process is managed for our LONG only swing trade strategy. I aim to provide real value to the community, not persuade you to agree with my view, nor should this be taken as advice.
I am providing the main points of my video here so that you do not have to watch the whole thing.
Note to those who like to criticize: Disagreement is perfectly acceptable, BUT if you can't SHARE your reasoning in a way that provides educational value to the community, then please refrain. You only degrade the experience of this platform which should not be tolerated by those who are making a genuine effort to learn.
1. 8130 support has held and price structure has established a HIGHER LOW. This structure is a sign of strength since higher lows often lead to higher highs. Those who continue to focus on the series of "lower highs" that Bitcoin has established since June are NOT taking into consideration the WEIGHT of the most recent price structure.
2. Sell signals (like the outside bar the appeared about a week ago) do not guarantee there will be bearish follow through. These signals can offer attractive opportunities for very short term oriented styles such as day trading, but any expectations beyond that magnitude and you are BLIND to the clear signs of strength that are now present. In this environment, sell signals as defined by our swing trade strategy carry little weight.
3. In terms of proportionate order flow, the next target area for price is in the low to mid 9Ks. There is a resistance around the 9K area which price has reacted to previously, but short squeeze momentum can lead price through this level (which will take us out at our 3rd profit target at 9250) and into the next zone which borders the low 10K region. This means reward/risk is still attractive for long swing trades taken around the 8500 area.
To be clear, my perspective and analysis is based on the swing trade strategy that we operate. Everyone has their own definitions of what trading means, and in order to compare ideas, it is important to recognize the specific time frame, and magnitude of the inflection points that we are evaluating. So questions about price action on one hour charts are not relevant in this regard.
Overall, the inverted head and shoulders, followed by the recent higher low are clear signs of a momentum reversal within a corrective consolidation (defined by 14K high to 6450 low). This is NOT a bearish trend as I have been pointing out for MONTHS. And if the recent momentum continues for a break of 10,300, THEN we can argue that a broader Wave 3 is in play. And upon confirmation, that will prompt us to change our trend expectations from corrective consolidation to bullish. For our strategy, trend and momentum are not the same thing.

BTC Update! Is weekly lower high set? Can bulls shift weekly?Ok, last chart we discussed the bulls getting above our zone we've had outlined for months on 4 hour chart but zooming out to bigger picture of the weekly chart. We were watching to see if the weekly just set another lower high and anything lower than $10,540 was just another lower high on our weekly chart. Bulls got to $9195 and are currently trending back down. Tentatively it does appear $9195 may be the lower high for weekly so nothing has changed bigger picture...yet. Bulls would now need a higher low compared to $6430 and then shoot for higher highs. Very manageable here. The 4 hour chart losing its EMA support is first sign I watched for to say this weekly is setting its lower high but the Daily chart (not pictured) is actually holding EMA support still. If daily loses EMA support it will confirm the lower high on weekly for myself. There is nothing wrong with a lower high on weekly and it is what was expected. Would ideally like to see bulls hold $8k to give a very comfortable higher low and then seek to push back up above $9200 and ideally towards $10k. Overall healthy consolidation thus far and no red flags for the bulls.
Just My 2 Sats!


Thank You Bitcoin Bears. New Buy Signal Can See Break Of 8500.Bitcoin has established a new buy signal in the form of an outside bar which may be the beginning of the next leg higher. This video serves as an update to my previous written analysis where I wrote, "A close above 7600, followed by 7950 is likely to stimulate a flurry of margin liquidations (shorts following their small time frame charts who are now caught). This buying pressure, along with break out buyers can take price to 8500 or even the low 9Ks in a matter of hours."
In this update I will answer the question, "Is this the retrace to buy into?" and further explain our rationale for positioning TWO WEEKS in advance of the dramatic short squeeze (hint: it is all about understanding probabilities and has nothing to do with logic or news). I realize some community members prefer shorter videos, but I am including the main points here so that you get the idea without having to watch the entire thing.
1. The recent short squeeze was the outcome of a strong catalyst, BUT Bitcoin has been in a position to rally for MONTHS. The patterns that developed as a result of order flow around a particular LOCATION favored LONGS the entire time. Small time frames will blind you to this important context.
2. The 7600 minor support has held and a new higher low is about to be established. Higher lows often lead to higher highs, and there is now a bullish outside bar which can be interpreted as a new buy signal for a swing trade long. The next high is likely to be above the 8500 resistance.
3. Our swing trade from 7250 (taken almost 2 weeks ago) has reached 2 out of 3 profit targets. This means we are only long 1/3 of our original position. This also means price can go below our entry of 7250, and our trade will still be in the green. This is how we define a STRONG HAND. This is the result of positioning based on probabilities, not reacting to news, opinions or random lines on the lower region of a chart.
Capturing short term moves in Bitcoin, just like any other market requires advance positioning. Reacting to news events, drama, and other stimuli is what leads to losing trades. Logic is NOT your friend in financial markets because randomness is high and we will always be competing against VERY LARGE players who will ALWAYS have better information than we do (hint: the CEO of Coinbase, or any other participants at his level are NOT analyzing the RSI on one hour charts to maneuver their capital). See the charts for what they are: a way to gather clues of market intent, construct relative probabilities, and to define risk proportionally to your personal capacity. There is enough information on a chart to make informed decisions, it's just that most traders and investors are not able to recognize it and instead rely on instinct, logic, and backward looking oscillators.

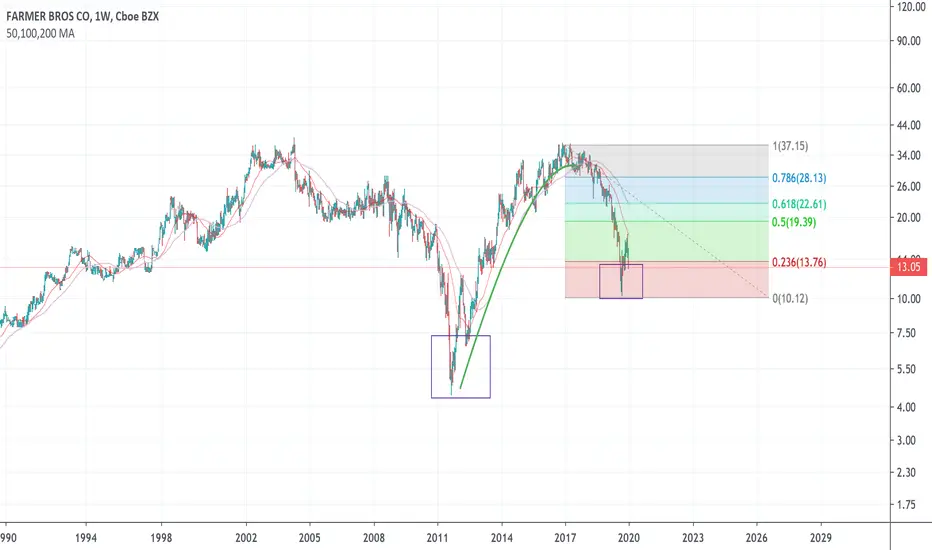
FARM Higher LowLooking to form a new uptrend, FARM has formed a higher low, with scallops present. Included fibonacci retracement levels for possible targets if this turns increasingly bullish.
BTCUSD Long to 8500Short term:
Repeating the previous pattern to 8500 against the bearish resistance.
Mid term:
To drop to a Higher Low, one macro level up, down to 5000.
Long term:
From its Higher low to new highs, negatively correlating with the upcoming 2020-2021 Financial Debt Crash.
Going up to 50.000 to halt and retrace.
Seeing lower volatility in bearish retrace.

Please Feed The Bears. Bitcoin Needs More Buying Pressure.Bitcoin price action has produced a clear bullish reversal pattern in a location where probability favors such a formation. The inverted head and shoulders, although not triggered yet, serves as a pretty good idea as to where this market is going over the next couple of weeks at least. A decisive close above the 7600 level, followed by 7950 should stimulate enough momentum to carry price to the next relevant resistance of 8500. I am sharing the following technical points to provide perspective, context and clarity for the community. This is also the information that we are using to guide our decisions for our recent swing trade long.
1. The recent 6850 area swing low not only establishes a higher low formation (higher lows often lead to higher highs), but it also serves as the right shoulder of a broad inverted head and shoulders formation that began to develop in November. A break and close above the 7950 area and this bullish reversal pattern is confirmed and in play.
2. Yesterday's candle (inside bar) has triggered a new buy signal once price took out 7400. Follow through continues to be limited because of the tendencies of a range bound environment, but reward/risk on the bigger picture clearly FAVORS LONGS.
3. A close above 7600, followed by 7950 is likely to stimulate a flurry of margin liquidations (shorts following their small time frame charts who are now caught). This buying pressure, along with break out buyers can take price to 8500 or even the low 9Ks in a matter of hours.
4. Bitcoin has been in a corrective consolidation since June (this is NOT a trend environment). The price structure since then is now showing the potential completion of a broad Wave 2 (relative to the 3150 to 14K impulse wave). IF Bitcoin confirms this (by taking out 10,300) then a broad Wave 3 is likely in play. Such a wave can take price to 20K and higher in a matter of weeks or months. This scenario also aligns well with the May mining reward halving event.
5. IF the 6800 higher low support is compromised for whatever reason, it will negate the current bullish scenarios outlined here, and call for adjusting expectations for a RANGE BOUND market to continue further. It is important to keep time frames and magnitude of expectations in perspective. A break of 6800 will NOT change the bigger picture trend to bearish.
6. Our profit targets will continue to sit in the mid 7Ks, 8Ks and low 9Ks. 10K is the next MAJOR resistance level, and if Bitcoin is going to produce a large magnitude fake out, that is where it is most likely to unfold. Our goal is to take smart risks and reduce them as much as possible. Exiting 1/3 of our position at each predetermined target accomplishes this goal. (Small bites are what to lead to a positive return over the long run, NOT home runs).
For those that watched my recent video update and have been following this swing trade, we got long about two weeks ago on a break of an inside bar at 7250. There has been a lot of noise and sell signals since then that have gone NO WHERE. The point is this: the effectiveness of trend following strategies is going to be subpar on the larger time frames because the expectations that they produce are not aligned with the type of environment Bitcoin is in at the moment. This means sell signals carry no weight because they are appearing near the LOW of a broad consolidation. Selling near range lows is low probability herd behavior.
Overall, timing is all about letting the market act first, and then adjusting to the new probabilities as they develop. Just like in Texas Holdem, the players who act early in a hand give away important information to those to act after them (who can then make more informed decisions). Letting the market act first allows you to capitalize on the "reactive" order flow, or those who trade on emotion and impulse. This reactive liquidity is made up of the participants who are willing to take the other side of high probability setups. If everyone operated in a rational way, overbought and oversold conditions would never exist and neither would any opportunity. Want to improve your results? Learn psychology.

Bitcoin: 8500 Still On Radar But 6850 Must Not Break.Bitcoin is poised to break out, but needs to clear the high 7600's decisively in order to clear the way for 8500. Price action continues to gyrate within a very wide support zone and the development of the recent failed low structure is exactly the type of broader reversal pattern that we want to see in such an area. The point of this article is to shed light on the technical points that we consider when adjusting to new market information and to provide some broader context and perspective for the community.
I want to thank Reece from Australia, Charvey, Troy Brave (actually met him back in March of 2018!), and everyone else who shared positive comments and constructive feedback about my recent video update. My goal is to publish one of those each week which will serve as an update to these written articles.
So here are our technical points:
1. The broad failed low formation between the low 7Ks and the recent 6450 low is a reversal pattern that has materialized within a major support zone. This is what a market bottom looks like and IF price breaks major resistance levels like 8500, 10,300 and etc., then this structure will confirm the broad Wave 2 bottom that we have been WAITING over 6 months for.
2. There is minor support around the whole number 7K. As long as price can maintain this support, it is likely to squeeze higher. The next minor resistance is in the high 7600's. A decisive break and close above this level can stimulate enough short covering to take price to the 8500 resistance level in a matter of hours or days.
3. Can Bitcoin test lower prices? Anything can happen, BUT price would have to close below 6850 in order to prompt a retest of the 6550 reversal zone boundary. Any bullish reversal pattern in these areas would offer compelling swing trade and position trade opportunities based on the criteria of our strategies.
4. Recent candlestick price action (the bearish pin bar followed by the bullish pin bar) is noise. It is the levels (price location) that carries more weight in this situation and they continue to favor bullish reversals in terms of probability. (In other words, shorts are very HIGH risk).
5. Until the 8500 and 10,300 levels are taken out, Bitcoin price action is still within the boundaries of the "corrective consolidation" that we have seen since the 14K peak. This is relevant because it keeps our expectations within the range of tendencies associated with a range bound environment (lack of follow through, erratic price action, low quality signals, etc). Everyone wants to hear 20K by tomorrow, but price structure does not agree YET.
6. We have preset profit targets in the high 7Ks, mid 8Ks and low 9Ks, BUT any large time frame sell signal that appears near a major resistance level will prompt us to consider a manual exit. In a trending environment it is usually better to let a winner run, the problem is Bitcoin is NOT in a trending environment.
As the market unfolds and provides new information, perspective adjustment is necessary BUT that is not the same as reacting to new information. "Reacting" such as jumping into a new position, or exiting a position is usually motivated by fear. And fear is the key stimulant for the majority of market participants (the herd). Adjusting perspective means figuring out your decisions or actions in advance: "IF Bitcoin does this, I will do this." In the second example, you are not reacting out of fear because you have evaluated the possibilities in advance and have an idea of what is reasonable to expect.
This is not a game about being "right" or predicting the future. It is about managing risk, that's it. Our strategy can produce a string of losses (which it has) but only requires one or two wins to get back to even or ahead. That is how you win when it comes to short term timing. That is why we gauge probabilities based on the price information the market provides and ADJUST them as new information becomes available. Eventually these probabilities align with our reward/risk criteria and we can justify a trade. This is a process, and it has no easy button.
Have a happy, healthy and productive new year and thank you all who have been supportive of my efforts on this platform. Let's make the new year a more informed one.

Next stop 6800? BTC Update
Bitcoin is still under this famous zone between 7221 and 7273. This zone, as well as the 7600 level, has been a problem since the beginning of December.
BTC briefly went briefly above this level and peaked at 7445 before falling back below 7200 and is currently trading at 7174.
Indicators?
The daily and 4h technical situation is negative with a sales signal given by the WaveTrends. On a shorter time horizon, the indicators indicate a possible short term recovery.
What are the possibilities of evolution?
The situation on the longer timeframes indicates that a test of the 7000 or even the 6800 is likely. This will be an excellent entry point as well as a higher low if BTC bounces from this level. Otherwise, a retest of the last lows at 6400 will be very likely.
If the BTC explodes upwards ignoring its technical situation, a retest of the area marked by the red rectangle on the chart will be a good opportunity to open a long position.
In the meantime, stay safe guys!

Bitcoin: Buy Signal In The Bullish Reversal Zone.Bitcoin break out is NOW in play. We shared a LONG swing trade idea with our followers yesterday which triggered at 7250. Although the stop is wide, the magnitude of the reversal structure that is confirmed is likely to lead to a test of the 8500 area resistance at LEAST. The goal of this article is to highlight the key technical points that will guide our decisions as the trade unfolds.
1. The large outside bar off of the 6450 area low followed by a series of narrow inside bars is a CLEAR sign of strength. While follow through may continue to be slow at times, short squeeze (margin liquidations) momentum is likely to lead price beyond 8K, and reasonably into the mid 9Ks over the next week.
2. The general probability of the location (7275 to 5464 support zone) favors LONGS. And now there is a failed low formation off of the 6450 level. This confirms what we have been saying all long: this is NOT a location to sell.
3. The 7600 area presents the first minor resistance. A decisive close beyond this point will prompt us to add to our long term inventory. Averaging into an improving market is a more conservative practice compared to averaging into a weak market.
4. 6850 is the next minor support. IF Bitcoin retraces to this area, and prints a reversal pattern, it will prompt us to take another swing trade. (Swing trades are SEPARATE from inventory positions). With strength clearly returning, in theory price should not test much lower than that (IF it breaks 6850, we adjust our perspective).
5. Bitcoin has a long way to go before it confirms this, but the 6450 level may be the BOTTOM of the corrective consolidation that has contained price action for 6 months. IF 10,300 is taken out, followed by 14K, the next bullish impulse (broad Wave 3) is most likely in progress. This can take MONTHS to develop.
6. As long as price structure maintains its supports, momentum continuation patterns and new bullish reversals will offer setups that have a better chance of following through. We will be open to participating in these even if the best prices are no longer within reach.
These points are a summary of our perspective and provide a framework for our decision making process. Before you get caught up in all the hype that will follow this Bitcoin move, it really helps to understand what drives price.
Chart patterns, news, drama, fundamentals, lots of pretty lines and graphics mean nothing if you do not understand the forces that actually move Bitcoin or ANY market for that matter. The candles or bars that you see on a chart are an expression of order flow and order flow is stimulated by MANY things, but most importantly by the irrational tendencies of human behavior.
If "math and facts" governed markets, there would be no opportunities to buy undervalued or sell overvalued assets because everything would be "fairly" priced. Market behavior (even with the algos) is still an expression of human behavior. If you are just starting out in this game, focus on the psychology rather than charts, math and news. The sooner you can separate from the herd, the sooner you will be able to capitalize on their short term behaviors.

CTSH Bottom ImprovingCTSH has a basing bottom formation underway that is compressing at a higher low level. This pattern often precedes a breakout.

USDJPY | DailyThree touches of 109.279 after which we see that there is a drop in price. Maybe he'll do another HL touch then it will reach 109,480 and he will form double TOP if that happens and if it breaks that uptrend it will go down

AUDUSD potential for Long position(Intraday)As you can see from chart- price failed to make new Lower Low on 28 Oct 2019 and this could be starting of impulse wave for uptrend and since that price go up to make a new Higher High(HH) and Higher Low(HL) until today if u can see from H1 chart.Now price try to make new high from previous daily high on 22 Oct 2019(Box color-Turquoise).My prediction price will go up to find liquidity at high area and go down before buyer start to enter position at discount price area of 0.68600-0.68675.
As you can see from weekly trendline price will make rejection at upper trendline and need to wait for Price Action for breakout or go minor bearish trend.
This is from Daily chart and Daily chart.
Analysis:
1)based on key level from higher timeframe which is Monthly and Weekly
High on candle monthly August 2019-0.68680
Low on candle monthly May 2019-0.68649
if you can see price rejected that price and go up.
2)Based on trendline major high timeframe
3)supply and demand zone
4)High and low of major turning area.

BTC Update! Can bulls hold $8900?We waited a few days to let the dust settle as expected. Volume dropped off and price action has slowed considerably. We were watching for a higher low ideally above $8500 last post with 9k being a level to watch. Thus far $8917 is our higher low. From there BTC began entering an equilibrium which did have a bear break yesterday after briefly tightening up within the equilibrium. EMAs have now caught up and waiting to see what direction this moves. Would like bulls to hold the $8917 low but they continue to flirt within this $9000-9200 area with an inability to shift towards higher levels thus far. Keep a watch on volume as weekend nears as now that things have settled down, I do expect a move to occur rather than just a slow drift downwards or upwards.
Just My 2 Sats!

SPY is throwing a tantrum... it'll get over it!Check out my blog at www.DumbMoneyTrader.com - I just started it, and it will get better for sure!
Just started a YouTube channel as well, and it too will get MUCH better! YouTube me at Dumb Money Trader
I would appreciate all the support I can get on both my blog and my YouTube channel. You guys are AWESOME!!

XAUUSD - GOLDIf one of these price levels holdl, I'll be looking for a retracement to the upside to fill some imbalances and scoop some liquidity before heading back down to mitigate out of some open orders.

USD/CHF - Long and Short AnalysisUSD/CHF recently broke an upward range, pullback to 0.9920-0.9940 is what im preparing for.
Price is sitting in demand zone and has already borken one HL (Higher Low), if it breaks this second one, price moves lower.
