EURAUD Trend Change?EURAUD has been moving sideways all 2022 with a very slight uptrend. After creating nothing but higher highs and higher lows, it has finally had a strong push and created a lower low.
After creating this lower low and bouncing off of the trend line, we have shot straight back up into the supply zone where we created the previous trend changing movement. Indicating a very strong supply zone.
Keep an eye on the 1H frame for a potential entry point to short EURAUD.
Let me know your analysis and your plan for the pair!
Higherlow

INFY LONG ??? RESULT DAY TRADINGGood Morning guys
My Personal view about INFY
Im bullish on INFY
Buy @ CMP
Targets :
1925
1961
2000
sell below will be 1800 (If market close below 1800 level)
Thank you

What ETH needs for an uptrendAfter the recent big dip, many people are looking across the crypto market for signs of strength, to get in on a potential big wave up.
In my opinion the key thing we need to see before anything else is a higher low, and to see how the price action handles a dip at this point. Will price bounce off a new higher low with gusto? Will it create a higher low and consolidate? These are the questions we need to see answered before we can really judge the strength of ETH or the crypto market as a whole.
Ideally bulls would like to see a small dip, followed by a clear pivot and strong persistent positive price action to break through the swing high. This would be a very positive sign that we can drive up toward the next area of potential resistance and beyond.
Until then, this could still be considered a bounce or small correction in the scheme of a large downtrend. Don't count your chicken before they hatch.

Possible Bitcoin Pullback to Daily .618 Fibonacci Support ZoneSimple Bitcoin analysis...
> Daily formed a double top at all time highs with bear MACD and now possibly breaking the recent lows, horizontal support & .382 fibonacci.
At this point...
1. Price can find support here at 58000.00 area/ recent lows, horizontal support, 50ema support & .382 fibonacci and move back up to recent highs.
2. Price can move back up from it's current support area and form a daily lower high (or just continue to fall from it's current price) and fall to 50500.00 area/ .618 fibonacci, horizontal support, trend line support & weekly 50ema support. Lots of support in the area for price to make a daily higher low and continue the current trend back up to all time highs.
3. If price breaks 0.618 / 0.75 fibonacci retracement support area as explained above ( 50500.00 to 47000.00 area ), it could move back down to daily recent lows around 41000.00 before finding support.
I will be looking at the intraday charts to see how price action develops in these areas and wait for the lower time frames to confirm the higher time frames before taking a trade long or short.

Bullish but looking for a Higher LowSo far, UNI is following our projected path (see linked idea), but will it continue? The signs point to continued bullishness, but I'm waiting for a Higher Low to form. I'm looking for bullish divergence around 3300 sats--that will give me confidence that UNI is ready for a stronger bull move.
----------------------------------------------------------------
These are my personal views and not financial advice. Please do your own research before investing.
I'd love to hear your thoughts, ideas and feedback. Feel free to Comment and I'll try and get back to you quickly.
If you appreciated this analysis, consider Liking or Following . Thanks!

SHIB looks tempting hereAfter breaking through trend resistance, SHIB found new resistance at the 200 EMA. Now it has retraced a bit and is possibly creating a Higher Low at these levels. Combined with what looks to be bullish divergence on both the daily and 4-hour charts, I'm feeling good about the Higher Low holding--and would signal a possible breakthrough of the 200 EMA. I'm interested in taking a small position here.
----------------------------------------------------------------
These are my personal views and not financial advice. Please do your own research before investing.
I'd love to hear your thoughts, ideas and feedback. Feel free to Comment and I'll try and get back to you quickly.
If you appreciated this analysis, consider Liking or Following . Thanks!

REN/BTC - Making a Higher LowI find REN very beautiful here, especially now that DEFI is reviving.
Higher low on an important point where there is a lot of support.
A higher high (close) was also seen before that.
Also bottomed on Weekly Demand here.

BTC possible reversal Hello traders and HODLERs and welcome to my Analysis.
I noticed something really interesting developing in BTC's descending channel.
a series of lower lows are intercepted and a higher low has appeared on this 4H time frame.
BTC has created a beautiful W (double bottom) pattern and has already closed a 4H candle above the neckline.
The price target of this W pattern is almost 50 k. Right now BTC is being traded above the dynamic resistance of the descending channel.
closing a 4H candle above this resistance line would definitely improve market sentiment and pump more bullish momentum.
let's see how will this play out.
Disclaimer: The above passage is not a financial or investment suggestion, it is merely my opinion.
Trading cryptocurrency is very risky and you should always DYOR before opening any trade.
Thanks for reading, I appreciate your comments on this one.

PCRX DailyNASDAQ:PCRX long setup:
Today's bar was very impressive and closed at the high of range and broke a possible trendline
The chart has a nice process over the last few months. Big bear trap in Oct followed by a higher low in Nov
20 EMA has crossed above the 50 EMA and they are both accelerating up
Entry above today's high at 59.36
Stop under Dec 16 low at 55.29
Profit target just under Mar high at 79.75
Risk/Reward ratio is 5

BTC Rejection!From my previous post, you'll notice that BTC fell below an ascending channel, that's been around since July 2021. Since then, it came back up to retest the channel but the bears have stepped in and managed to push prices back down. This rejection has BTC currently trading back in its previous range 47k - 50k. If the selling pressure continues, we can see a 5% drop to the previous support. Let's watch closely.
Love it or hate it, hit that thumbs up and share your thoughts!
Don't trade with what you're not willing to lose. Safe Trading Calculate Your Risk/Reward & Collect!
This is not financial advice.

BTC Price is making Higher Highs and Higher Lows (EN)Hello lovely people
I have good news! Bitcoin Price is making HH and HL in the chart according to my last idea there is ex-resistance trend line which is now supporting price. this was what I truly waned to see happen for price. now we can say that last dump we have seen could be a huge pullback after price broke "The Old 206 Daily resistance".
I hope this was useful for you.

BTC higher low 4H?BTC 4h potential higher low after bouncing off support zone. Not enough data to get a good idea right now. Now, we wait.

VIX. A change in behavior to say the least! Head winds in weeks!What Is the Cboe Volatility Index (VIX)?
The Cboe Volatility Index (VIX) is a real-time index that represents the market's expectations for the relative strength of near-term price changes of the S&P 500 index (SPX). Because it is derived from the prices of SPX index options with near-term expiration dates, it generates a 30-day forward projection of volatility. Volatility, or how fast prices change, is often seen as a way to gauge market sentiment, and in particular the degree of fear among market participants.
The index is more commonly known by its ticker symbol and is often referred to simply as "the VIX." It was created by the Chicago Board Options Exchange (CBOE) and is maintained by Cboe Global Markets. It is an important index in the world of trading and investment because it provides a quantifiable measure of market risk and investors' sentiments.
KEY TAKEAWAYS
The Cboe Volatility Index, or VIX, is a real-time market index representing the market's expectations for volatility over the coming 30 days.
Investors use the VIX to measure the level of risk, fear, or stress in the market when making investment decisions.
Traders can also trade the VIX using a variety of options and exchange-traded products, or use VIX values to price derivatives.

My AAL IdeaHello again,
You know I like to keep things simple
I just trade on Price Action.
Airline stocks are still risky but it's worth a shot here.
As you can see 19-20$ is holding as support.
For me that's a buying opportunity.
Below 18.30 I would cut it
I'm going for a HH here so $30-31 would be my target

BTC - Scouting an 8H Higher Low - In 3DFirst a 4h then 8h Higher Low with a reversal pattern on the shorter frames are on watch.

Bullish Move to $400About 2 weeks ago we got some strong bullish momentumfrom $200 to $290-$300 area, after months of consolidating/ranging. Once that momentum died we came back to retest $200 and it seems to be holding as a strong Support and price has yet to break lower. My projections is that bulls step back in and get us across to our all time high of $400.

USDCAD | Trend Lines; Exponential Moving Averages; Higher LowsUSDCAD is still bullish. Why? Because the currency pair is still creating higher highs and HIGHER LOWS.

How To Trade The Symmetrical Triangle (Higher Lows, Lower Highs)Lower Highs are represented by the diagonal trend line. These lower highs are the resistance line.
Higher Lows are represented by the diagonal trend line. These higher lows are the support line.
Breakout Candlestick
Retest Candlestick
How To Trade The Triangle Chart Pattern
First, Look For An Up Trend
Second, Draw Diagonal Support Line and then draw Diagonal Resistance Line. These lines are your levels.
Third, Wait For The Breakout Candle. Enter after the candle closes.
Fourth, Wait For A Candlestick To Retest Diagonal Trend Line. Enter after the retest candlestick closes.
Fifth, Set Target Using Height of Pattern

Shorting BitcoinLooking for a higher low to be created down below. This is just what I see happening on a smaller time frame.

Trade Using Exponential Moving Average and Trend LineHigher Lows Are Represented By Diagonal Trend Line
Lower Highs Are Represented By Diagonal Trend Line
After Price Closes Above Diagonal Resistance Line (Lower Highs), Enter A Long Position. Enter using the closing price of breakout candle. Enter a second long position when price forms a rejection candlestick wick in the EMA 10 EMA 20 Area. Enter using the closing price of rejection candlestick.
H2, H3, H4 Chart. EMA 10 is above EMA 20 in these chart timeframes. EMA 10 Above EMA 20 on multiple timeframes is a good indicator that the market is bullish.

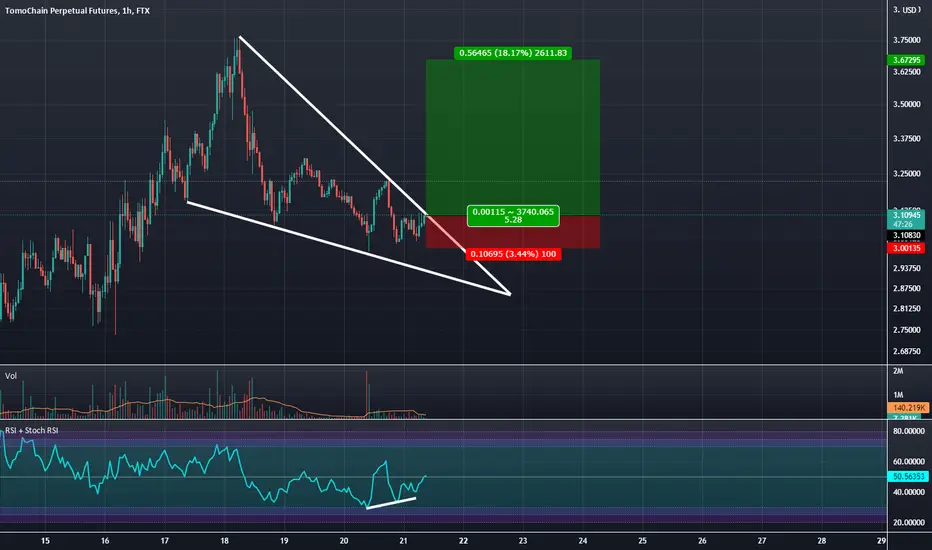
TomoChain: Falling Wedge Breakout.There is a Higher Low Double Bottom going on here with some Bullish Divergence on the RSI and the RSI going over the 50 line as we Breakout of this Wedge. My target will be the .886 retrace
NZDUSD LONG 1DAs you can see, the photo shows everything detailed this is a classic sample of Dow Theory. You can take a look at the bigger time frame by yourself because this bullish chart pattern seemed like a correction movement. Now I believe that there might be an impulse movement. If you're following my idea, then manage your risks as always thank you.

weekly BTC chart insight, a possible scenario to consider I placed a wager that Bitcoin will not hit $70,000 before November ends, before placing the wager cos I haven't done so before, I had to look at my chart and understand what the price action looks like cos I am a pure price action trader. Considering the build up so far, a person can identify that we have seen quite a retest from 8th of March through 10th of May, before a sell off to the Key Support we have now, from this level we started identifying a HH and HL, if we can get another SUPPORT at $51917 then we have a new HH and HL, otherwise if we see a sell of below that price then it has invalidate the idea of a Bullish Move. However, I am looking at several scenario from looking at the chart, There is the possibility of a DOUBLE TOP forming if we see a BEARISH ENGULFING closing at the end of the week.
Looking at the indicator session, we will see where price has alternated from oversold to overbought area touching respectively 0% and 100%, also, both the price action on the chart with TREND-LINE acting as RESISTANCE and on the indicator with the TREND-LINE acting as a RESISTANCE indicates that we are looking at the possibility of seeing a sell off.
The key take away here is that if the current weekly candle closes as BEARISH we could a sell off.
