$LINK: Pitchfork still providing clear S/R levelsHey yall. I think $LINK is looking really good here! We've seen a pretty clear A&E bottom with higher lows being created! As you can see the blue 1.0 pitchfork prong that acted as such strong support is now acting as a clear resistance! If we go back to re-test that 19.50 levels where we previously held and failed, I'd expect a bounce to above 20 and to continue our way back up!
Fundamentally SWIFT news and the amount of integrations and partnerships only continues to grow for Chainlink. Smartcon is coming. Super linear staking is coming. Any $LINK price under 50 dollars is a gift. I've been buying these last few weeks. Long term plan still intact.
Higherlow

Ethereum Trendline BreakCOINBASE:ETHUSD might have put in a bottom. It has made a series of higher lows and has now broken the down trendline. Looks good on 1HR/2HR/4HR and the daily chart is on its way.

GBPUSD, H1 - price at decision pointSequence of higher lows on the chart. Strong key resistance at 1.40. Breaking of this level will continue bullish momentum. Breaking down support at 1.3950 can cause down move.

BTC short term decision timeAfter breaking down from a recent pennant it is now decision time for Bitcoin to print another low. The question is whether or not it will be a higher low in the short term.
Failure to print a higher low could result in a further drop and more continued macro sideways movement. Whereas printing a higher low may assist the price to push higher and have another crack at early 40k prices.
It will be interesting to see if another attempt at the early 40s will surpass them, or if we will get rejected again.
Also as a side note, we recently got supported by the 0.5 fib retracement which is a good sign.
With the current market sentiment, I am expecting further sideways movement for a few more weeks or months. But my opinion doesn't dictate the market's movements.

Bullish and Bearish Trend | ForexbeeBullish Trend
Bullish trend refers to consecutive higher highs
and higher lows in the price of a currency pair in forex during a specific timeframe. it shows that there is strong buying pressure.
Bearish Trend
The formation of consecutive lower lows and lower highs in the price of a currency during a specific timeframe is called a bearish trend. It indicates strong selling pressure.

Gold Spot BullishHello traders this is my analysis on gold spot my one of my favorites CFDs Using Heikin Ashi 4H candlestick charts showing higher highs and higher lows price action on this parallel channel still growing strong and still showing bullish signs.
However, I see that we are heading towards psychological resistance price level 1958$ which is a very strong resistance zone denoted in red rectangle which price has tested twice around November 2020 and early January 2020 partly of the decline of corrective wave B.
Price action set up now to break this resistance point with strong buying volume and bullish sentiment from traders and analysis.
I'm 85% confident gold is set up for a bullish market. Get your orders in; place your long positions from anywhere between EP@1890-$1910 ;TP@ 1950
Meanwhile if you enjoyed my content/ ideas, please leave a like and comment and don't forget to follow my trading view account thank you so much.


Dogecoin/USDollar EMA 10 EMA 20 Pin Bar H4 ChartThe open|close price is beneath the EMA 10 and above the EMA 20. Open|Close Price is in the EMA 10 EMA 20 area. The high price is above the EMA 10 EMA 20. The pin bar is located at a higher low.


EMAMI LTD. - Looking BullishAs per my analysis, EMAMI LTD. is trading in a higher high - higher low formation on a weekly timeframe which confirms bullishness in the stock.
It is currently trading near the support trendline which can be a low-risk entry.
It has the potential of reaching the target of 550+ within the next 1-2 months with a stop below 460 levels.

SPX: Key points to be aware of! An unbiased analysis.Hello traders and investors! Let’s see how the SPX is doing today!
As we discussed in our last study, SPX is in a bull trend, and we have no convincing reversal sign around . Honestly, I overestimated the bears and thought they would make the index retest the 4,119, but they couldn’t even do that.
But how about now? The main challenge SPX has is the purple trendline in the 1h chart. Although we are doing higher lows, we still don’t have a clear higher high, and the purple trend line along with the blue line at 4,187 are two important resistances for the index.
The SPX must break these resistances in order to retest the ATH again, but what if it fails in doing that? I believe the daily chart may offer us more clues about it:
The 21 ema is pointing up, and we have a support level at 4,119, which wasn’t retested yet. If SPX fails in resuming its bull trend, we could see a congestion that could last for several weeks , and if it loses the black line, the purple trend and/or the red line will be the next targets to work with.
But so far, we must wait for confirmation, and not jump into any conclusion. I’ve seen more people losing money trying to predict the top, than when the market crashes. And even if it corrects to the red line again, this point is quite close to the 21 ema in the weekly chart :
So, a sharp correction wouldn’t be the end of the world , and the major trend would still be bullish. Therefore, let’s be careful here! And remember to follow me to keep in touch with my daily studies, and if you liked this idea, please, support it!
Thank you very much!

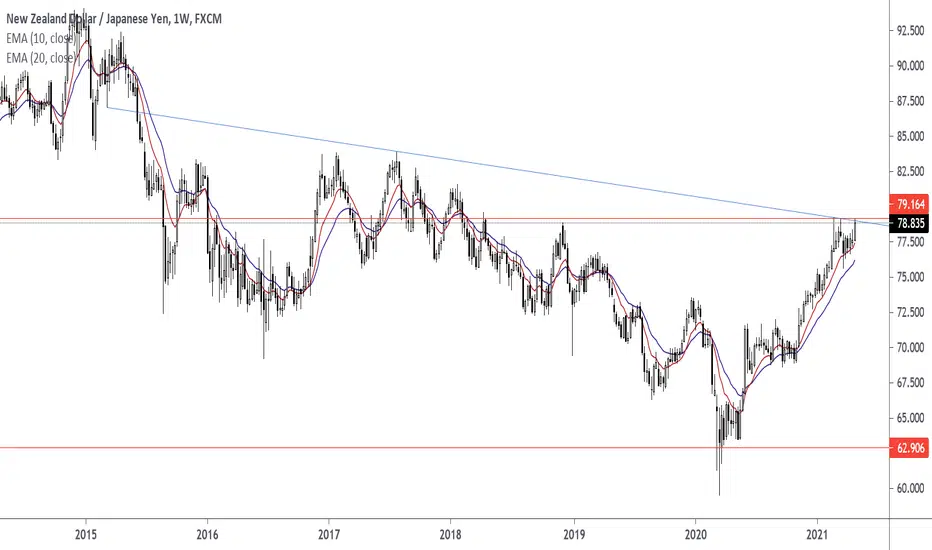
NZDJPY Higher Lows on the Weekly Chart, Daily Chart, H4 ChartHigher Lows are pushing into trend line resistance. Watch for a breakout at 79.164 and enter using a price action signal.
EMA 10 EMA 20 are pointing up on the Weekly Chart, Daily Chart, and H4 Chart.
$HUSQ_B long swing tradeHey guys, today I've taken a look at OMXSTO:HUSQ_B . Its a swedish company with focus on outdoor power products and gardening tools. They have an average of 44B in annual revenue. The company has an average annual growth of 4%.
Enough about fundamentals now to the thing you came here for!
If you look on the 2h timeframe you can deduce that It made a higher low. On the daily It just hit support at 117.75kr.
I see this bouncing Its way back up to 128.80kr before next thursday. With this said I'm going long.

SNDL: There's no hope for SNDL? Maybe there is.Hello traders and investors! Let’s see how SNDL is doing today!
The support level at $ 0.95 didn’t hold the price at the first moment, but SNDL is trying to do a nice reaction right now. For the first time in more than one month, we have a clearly higher low in the 1h chart.
This means that if SNDL breaks the $ 0.95 again and triggers the pivot point at the black line at $ 1.03 , it’ll trigger a reversal pattern that could make SNDL fly again. This pivot point is so important because it can reverse the bear trend in the daily chart as well:
Finally, the volume is increasing again, which is something we needed for a long time. We talked about how the volume must increase for SNDL to start a new movement in our last analysis, and if you missed it, the link is below as usual.
Now the volume is increasing, which is good, but today’s candlestick pattern is quite frustrating, right? Yes, but the pivot point at $ 1.03 is the most important key point for the short-term, and regardless of how the candlestick looks at the end of the day, it won’t change this key point.
If SNDL is serious about reversing the bear trend, it must do a very strong bullish structure, and these things take some time, so, let’s calmly wait for more clues in the next few days.
And if you liked this analysis, remember to follow me to keep in touch with my daily studies, and please, support this idea if it helped you!
Thank you very much!


$BTC Needs ATH for Weekly Bull Momentum to Continue $BTC bulls will look to keep the higher highs and higher lows pattern coming into this week.
We'll need an ATH to keep the bull momentum in the long term.
Feels like heavy price suppression as close to 60k as the bulls can get. 58k support has moved up to 59k-60k recently which bodes well for another leg up.
Let's see if we can get enough volume to confidently break the current ATH.
J.Crypto

CHFJPY Higher Lows On The Weekly Chart | Watch Level 118.180Watch for a breakout at 118.180. Look for buying opportunities above 118.180. You will see higher lows pushing into horizontal resistance line. The Exponential Moving Averages are pointing up on the Monthly Chart, Weekly Chart, Daily Chart, and 4H Chart.

First Higher Low on the Daily time frame ?!🤨The Bitcoin showing the first time possible Higher Low in the Daily time frame.
Also failed to break the 60K resistance 5 times !
Technically after a long Bullish trend it could be a sign of Bearish regulation .
Fundamentals :
Although of supporting and accepting by the big guys ! ( Elon Musk , JP Morgan Chase ) , but the price may need a short regulation before break up the 60K resistance.

Gold might soon shine againGold had a downturn at 19,19% and stayed in correction sentiment, but were close to bear sentiment (20%+ fall in price from the top) .
Around price 1676$ it saw massive technical support. The technical support where in these 3 types:
- Trendline from previous lows.
- Fibonacci 0,618 based on lows from March 2020.
- Bollingerbands 1000,3 based on 4-hour chart.
After touching these 3 types og technical support, it had a small bounce back to around price 1750$. After that i felt, but this time i made a higher low with around 5$, even considering that the dollar-index rose around 1% during that same period. This priceaction made the pattern of a double-bottom as well.
I think this is a long-term view bottom, based on the technical analasis, but also on the fact that the Dow:Gold ratio at the time is 19,16 (33153$/1730$) and everything over 15 is considered as a buy oppotunity in gold.
How much it think will rise, is hard to say, but my first target would the previous high (2074$) and the second target would be around the 1,618 fibonacci expansion (2320$).
My stoploss would at the price 1670$ as a speculator, but as a long term investor in physically gold, it would be at the price of 1000$.
Disclaimer: This should not be seen as investment advise, i don't take responsibility of any other persons actions, the thing i post i just my personal ideas and should not be seen as anything else, i am not a professional investor, and do not offer investment advises.

ZECUSD 2.81R50% Fibonacci Retracement of Pin Bar Candle. Entry at 167.26. Stop Loss at Pin Bar Tail. Target at previous Swing High. Reward to Risk is 2.81.


$BTC Bulls Hanging On... Cautiously Optimistic I actually don't hate this latest dip for a few reasons.
1. Bulls can create a higher low on the daily chart in attempts to regain control.
2. Allowed RSI to cool off on some of the lower time frames, and in a solid range on daily and weekly charts.
3. Bulls are still in full control of the weekly chart.
It doesn't feel like there is enough bullish volume to break ATH's, which is what the bulls will eventually have to do to create HH's and HL's. So I think we trade sideways as we did in the higher 50's for a bit to allow the bulls to consoldiate. We've seen some MAJOR moves to cold storage so far in 2021. Stay positive my friends.
J.Crypto

DigiByte on the move...With 5 consistent higher lowes, DigiByte has developed a new trend line. The new trend line far outpaces the old one and may set DGB into a parabolic motion. With capital flowing out of BTC and into altcoins, DGB may be a top choice. There is no known resistance in between where DGB currently is $0.066 and the last high which was $0.088, and beyond that, we had ATH somewhere just under $0.14. Massive improvements and social momentum have transformed DGB since then, so on a fundamental playing field there is no reason as to why the last ATH would have any effect whatsoever on the rising value of DGB. DGB is known as "The Sleeping Giant" in the crypto world, and often puzzles people as to why the value has yet to be discovered.
