Gold Bulls Charging to 3305 But What’s Waiting There?Gold has recently taken support from the lower levels and has also shown a Break of Structure (BoS) to the downside. Currently, there is Imbalance and Internal Draw on Liquidity (IDM) resting around the 3305 level. The market appears to be moving upward to mitigate that imbalance. It's important to closely monitor this zone, as once the market reaches and fills this area, there is a high probability of a potential rejection or bearish move from that level
Highprobability

July 29, Forex Outlook : High-Reward Setups You Shouldn’t Miss!Welcome back, traders!
In today’s video, we’ll be conducting a Forex Weekly Outlook, analyzing multiple currency pairs from a top-down perspective—starting from the higher timeframes and working our way down to the lower timeframes.
Pairs to focus on this Week:
USDJPY
AUDJPY
CADJPY
EURGBP
GBPCHF
USDCHF
NZDCHF
EURNZD
Our focus will be on identifying high-probability price action scenarios using clear market structure, institutional order flow, and key confirmation levels. This detailed breakdown is designed to give you a strategic edge and help you navigate this week’s trading opportunities with confidence.
📊 What to Expect in This Video:
1. Higher timeframe trend analysis
2. Key zones of interest and potential setups
3. High-precision confirmations on lower timeframes
4. Institutional insight into where price is likely to go next
Stay tuned, take notes, and be sure to like, comment, and subscribe so you don’t miss future trading insights!
Have a great week ahead, God bless you!
The Architect 🏛️📉

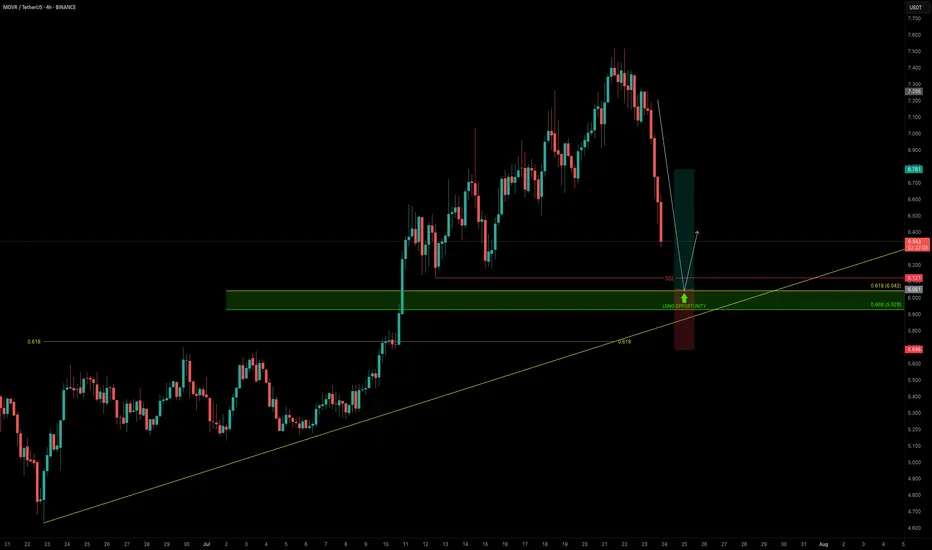
MOVR — Buying the Dip Into Confluence SupportAs the broader market pulls back, it’s the perfect time to scan for high-conviction long setups — and MOVR stands out.
Price is approaching a strong confluence support zone, offering a solid long opportunity.
🧩 Key Technicals
➡️ Liquidity Pool Below the Low:
There’s a visible liquidity pocket just beneath the swing low at $6.121 — an area where stop hunts and reversals are likely.
➡️ Fib & Speed Fan Confluence:
0.618 Fib retracement from the recent move aligns at $6.042
0.618 Speed Fan level also intersects the zone
Together, they form a technical floor right at the $6 psychological level
🟢 Long Trade Setup
Entry: $6.042
Stop-loss: $5.685 (below structure & liquidity sweep)
Target (TP): $6.78
R:R: ≈ 1:2+
Plan: Wait for price to fill into the zone and monitor for a bullish reaction (e.g., SFP, bullish structure reclaim)
💡 Why It Matters: Confluence Builds Confidence
When multiple tools — fib retracement, speed fan, liquidity pools, and psychological round numbers — all line up, it increases the probability of a strong reaction.
This is how smart money builds positions — not by chasing pumps, but by entering where others panic.
Final Thoughts
MOVR is approaching a clean, high-probability buy zone just below $6.00.
If the level holds and confirms with price action, this setup offers a solid R:R and a clear invalidation point.
📌 Mark the zone, set your alert, and let price come to you.
_________________________________
💬 If you found this helpful, drop a like and comment!
Want breakdowns of other charts? Leave your requests below.
Weekly Trade Outlook | Lessons in Discipline, Risk & PerspectiveGreetings Traders,
In today’s video, I’ll be walking you through my end-of-week trade outlook, breaking down every setup I took throughout the week. This session is designed to offer insight into how I apply risk management, trading rules, and maintain psychological discipline in real-time market conditions.
Whether you're struggling with emotional trading, inconsistency, or overtrading, this video will give you a fresh perspective on how structure, faith, and discipline can shape a sustainable trading approach.
Remember: respect your trading rules, pray over them daily, and ask God for the strength to remain disciplined—so you don’t become your own worst enemy in the market.
Let’s grow together,
The Architect 🏛️📈

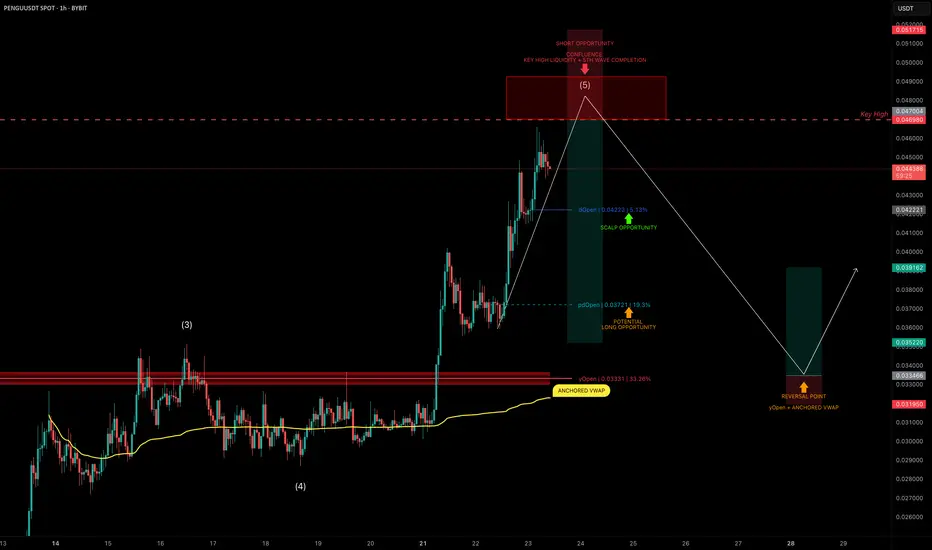
PENGU Topping Out? Targeting 30% Downside After Liquidity SweepPENGU has had an explosive run, but it now looks to be nearing completion of wave 5 of its current Elliott impulse.
We’re approaching a key high at $0.04698, a likely liquidity grab zone — and potentially a great area to position for a short trade.
🧩 Short Setup Overview
➡️ Wave 5 Completion Incoming:
Price is showing signs of exhaustion as it approaches $0.04698, where liquidity is likely stacked above the previous high.
➡️ SFP Trigger Zone:
Watch for a swing failure pattern (SFP) at $0.04698 — confirmation for a potential short entry.
➡️ Psychological Resistance:
The $0.05 level also sits just above — a classic psychological barrier that may get tapped or wicked into.
🔴 Short Trade Setup
Entry: After a confirmed SFP at $0.04698–$0.05
Target (TP): Yearly Open (yOpen) — potential move of ~30%
Stop-loss: Above post-SFP high
R:R: Excellent asymmetry if setup confirms
🛠 Indicator Note
In this analysis I'm using my own indicator called "DriftLine - Pivot Open Zones ", which I recently published.
✅ It helps highlight key open levels, support/resistance zones, and price structure shifts — all critical for confluence-based trade planning.
Feel free to check it out — you can use it for free by heading to my profile under the “Scripts” tab.
💡 Educational Insight: How to Trade Wave 5 Liquidity Sweeps
Wave 5 tops often trap late longs, especially when paired with psychological levels and key highs.
➡️ Patience is key — wait for a rejection pattern or SFP before entering.
➡️ Liquidity sweeps first — then the move.
Final Thoughts
PENGU is pushing toward $0.04698–$0.05, but this may be its final move up before correction.
With the yearly open as a logical target, and clear confluence via DriftLine, this setup offers a clean short opportunity — if confirmation comes.
Stay sharp, let price lead, and trade the reaction — not the prediction.
_________________________________
💬 If you found this helpful, drop a like and comment!
Want breakdowns of other charts? Leave your requests below.
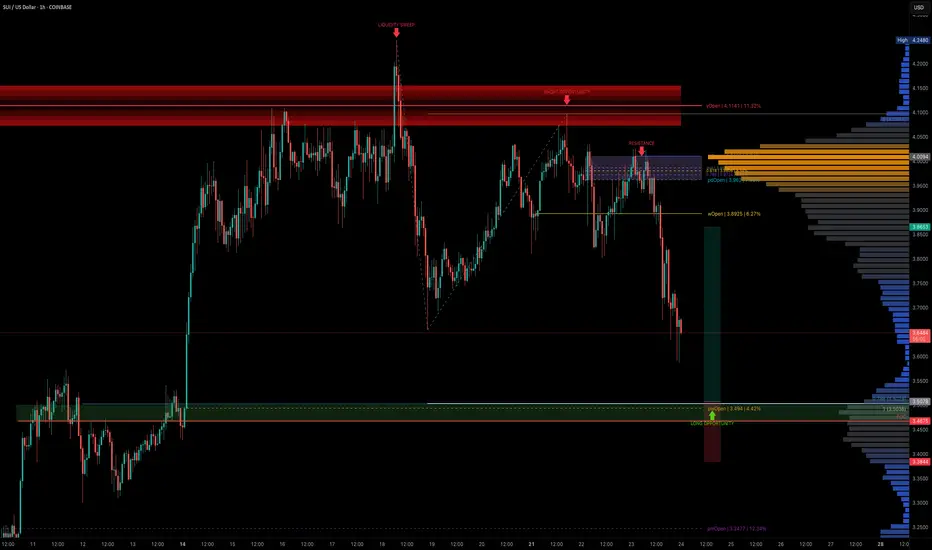
SUI — Structured Dip Buy Zone You Shouldn't IgnoreSUI has been technically clean, with well-respected Elliott Wave counts and fib levels.
As the broader market dips, it's time to look for sniper long entries and SUI is setting up beautifully for one around the $3.50 zone.
🧩 Key Confluence Zone: $3.50
This level offers a high-probability buy zone, backed by multiple layers of technical confluence:
0.786 Fib Retracement: $3.5029
1.0 Trend-Based Fib Extension: $3.5036
Previous Trading Range POC: $3.4675
Previous Weekly Open (pwOpen): $3.494
🟢 Long Trade Setup
Entry: ~$3.500
Stop-loss: $3.4675
Target (TP): $3.85+
R:R: ~1:3
🛠 Indicator Note
In this analysis I'm using my own indicator:
➡️ DriftLine — Pivot Open Zones
It helps identify key market opens (daily, weekly, prior), which often act as magnet levels and reaction zones.
➡️ You can use it for free — just check out my profile under “Scripts” and apply it to your charts.
💡 Pro Insight: Build Trades Where Tools Agree
A single level is just noise. But when fib retracements, extensions, POCs, opens, and price structure all line up — that’s where conviction trades are made.
The more overlap, the more likely the market reacts — this setup shows just that.
Final Thoughts
SUI is approaching a technically rich zone around $3.50, and this could be one of those low-risk, high-reward long entries if confirmed by price action.
With a clean invalidation and 1:3 R:R, this is the kind of setup you want to plan — not chase.
Set your alerts, stay patient, and trade with structure. 🚀✍️
_________________________________
💬 If you found this helpful, drop a like and comment!
Want breakdowns of other charts? Leave your requests below.
July 21, Forex Outlook : Don’t Miss These High-Reward Setups!Welcome back, traders!
In today’s video, we’ll be conducting a Forex Weekly Outlook, analyzing multiple currency pairs from a top-down perspective—starting from the higher timeframes and working our way down to the lower timeframes.
Pairs to focus on this Week:
EURUSD
USDJPY
AUDJPY
CADJPY
EURJPY
GBPCHF
USDCHF
NZDCHF
EURNZD
Our focus will be on identifying high-probability price action scenarios using clear market structure, institutional order flow, and key confirmation levels. This detailed breakdown is designed to give you a strategic edge and help you navigate this week’s trading opportunities with confidence.
📊 What to Expect in This Video:
1. Higher timeframe trend analysis
2. Key zones of interest and potential setups
3. High-precision confirmations on lower timeframes
4. Institutional insight into where price is likely to go next
Stay tuned, take notes, and be sure to like, comment, and subscribe so you don’t miss future trading insights!
Have a great week ahead, God bless you!
The Architect 🏛️📉

July 13, Forex Outlook : This Week’s Blueprint to Profit!Welcome back, traders!
In today’s video, we’ll be conducting a Forex Weekly Outlook, analyzing multiple currency pairs from a top-down perspective—starting from the higher timeframes and working our way down to the lower timeframes.
Currency Pairs:
EURUSD
USDCAD
AUDUSD
EURGBP
EURJPY
GBPCHF
USDCHF
NZDCHF
NZDUSD
EURNZD
Our focus will be on identifying high-probability price action scenarios using clear market structure, institutional order flow, and key confirmation levels. This detailed breakdown is designed to give you a strategic edge and help you navigate this week’s trading opportunities with confidence.
📊 What to Expect in This Video:
1. Higher timeframe trend analysis
2. Key zones of interest and potential setups
3. High-precision confirmations on lower timeframes
4. Institutional insight into where price is likely to go next
Stay tuned, take notes, and be sure to like, comment, and subscribe so you don’t miss future trading insights!
Have a great week ahead, God bless you!
The Architect 🏛️📉

Gold Traders Pay AttentionA Major Buying Opportunity is Emerging for GOLD ( XAUUSD )
In this analysis, we highlight an upcoming potential buy zone on GOLD ( XAUUSD ) that could present a significant trading setup. We’ll break down recent price action, key support zones, and technical signals that traders should keep on their radar.
Whether you're focused on intraday strategies or swing trading, these insights can help you position effectively for the next major move.
Don't miss out—watch the full breakdown for complete details.
Share your GOLD trade strategy in the comments below.

For Educational purpose only.The primary objective of the trading strategy is to generate consistent returns while managing risk effectively. Define whether you are trading for short-term profits, long-term growth, or a combination of both.

CADJPY Multi-Timeframe Price Analysis: Trade SetupIn this video, we analyse the CADJPY across multiple timeframes (4H, 1H, and 15M) to identify a high-probability long trade setup based on structural price action, momentum shifts, and Fibonacci retracement levels.
🔍 4H Analysis (Momentum High Formed)
The CADJPY has shown a strong bullish recovery on the 4-hour chart, forming a Momentum High — a key signal that often precedes price movement. According to the principle "Momentum Precedes Price," we anticipate a corrective pullback to form a Higher Low (HL). This HL is expected to become a decision point for buyers looking to join the uptrend.
⏱ 1H Analysis (Confirmation of Structure)
On the 1-hour timeframe, price has formed a Higher Market Low (ML), confirming the structural HL observed on the 4H chart. Price has now entered the Fibonacci Buy Zone, providing a high-probability entry area for bullish trades.
📉 15M Analysis (Failure Setup & Entry Trigger)
The 15-minute chart shows a Failure to Make a Lower Low (LL). While a higher low is a positive sign, confirmation comes only after a break above the last Lower High (LH) that failed to produce a new low. We’re watching for a break above 104.128 to confirm this failure setup and trigger our long entry.
🎯 Trade Setup
✅ Entry: Long above 104.128
🛑 Stop Loss: Below London session low at 103.74 ± 5 pips
🎯 Targets:
T1: 106.92
T2: 108.64
💬 Wishing you a successful trading week! Don’t forget to like, comment, and follow for more technical analysis and trade ideas.

EUR/USD Weekly Bias technical analysis appears well-reasoned. EUR/USD Weekly Bias Analysis
Technical analysis appears well-reasoned:
1. Short-term bearish bias: You anticipate a decline towards the previous week's low, indicating a potential short-term downtrend.
2. Bullish reversal zone: You've identified a critical area, marked by the weekly Fibonacci Volume Zone (FVG), where a potential bullish reversal could occur.
3. Upside target: Your analysis suggests a move towards the weekly high, offering a clear profit target.
# Key Confirmation Factors:
To validate your bias and adjust your strategy, consider the following:
- Candlestick patterns: Monitor for bullish reversal patterns, such as hammer or engulfing candles, to confirm a potential trend change.
- Momentum indicators: Keep an eye on the Relative Strength Index (RSI) and other momentum indicators to gauge the strength of the potential reversal.
- Volume analysis: Analyze trading volumes to ensure they support your bias, with increasing volumes on up days and decreasing volumes on down days.
By carefully monitoring these factors, you'll be well-positioned to adjust your strategy and capitalize on potential trading opportunities in the EUR/USD market.

AAPL, NVDA, MSFT & XPS: High-Probability Trade Setups This WeekWeekly Trade Radar & Market Outlook
This week, my focus is on AAPL, NVDA, MSFT, and XPS. There could be a potential retest of the 200 SMA with AAPL and MSFT, offering opportunities for well-structured trades. NVDA looks weak and has already tested the 200 SMA, making it a candidate for further downside potential or a short-term bounce. Additionally, Chinese developments in AI chip production remain a factor that could influence price action, particularly with NVDA. Staying aware of these key levels and macro developments is crucial for trade execution.
📚 Trading Plan: Ichimoku & 200 SMA Monthly Options Strategy**
📌 Strategy Objective
This strategy aims to capitalize on **high-probability trend-following setups** by using the **Ichimoku Cloud and 200 SMA** for confirmation while trading **monthly options contracts** to minimize time decay risks.
📀 Trading Rules
✅ 1. Entry Timing Rules (Your 3 Golden Rules)**
🚫 **No trading on Mondays** (Avoid weekend gaps & false breakouts).
🚫 **No trading on Fridays** (Avoid weekend time decay & volatility).
⏳ **No trades before the first 15-minute candle closes** (Avoid market noise).
📊 Setup & Trade Criteria
🔹 2. Trend Confirmation Using Ichimoku & 200 SMA
Bullish (Call Trade) Criteria:
✅ **Price is above the 200 SMA** (bullish bias).
✅ **Price is above the Ichimoku Cloud** (strong uptrend).
✅ **Tenkan-sen is above Kijun-sen** (momentum confirmation).
✅ **Chikou Span is above price from 26 candles ago** (historical trend alignment).
✅ **Future Cloud is green** (trend continuation signal).
Bearish (Put Trade) Criteria:
✅ **Price is below the 200 SMA** (bearish bias).
✅ **Price is below the Ichimoku Cloud** (strong downtrend).
✅ **Tenkan-sen is below Kijun-sen** (momentum confirmation).
✅ **Chikou Span is below price from 26 candles ago** (historical trend alignment).
✅ **Future Cloud is red** (trend continuation signal).
🔹 3. Entry Triggers (After First 15-Min Candle Closes)**
**Bullish (Call Trade) Entry:**
- Price pulls back to **Kijun-sen** and holds support, then starts to bounce.
- OR price **breaks above the Ichimoku Cloud** and holds.
- ✅ Enter **Call contract (monthly expiration)**.
**Bearish (Put Trade) Entry:**
- Price pulls back to **Kijun-sen**, rejects resistance, and starts falling.
- OR price **breaks below the Ichimoku Cloud** and holds.
- ✅ Enter **Put contract (monthly expiration)**.
🔹 4. Selecting the Right Option Contract
✅ Monthly expiration contract (third Friday of the month).
✅ 30-60 days to expiry (avoid rapid theta decay).
✅ Strike Price:
- **ATM (At-The-Money) or slightly ITM (In-The-Money)**.
- Delta between **0.55 – 0.70** for balance between premium & movement.
✅ Liquidity Criteria:
- **Open Interest > 1,000** for easy fills.
- **Tight bid-ask spread** (<$0.10 on liquid stocks).
🎯 Risk Management & Trade Management**
🔹 5. Stop Loss & Take Profit Rules**
Stop Loss (SL):
🔴 For Calls: Below the Kijun-sen or most recent swing low.
🔴 For Puts: Above the Kijun-sen or most recent swing high.
Take Profit (TP):
✅ First Target: At the opposite edge of the Ichimoku Cloud.
✅ Second Target: Key support/resistance level based on price action.
✅ If profit reaches 70-80% max potential, close early** to avoid theta decay.
---
🔹 6. Trade Adjustments**
🔄 Rolling:If trade is profitable near expiry but hasn’t hit full target, roll to next monthly contract.
🔄 Cutting Losses: Exit early if price **closes inside the Ichimoku Cloud** (loss of trend strength).
📊 Trade Example: Bullish Call Play**
- Stock:** AAPL
- Current Price:** $190
- Bias: Price is above 200 SMA and Ichimoku Cloud
- Entry Trigger:** Price pulls back to Kijun-sen and bounces
- Option Contract:
- Expiry: **Next monthly contract (e.g., July 19 expiration)**
- Strike: **$190 ATM Call**
- Delta: **0.60**
- Bid/Ask Spread: **$2.00 / $2.05**
- Entry Price: $2.05
- Stop Loss: Below Kijun-sen (~$187)
- Take Profit:
- First TP at $195 (Cloud resistance)
- Final TP at $200 key resistance
🔹 7. Why This Strategy Works?**
✅ **Avoids weak setups by following strict entry rules**.
✅ **Uses monthly contracts to avoid rapid time decay**.
✅ **Combines trend-following confirmation from Ichimoku & 200 SMA**.
✅ **Ensures liquidity & better risk management with ATM/ITM options**.
📀 Final Notes
🔹 Only trade **Tuesday to Thursday** to avoid low-probability days.
🔹 Wait for **first 15-minute candle to close** before entering.
🔹 Stick to **monthly contracts** for better theta control.
🔹 **Follow trend confirmation rules strictly**—no guessing.
Turning a Small Trading Account into a Side Hustle for Financial Freedom
Imagine having a skill that allows you to generate income from anywhere, with nothing more than your phone, iPad, or laptop. No need for an expensive setup, no need for hours glued to a screen, and no need to risk everything on a single trade. This is the power of trading options with a small account—starting with as little as $500 and scaling up over time to create financial security, eliminate debt, and build leverage for larger investments.
Weekly Trade Radar & Market Outlook
This week, my focus is on AAPL, NVDA, MSFT, and XPS. There could be a potential retest of the 200 SMA with AAPL and MSFT, offering opportunities for well-structured trades. NVDA looks weak and has already tested the 200 SMA, making it a candidate for further downside potential or a short-term bounce. Additionally, Chinese developments in AI chip production remain a factor that could influence price action, particularly with NVDA. Staying aware of these key levels and macro developments is crucial for trade execution.
Trading Method: Ichimoku Cloud & 200 SMA Strategy
For trade setups, I rely on a combination of the Ichimoku Cloud and the 200 SMA to confirm entries and exits. This system provides a structured approach to trading by identifying trend direction, support and resistance levels, and potential breakouts.
Identify the Trend – The 200 SMA serves as the key trend indicator. If price is above, we look for long opportunities; if below, short setups take priority.
Ichimoku Confirmation – Price action should align with the cloud structure:
Bullish trades: Price above the cloud with strong momentum.
Bearish trades: Price below the cloud with confirmation of weakness.
Entry Timing – Trades are entered after the first 15-minute candle closes to avoid early market volatility. No trades on Mondays or Fridays to maintain consistency and avoid false breakouts.
Monthly Options Contracts – Focusing on monthly expirations allows for strategic entries with enough time for price movements to develop.
Risk Management – Stop losses are set just below key Ichimoku or 200 SMA levels, ensuring a disciplined risk-reward ratio.
How This Can Work as a Side Hustle
Many people look for side hustles to supplement their income, but most involve long hours, additional expenses, or require significant effort to scale. Trading options, however, offers:
✅ Minimal time commitment – With the right plan, you spend less than an hour per day analyzing and placing trades.
✅ Low startup cost – Start with as little as $500 and build from there.
✅ No physical inventory or overhead – You don’t need to buy and store products.
✅ Scalability – As your account grows, you can increase contract size and compound gains.
✅ Financial freedom potential – The profits from consistent, disciplined trading can be used to pay off debt, invest, or build long-term wealth.
The Power of Leverage: Using Trading to Build Wealth
The ultimate goal of trading isn’t just to make a little extra cash—it’s to create financial leverage. Here’s how smart traders use small account growth to create lasting financial success:
1️⃣ Get Out of Debt – Use profits to pay off credit cards, student loans, or other financial burdens. Imagine the freedom of being debt-free.
2️⃣ Reinvest in Larger Opportunities – Once your small account grows, you can scale up your trades, fund larger investments, or even start a business.
3️⃣ Build a Safety Net – Having extra cash flow from trading can serve as an emergency fund, helping you navigate life’s unexpected challenges.
4️⃣ Create a Path to Full-Time Trading – For those who love the process, this side hustle can evolve into a primary source of income over time.
It’s About Discipline, Not Just Trading
The key to successful trading isn’t the market—it’s you.
Many traders fail because they lack the discipline to follow a system. This approach isn’t just about making money; it’s about becoming the kind of person who can execute a plan without emotion, without impulsiveness, and without shortcuts.
Success in trading mirrors success in life: patience, discipline, and consistency always win.
Getting Started – No Excuses
You don’t need a fancy setup. You don’t need to be a finance expert. You just need a phone, iPad, or laptop, a brokerage account (I use Robinhood for its simplicity), and a commitment to mastering a system that works.
If you’re looking for a low-stress, high-reward way to build financial security, trading options with a small account might be the perfect opportunity. It’s time to take control of your future—one trade at a time.

Price Reversal in Play: Key Levels and Targets to WatchAfter analyzing multiple timeframes, we can see that the price started trading within a large channel from Friday, 15th March 2024. The channel’s upper boundary acted as a strong resistance on Thursday, 31st October 2024, at 2790. Both the upper and lower boundaries of the channel have consistently functioned as key support and resistance levels.
The price reached an all-time high (ATH) of 2955, where it struggled to break through the channel’s upper boundary. Given the historical respect for these channel lines, we now anticipate a potential reversal. The price has already started to turn around, and to confirm this reversal, we need to see a break below both the trendline and the support level.
Once confirmed, your targets will be:
• 1st Target: 23.60% (2867)
• 2nd Target: 38.20% (2813)
• 3rd Target: 50.00% (2770)
• 4th Target: 61.80% (2726)
Make sure to follow proper risk management.
Happy Trading! Don’t forget to follow for more updates. 🚀

PLR (Path of Least Resistance) Strategy Explanation - $SHOPHi guys this is a follow up to a post I have just published about my trading idea on shorting NYSE:SHOP ,
It really doesn't matter if you want to short the market or long the market as it works either way, but for the sake of the example I'll take a 6 months period from the Shopify chart following earnings to better explain you my strategy...
This right here is the NYSE:SHOP chart from approx. Jan/2024 to end of Aug/2024,
2 Earnings have been announced, both having great positive surprises, but regardless of the positive surprise (typically bullish indicator), the stock fell of 45%+.
Let's add the earnings dates to the chart so that you can better visualize them:
What you care about in this image is the earnings dates lined out, as you can see the surprise was positive yet both fell more than 10% in just a day, that I will take as the upcoming trend for at least the time being, till the next earning is announced (so, if for example the 13/Feb earning ended up being bearish, my overview on the market till at least the next earning on 8/May, will be bearish, so all of the trades I will take will be shorts).
Now I will line out the trend and the BoSs (breaks of structure) just to better visualize the trend:
As you can see the Earning date candles signed the beginning of a down trend twice, pre-announced by the Earning candle itself.
The entry strategy is now simple, the idea behind it is to "follow the path of least resistance".. by that I mean that, if your bias is bullish, who enter on candles that are of the opposite direction to the one you are heading to? - Sure you might say that it is to get better entries as ofc, on a short bias, higher sale points = better profits, but the goal here is not maximizing profits, but raising the odds exponentially so that you can take surer trades.
I've tested this strategy from Feb/2021 and so far the win rate is 95.6% (123 out of 136 trades profited .
The way the entries are spread is this:
Basically every time a bearish candle - that closes lower than the previous bearish candle did - is created, a short position of 1% of total equity is generated.
The period begins from the beginning of the current earnings season, and closes the day before the next earnings season as it works within a 3 months frame.
Each entry HAS to be the lowest bearish candle of the period, example:
Only these candles marked in blue count as entries for short positions as their close is lower of more than 0.5% than the previous one,
The pink ones are higher than the lowest up to that point, so they do not count as entries as they are technically part of a pullback that is moving in the opposite direction where you are heading.
So, going back to the entries, we enter on the close of the lowest bearish candle close up to that point.
For safety, we trail the stop loss to the previous high, this is where well defined trend lines come handy:
The thick black line is the trend line, and as new lows are broken, I mark those as BoS (break of structure) and until a new one is created, the SL will go to the previous high, and so it goes.
(viceversa for buys).
We then proceed to target the FVGs left behind by previous quarters:
As you can see there are massive gaps in the chart that we will target and identify as FVGs (Fair Value Gaps) and set the TP at the close (lowest point) of the fair value gap.
Now comes in your exit strategy...
There really are 3 ways that you can tackle this:
1- You set up TP to the lowest FVG of the series (if there are multiple like in this case)
2- You set up TP to the first FVG still open during the quarter following the Earnings Period
3- You tackle both TPs and take each FVG as a partial close to the position (example: if there are 2 FVGs you take out 50% of the position on the first and 50% on the last).
But what to do if your positions didn't reach TP (FVG close) before the next Earning or there is no FVG to begin with???
- In the case the TP you have marked out at the close of the FVG didn't reach, you'll proceed to close the position 1 day before the next Earnings is coming, unless your conviction that the FVG will fill in is so high, then you can let those run at your own risk:
- In the case in which a FVG is not present then you'll target the previous High (in case of a buy) or Low (in case of a sell) as your TP, utilize the previous low (in case of buy) or previous high (in case of sell) as SL and just let it run:
as you can see the 4 trades were all profitable, made little money but sure money in just 15 days
Unless I forget anything, this right here, is my strategy.
Simple, straight forward, high success rate and doesn't leave anything up to the case.
If you have any questions PLEASE leave a comment below and I'll do my best to reply in time ;)

How I identify the best forex pairs to trade:Here is how I identify the best forex pairs to trade:
In the top left panel, the indicator 'Compare Forex' displays the PERFORMANCE of each major currency.
The USD (red line) has been the strongest currency for the past 2 months on H6 charts.
By identifying the strongest currency, all that remains is to trade the USD against all the other currencies since they are weaker.
= Smooth stress-free charts.
I look at my trades 2-3 times a day to see if they are still blue or red. Takes a few minutes.

Quarter Theory: Intraday Trading Mastery - Part 2 ExamplesGreetings Traders!
In today's video, we'll continue our deep dive into Quarter Theory Intraday Trading Mastery—a model rooted in the algorithmic nature of price delivery within the markets. We’ll explore the concept of draw on liquidity through premium and discount price delivery, equipping you to identify optimal trading sessions and execute high-probability trades, all while aligning with market bias.
This video is part of our ongoing High Probability Trading Zones playlist on YouTube. If you haven't watched the previous videos, I highly recommend doing so. They provide essential insights into identifying and acting on market bias, which Quarter Theory enhances further.
I highly recommend you watch ICT2022 Mentorship model on YouTube, it will really help you in your trading journey, the link to the mentorship is provided below.
I’ll attach the links to those videos in the description below.
Quarter Theory: Intraday Trading Mastery - Part 1 Intro:
Premium Discount Price Delivery in Institutional Trading:
ICT 2022 Mentorship: www.youtube.com
High Probability Trading Zones: www.youtube.com
Best Regards,
The_Architect

Quarter Theory: Intraday Trading Mastery - Part 1 IntroGreetings Traders!
In today’s video, we’ll be introducing Quarter Theory Intraday Trading Mastery, a model grounded in the algorithmic nature of price delivery within the markets. We’ll explore candle anatomy and learn how to predict candle behavior on lower timeframes to capitalize on intraday trading opportunities. This model will also help us identify the optimal trading sessions and execute trades with high probability, all while effectively acting on market bias.
This video will focus primarily on the foundational content, with practical examples to follow in the next video. In the meantime, I encourage you to practice these concepts on your own to deepen your understanding.
This video is part of our ongoing High Probability Trading Zones playlist on YouTube. If you haven’t watched the previous videos in the series, I highly recommend checking them out. They provide crucial insights into identifying market bias, which Quarter Theory will help you act on effectively.
I’ll attach the links to those videos in the description below.
Premium Discount Price Delivery in Institutional Trading:
Mastering Institutional Order-Flow Price Delivery:
Quarter Theory Mastering Algorithmic Price Movements:
Mastering High Probability Trading Across All Assets:
Best Regards,
The_Architect

Mastering High Probability Trading Across All AssetsGreetings Traders!
Welcome back to today’s video! In this session, we're revisiting the critical concept of draw on liquidity. I'll guide you on how to take advantage of it with extreme market precision, focusing on when to trade, when to avoid the market, and how to increase your chances of high-probability trade outcomes.
If you're looking to enhance your trading strategy and make smarter decisions, this video is for you. Let's dive in and start mastering these concepts!
Refer to these videos as well:
Premium Discount Price Delivery in Institutional Trading:
Mastering Institutional Order-Flow Price Delivery
Quarter Theory Mastering Algorithmic Price Movements:
Best Regards,
The_Architect

Quarter Theory: Mastering Algorithmic Price Movements!Greetings Traders, and welcome back!
In today's video, we’ll dive deep into Quarter Theory—a powerful concept that can take your trading to the next level. We’ll break it down step-by-step, explain how it works, and show you how to implement it into your strategy.
Quarter Theory is all about studying the algorithmic price delivery within the markets. It’s grounded in Time and Price Theory, which suggests that significant market moves often occur at specific price levels and times. This foundational idea will help us predict price movements more effectively.
If you haven’t already, be sure to check out the previous videos in the High Probability Trading Zones playlist for the key concepts you’ll need to fully grasp today’s content. For those watching on TradingView, links to previous videos will be included to help you catch up.
Mastering Institutional Order Flow & Price Delivery:
Premium & Discount Price Delivery in Institutional Trading:
We’re kicking off a weekly series on Quarter Theory, with the goal of helping you build a robust trading model by the end. Stay tuned!
Best Regards,
The_Architect

Gold repeats History!You better don't miss out on this one! She almost reached her zone around the 79%. Where it is a good point to buy as you can see in the history.

UPDATE ON GBPUSD SELL!!! PROJECTION 3price is forming a resistance at the top of that level which can hold price and likely lead to a pullback to the trendlines below

GBPUSD SELL !!! PROJECTION 3gbpusd is looking like making a pullback so i want to be shorting only when price close below that level of support
