Highprobability

GBPCAD Probability of bounceHello there.
Rejections are here. Bullish they are. Formed the Low of the Year (aka low of the month) we have. Now, after a nice daily candle close and a bullish indecision on Weekly, we might be prepared to exhaust a little bit of all this downward movement and finally head north.
For a Swing Trade, I'd look for a SL around the LY and a minimum take profit area around the 3.9:1 RR ratio.
Fundamentals are backing us up when we say that a brighter future may be there for England (and therefore GBP) considering the most likely next prime minister of the UK, not to mention what CAD is facing those days. Mind that we have the chinese GDP in a couple hours and retail sales data for the GBP.


#BTT : Upto 150% Profits Opportunity For The Mid Term. BTT looking very awesome for an entry at our last signal between 9 - 10 sats. It seems it is one of the low sat coins that have a big opportunity to pump harder and faster. Looking good even though we need some more energy and indicators confirmation for a reversal but buying partially with a strict stop loss and risk management method will pay a big return.
Accumulation Area : 9 sats - 10 sats
Distribution Area :
Target 1 : 12 sats
Target 2 : 14 sats
Target 3 : 15 sats
Target 4 : 17 sats
Target 5 : 19 sats
Target 6 : 21 sats
Stop Loss : A close below 8 sats
Risk : High
Capital Accumulation : 4%
@TogetherWeAccumulate


Dax daily: 03 Jul 2019 Yet another session without a gap. Sellers attempted to retest prices from the last week, yet to no avail. It was just around 12 475 when Dax turned around from its slight downward correction and eventually closed where it opened the daily session.
Important zones
Resistance: 12 600
Support: 12 391, 12 428
Statistics for today
Detailed statistics in the Statistical Application
The statistical probability of breaking yesterday's high is 83%
Macroeconomic releases
09:15 - 10:00 CEST - Eurozone PMIs
Today's session hypothesis
We'll base our today's analysis on the fact we have a higher statistical probability of breaking yesterday's high. Thanks to yesterday's close, the odds incline the price might go higher, beyond yesterday's high. Our statistical application indicates that such situation happened in 83% of historical occurrences. This is a strong indication that plays for bull traders. Should this scenario happen, we estimate that 12 600 could be targeted as well. If not, the price decline towards 12 475 or even lower towards 12 428 is likely in a reverse situation.

XEM / BTC#Accumulation_Recomendation
Pair : #XEM / #BTC
Platform : #Binance #HitBtc #Bittrex #Coinbase #Poloneix #Bitfinex
RSI : 35
Volume : Volume is coming back again in a fair amount.
**Note : MACD lookig bullish crossing over in favor of the bulls. RSI also raising up at a good point of entry. EMA needs some more momentum to be below the price for a reversal bullish uptrend.
Accumulation Area :830 sats - 850 sats
Distribution Targets
Short Term :
Target 1 : 890 sats
Target 2 : 914 sats
Target 3 : 940 sats
Mid Term
Target 4 : 980 sats
Target 5 : 1033 sats
Target 6 : 1086 sats
Target 7 : 1162 sats
Target 8 : 1258 sats+
Stop Loss : 808 sats for short term traders and 775 sats for mid to longer term traders.
Risk : High
Follow us @Togetherweaccumulate

Bitcoin : To The Long Awaited 10K level. Happening Now?!#Bitcoin_Update #4H
After all it seems we are in a bullish scenario and the bears are currently seems to be losing it at all. Currently trying to reach and pass that 9475$ area and it did tried to reach there with only a $10 less price levels. Every single setup looking to be perfect for a breakout and a bull run for the short term.
Indications:
MACD : looking very bullish crossing each other in favor of the bulls at all.
RSI : Very perfect place to be said in a bullish move right now at around 66 which is showing a good incoming volume to the market.
Candle Stick : Even though it is not in a down trend in the 4H chart we have seen a dragonfly bullish doji candle formed before 8 hours. And the current candle stick also looks very bullish and all the 3 candles formed consecutively are showing a surely bullish trend for a break out towards the next resistances of $9750 and $10000.
Pattern : The triangle formed by the past week is breaking out and showing Bitcoin has a very good potential for a breakout towards for the long waited 10K level.
EMA : Showing a bullish scenario happening right now being below the current candle which will be taken as an indication for a bullish upward trend for the short term.
Conclusion :
We expect Bitcoin will be on the way to the $9750 and 10K USD price levels by the following 3 to 4 candles if it can close the current candle above the $9475 area.
Please drop your likes if you agree or your comments if you disagree with this idea and lets learn from each other. Besides help us to grow our community by following our trading view profile too. Thank you.
Stay Tuned For further updates. And you can follow our social media platforms for Live updates too.
TogetherWeAccumulate
With Regards.

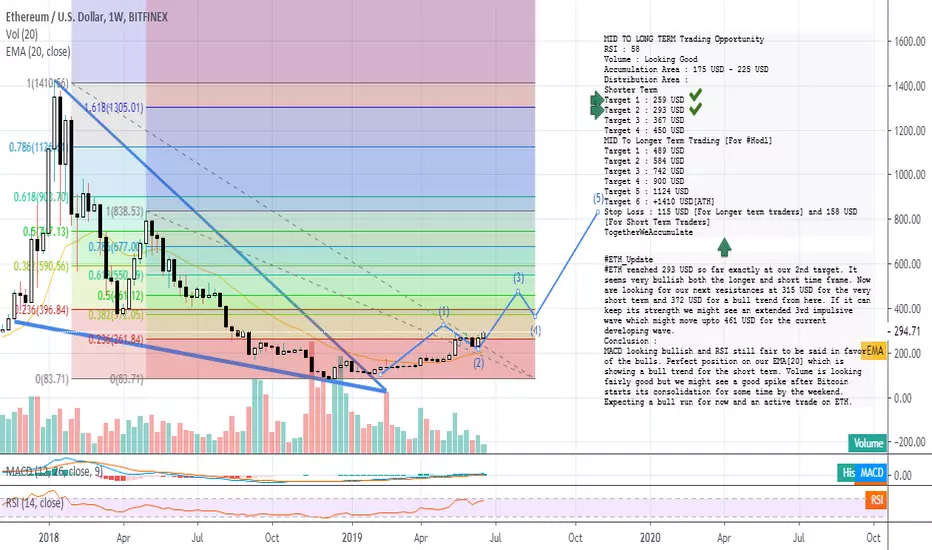
#ETH_Update : Getting Back The Legacy#ETH_Update
#ETH reached 293 USD so far exactly at our 2nd target. It seems very bullish both the longer and short time frame. Now are looking for our next resistances at 315 USD for the very short term and 372 USD for a bull trend from here. If it can keep its strength we might see an extended 3rd impulsive wave which might move upto 461 USD for the current developing wave.
Conclusion :
MACD looking bullish and RSI still fair to be said in favor of the bulls. Perfect position on our EMA which is showing a bull trend for the short term. Volume is looking fairly good but we might see a good spike after Bitcoin starts its consolidation for some time by the weekend.
Expecting a bull run for now and an active trade on ETH.
Targets are still active as predicted on our last post as follows :
Distribution Area :
Target 3 : 367 USD
Target 4 : 450 USD
MID To Longer Term Trading
Target 1 : 489 USD
Target 2 : 584 USD
Target 3 : 742 USD
Target 4 : 900 USD
Target 5 : 1124 USD
Target 6 : +1410 USD
Don't forget to drop your likes and comments if you like this idea. Further help us to increase our community number by following our profile.
With Regards. Team TWA.
BITCOIN : Short Term Possible Scenario's #Bitcoin_Update #4H
Bitcoin 4H time frame chart showing a test at on the key price level of a support at $9011 and this must be a taken as a key point for Bitcoin. If it closes below this key price level we will heading to test the next support area at $8724. In general there 2 main scenario's to occur at the current trend.
Scenario 1 : Break out for a correction and this correction might even go further for an ABC correctional wave formation.
Scenario 2 : Reverse back for another leg up to test our current resistance price level at $9475 which might see a rejection once again for a H&S creation and for a bull run like the past two H&S formations for a test of the next stronger resistance price levels at around $9800 and $10000.
RSI and MACD in favor of the bears for the short run for now. and EMA is also trending on the way to the bearish side.
Our conclusion is we still can't confirm the next move unless we see some more chart formation indications but the close of the current or maximum the next 4H candlestick formation will tell us where Bitcoin will move in the short run.
Stay Tuned For further updates. And you can follow our social media platforms for Live updates too.
TogetherWeAccumulate
With Regards.


#LTC : Bullish Starting To Raise Once Again To Its ATH.#LTC_Update
Litcoin breaks the current formed triangle and is trying to manage to test the next major long time frame resistance at around 151 USD. Seems bullish which is backed by the main indications of MACD, RSI and EMA for the short term. Candle stick formation is also looking very good for the moment.
Distribution Target will be 151 USD for the short term. For hodl investment it will be a very good profits run we are going to see in the time frame between 90 days and 120 days which might as well go upto 550 USD easily.
We will further update on this trade.

How to be a Successful Forex Trader Segment 3CBACK TESTING CONT.:
High probability set-ups
To be a consistently good trader, you must trade in a consistent manner.
As those of you who follow me and review my trade idea’s know, they are the same, almost boring. You see Type 1 (Shown above) or Type 2 trades all the time and they look all the same. EXACTLY!!! That is what you need.
If you have taken (either live or back tested), and documented, the same set-up numerous times, you can develop a statistical basis for the probability of that trade type’s success. IMHO, this is a critical element to achieving long term Success. I believe, if you know statistically, the probability of a trades success then you will be more confident in it and allow it to play out. Moreover, if you have a method that is not quite up to snuff, then get rid of it. I would urge you to be more selective in your trade process and only look for trades that you know, through your back-testing, have a high probability of success. This is Quality over quantity.
Stay green my Friends
Allen
** The Above chart is an example of how I document my trades-- every trade. I also use a spreadsheet to keep track of the data.

Bullish Moves Coming Much LikelyAlright, next week I'm focusing on GBP pairs as the beginning of the week starts with news coming from GB.
As Trump is supporting Brexit and the "great deals" to be made between the US and GB, I'd like to see this pair finally to make some moves to the upside as the other GBP pairs have already started to show some strength after falling for the whole May.
However, there is also SNB news coming from CHF on Thursday, so I'm expecting sharp moves from the GBP news to hit the 1.27 handle before Thursday, which is the first target.
Stop loss is good somewhere below the demand zone (rectangle), but it's good to have some room to breathe.

NZD/JPY BAT PATTERN SETUPNZD/JPY IS SETTING UP TO VALIDATE THE BAT PATTERN. IF ITS VALID WE SHOULD SEE PRICE DROP DOWN TO THE 71.727 LEVEL

#BTC UpdateBTC_UPDATE
Bitcoin is exactly heading towards the level we predicted on our last update on a correction. We will update a more detailed look out in short time.
For now MACD and RSI looking very bearish and we might as well go to test the 7000 USD if trend continue as it trending now.
Hope you are enjoying our TA forecasts and that hope you did take all the precautions in the mean time.
With Regards.
TeamTWA.

EVX : Upto 300% Profits Opportunity for the Mid Term#Accumulation_Recomendation
Pair : #EVX / #BTC
Platform : #Binance
RSI : 48
Volume : Good looking but needs some more momentum to see a good spike on daily chart.
Note : EMA struggling to become below the price and will be a good indication if it closes below the current candle stick which seems bullish in charter.
Accumulation Area : 9000 sats - 10000 sats
Distribution Targets
Short Term :
Target 1 : 11575 sats
Target 2 : 12600 sats
Target 3 : 14346 sats
Mid Term
Target 4 : 15600 sats
Target 5 : 17211 sats
Target 6 : 18245 sats
Target 7 : 21397 sats
Target 8 : 24410 sats
Target 9 : 28878 sats
Target 10 : 34752 sats
Stop Loss : 8000 sats
Risk : High
Capital Allocation : 4%

The Rise, Fall & Rise of Bitcoin : Part 2Base Story
In the golden days of Bitcoin so far, the king of all digital currencies could achieve to grow from $5400 on November 06,2017 to its all time high $19891 on December 17,2017. As we all remember the time was fully powered by by not only technical analytics but also FOMO based fundamental analysis results. From a technical analysis perspective it is obvious that Bitcoin not only will show a dramatic bull run but we think it will be the leading trading median for the near future in which the world will be based. This "Near Future" duration can't be predicted perfectly but it can be said it is in less than 5 to 10 years that Bitcoin will be a median for the world economy.
Current Situation
To make this post short lets just jump to see what the current situation of Bitcoin's market trend is and lets see what scenario's can be expected next. In the weekly chart on Bitfinex, we can see that Bitcoin already broke the created falling wedge on the beginning of February 2019. After that a little side ways consolidation move takes place and here we are at the verge of a bull run after all. But the main question is will this bull run is going to be achieved in less than 2 month period of time to its ATH like its golden times or are we going to see yet another corrective move. We believe there will be a correction of 3 wave pull back and there we go, we hope we gone have the long waited BTC strong bull run heading to the points where big names like McAfee predicited. . An Elliott wave creation is already on the way and breaks the first resistance line around $7038 by the last 2 days and it seems it is going to start its 2nd wave pulling back to the area between $5900 and $6500 depending the strength of the bulls and main stream media outlets. By this we are expecting Bitcoin to correct and once again to try the next resistance level at around $9480 in the mid term.
Indicators
RSI : Over bought at around 76 for now.
Both EMA(50) and EMA(89) are both below the price which can be considered a good indication to confirm that we are in a bull run.
Volume is amazingly increasing specially by this week and if it continues like this it might also be a good reason to repeat the last quarter of 2017's history.
Our Recommendation
-So our conclusion on the trading of Bitcoin is more of pro Bull run and we forecast a creation of an Elliott wave in the mid term. If you are in a position that you are not having Bitcoins try to convert your alts to Bitcoin when it started its correction.
-If you are holding Bitcoins for now keep your stop loss on the area of $6950 and re-enter the market on the reversal bull run after the 2nd wave creation.
And our conclusion at all is Bitcoin is on a trend that is going to show us some drama and its the time to trade it so smartly hoping all the best for the digital currency era.

LTC : Short Term Profits Upto 10%RSI : 48
- If price goes above the EMA and EMA it will be a good implication for a one leg up move towards point D.
- Volume need to increase a little bit.
Fallingwedge already broken and another elliott wave creation is expected for the short term.
Short Term Profit Target is around 81.90 USDT.
Remember to drop your LIKES and press the FOLLOW button if you are interested by our forecast and be free to DISLIKE the post or right your COMMENT if you not convinced by the forecast. Thank you for your time to read our posts anyways. With Regards.
Good Luck.
Legal disclaimer:
Information on this channel is our team's analyst's "opinion" based on data available at this point in time. These opinions are not recommendations to buy or sell securities/commodities and cryptocurrencies. Trading and investing is a risk and you should not rely on this data to make any financial decisions. You must consult a financial advisory licensed by regulatory agencies in your legal jurisdiction. All information stated here and in our reports don't guarantee any possible profits or losses. Please do consider to do your own due diligence and research when making any kind of a transaction with financial implications.
With Regards. TeamTWA.
You can give us your feed backs and suggestions on our effort in addition to this your questions here in trading view or in our telegram channel by the same name togetherweaccumulate.

XAUUSD long position IDEA from 1 to 2 divergence from 2 to 3 no divergence showing weakness in the trend + when markets are slow like this week because of asian session investors turn to gold as their safe heaven so we will see more volatility on gold this week

EUR/USD Constantly Countin There is major potential on euro downside thats why i have been selling and going break even when possible to do so is a great idea could see some sudden moves on 30 april with the high impact news events , dont follow this its my trade this isnt a signal just to showcase my views if you wish to trade it thats your own choice .

CADCHF High Probability Bearish Setup(Long-term setup)The current price level is a good entry point for such a setup. The trade is probably going to run for quite some time in order to hit our take-profit at 0.70988. Sorry for the big stop-loss. Adjust it according to the specifics of your trading plan.
