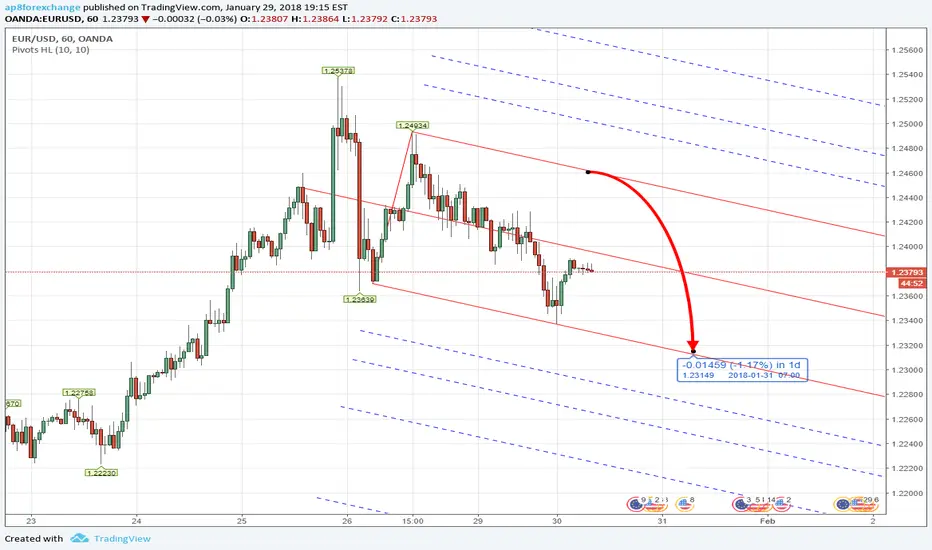
PITCHFORK - Forex EURUSD INTRADAY Analysis Jan 30th , 2018'Short' Position
Downtrend pitchfork channel forming, expecting bearish movement.
Short from upper line pitchfork to get higher reward
Kindly refer here for Weekly Analysis
Highprobability
PITCHFORK - Forex EURUSD INTRADAY Analysis Jan 29th , 2018Buy on Retracement
'Long' Position If price break lower line
'Short' Position and 'Trade Outside The Line'
Refer here for Weekly Analysis

PITCHFORK [CASE STUDY] - EURUSD WEEKLY ANALYSIS SWING TRADINGCASE STUDY - ANALYSIS
TIMEFRAME WEEKLY
LOWER LINE TO UPPER LINE
PRICE MOVEMENT
ESTIMATED 1 YEAR
Result
1. Price movement from lower line to median then retest on median.
2. Price rejected median and continue moving towards upper line.
3. Price made sharp reversal upon hitting upper line of pitchfork
ANDREW'S PITCHFORK
TECHNICAL ANALYSIS AND HIGH PROBABILITY TRADING STRATEGY

Bears on USDJPYTrend continuation on USDJPY as the fundamental factors of USA comes in to play as well. A possible wick fill on the weekly time frame.

PITCHFORK - CRYPTO BTCUSD Analysis Jan 17th - 22nd , 2017Wait for reversal on lower line pitchfork
'Long' Position

PITCHFORK - Forex USDJPY INTRADAY Analysis Jan 18th , 2018'Long' Position
Price has break median line, target price upper line pitchfork
and High Impact News this week will push US Dollar higher

PITCHFORK - Forex USDCAD INTRADAY Analysis Jan 16th , 2018'Long' Position
if price push below Median Line, Bear still in control

PITCHFORK - CRYPTO ETHUSD 2018 Q1 ForecastPrice forming uptrend channel on pitchfork
'Long' Position

PITCHFORK - CFD NIKKEI225 Analysis 2018 ExclusiveNIKKEI225
Analysis & Forecast #NI225 for 2018 based on Pitchfork Trading Strategy
Current price has break Median Line and moving towards Upper Line
High Probability price hit Upper Line Opportunity to Long NI225


#02 EURJPY Sell setup with 1:2 R/R Hey guys this is also a pending sell do your own analysis and do not put more then 1% of your account on this trade Best Of Luck :)
I'll follow up with this trade my target is to gain 10% of account per month just by risking 0.5% per trade by choosing high probable trades. just need your support to stay tune.

EURNZD Sell Setup with minimum 1:2 R/R hey guys do your own analysis and confirm it based on your strategy and do not risk more then 1% of your account
I'll follow up if i see any change in behavior (it's a pending order) Best Of Luck

PITCHFORK - Forex GBPJPY Analysis 2018 ExclusiveGBPJPY
Analysis & Forecast for 2018 based on Pitchfork Trading Strategy
Current price moving towards Median Line
High Probability price hit Median Line
Opportunity to Long GBPJPY

PITCHFORK - Forex EURUSD Analysis 2018 ExclusiveEURUSD
Analysis & Forecast for 2018 based on Pitchfork Trading Strategy
Current price at Median Line , if price continue to push above Median Line
Opportunity to Long EURUSD and High Probability price hit Upper Line
if price make a reversal on Median Line it could reverse back to Lower Line

PITCHFORK - Forex EURJPY Analysis 2018 ExclusiveEURJPY
Analysis & Forecast for 2018 based on Pitchfork Trading Strategy
Current price at Median Line, if price continue to push above Median Line
Opportunity to Long EURJPY and High Probability price hit Upper Line
if price make a reversal on Median Line it could reverse back to Lower Line


PITCHFORK - CFD DXY US INDEX 2018 Q1 ForecastPrice unable Break Median Line, High Probability Reverse to Lower Line


PITCHFORK - Forex USDJPY Analysis Dec 27th - 29th , 2017'Long' Position
*Possible Enter at Lower Line Pitchfork
