ESABINDIA triangle breakout 13% TARGET!NOT A TIP OR CALL ONLY FOR EDUCATIONAL PURPOSE
* Triangle breakout
* High volume
* Retesting
NSE:ESABINDIA
Highprobability

TALBROAUTO breaking its trendline keep an eye on !!!!!!!!!!!NOT A TIP OR CALL ONLY FOR EDUCATIONAL PURPOSE
* Triangle break
* High volume
* Retesting its previous levels
NSE:TALBROAUTO

ABCAPITAL breaking its trendline NOT A TIP OR CALL
. breaking its trend line
. sell on retest
. see the price action at the trendline
NSE:ABCAPITAL

AU 2018 February Backtesting 2nd RunThis is My Bullet reversal Backtesting for this month
Total Trades - 2
Wins -1(+6.56%)
Loses -1(-1%)
P/L - (+5.56%)

ANGELBRKG BREAKOUT BUY ON RETEST HIGH VOLUME !!!!!!!NOT A TIP OR CALL ONLY FOR EDUCATION
* Triangle pattern break
* High volume
* Retesting previous levels
NSE:ANGELBRKG

AXISBANK NICE BREAKOUT Axisbank breakout from triangle pattern and retesting the trendline good opportunity to go long and remember not a tip only for educational purpose keep it in your watchlist
NSE:AXISBANK

APOLLOTYRE BREAKOUT WITH HIGH VOLUME ONLY FOR EDUCATIONThis stock has given a good breakout with high volume keep an eye on it
NSE:APOLLOTYRE


BNBUSD UPTREND RALLY#BNBUSD UPTREND ANALYSIS
i think if the bulls continue with the buying power, it can grow to the next level and after that it can grow again after consistency of price above the retest level.
- My Pivot HL is telling me that there will be another pump very soon.
- BNB is by far one of the most bullish altcoin out there!
- For expected duration of the trade, probability, stop loss, profit target, entry price and risk to reward ratio ( RRR )
- 5x Parallel channel can act as a support / resistance in the future.
- If you want to see more of these ideas, hit "Like" & "Follow"

Bullish top down analysis price in consolidate i personally looking for fake trend Sunday Monday Tuesday and reverse on Wednesday and Thursday with signature trade confluence

Bullish top down analysis Smart Money now i am clearing my baise previous analysis 50% fail because of commercial increase their long COT graph clear say that and also Sessional Tendency Strongly indicate Bearishness in USD so waiting For BMS but not son necessarily BMS . Entry will be Quasimodo or BTMM Rule

Bearish top down analysis price react daily breaker so waiting for market shift for deciding my baise , for more conformation seeing daily chart for 3 bar pattern (Swing high ). entry will be different pattern and situation . may sure flip zone, id50 , 200 bouns,

Canoo Long Target1st Long term target: +100% from current prices
have included some resistance points where you can take profit if you want to as well
will post 2nd Long term target when the first is hit


Bullish Baise ict Bullish Basie Because price react weakly and daily level h4 clearly bullish so waiting for retracement ..

Bullish trade IdeaNow In dxy and GBPUSD make SMT dvergance .So my baise is Bulish i started looking day and osok Setup in Kill zone

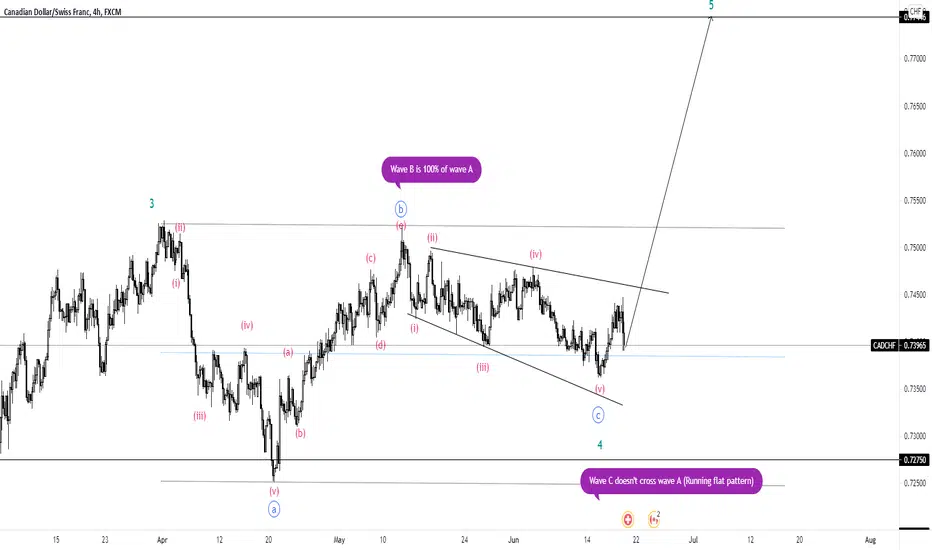
CADCHF SWING TRADE THEORY
This is an impulse move of the Daily timeframe, Wave 3 having been extended and completed.
Wave 4 zone A retracement at 0.38 of the impulse move
Wave 4 zone B retracement at 100% of wave A corrective lower timeframe
WAVE 4 zone C wave count (3 wave internal structure) 5 WAVE DONE
CONCLUSION
THE CURRENT PATTERN IS A RUNNING FLAT WHICH HAPPENS TO BE COMPLETE,
A STRONG WAVE FIVE TO THE UPSIDE SHOULD BE EXPECTED, CONSIDERING THAT THE PREVIOUS IMPULSE MOVE WAS AN EXTENDED WAVE 3. WAVE 5 TARGET ZONE SHOULD BE 100% EXTENTION
TIME TO LONG FOR BTCBtc currently trading at 39300
And There is RSHS Formation for now
We have minor resistance in 41500, may be re-test in this level
After I am waiting for 46000
Thanks for your attention. You can ask everything, I am waiting.
Please click like button and Appreciate my hard work.
Must follow me for latest crypto real time updates.


Bearish top down analysis Sessional tendency is bearish in Jun . Now price break previous low
Waiting for price go to supply. Kill zone is important

Triangle breakout in BritanniaNSE:BRITANNIA
The stock has fallen 10% from it's 52 week.
The trend line acts as a strong support and resistance respectively.
*Trade Confirmations*
:- The monthly central pivot range is narrow indicating a trending month.
:- Descending triangles have good success rates.
:- Consolidation near the trend line.
*Trade Setup*
:- T1 - 3550
:- T2 - 3800
:- SL - 3350
Thank you for viewing my ideas and analysis. Read it completely for complete understanding.
Follow me so that you'll get notified whenever I post some content.
Let me know through the comment section if you have any doubts or feedbacks.
All the best! Happy trading/investing :)

Confluence of Support on EthereumWith the price of ETH currently at the support of both the 100 day SMA and the trendline of an ascending triangle (which is a reversal sign in itself), this price area presents a high probability of sparking a rally in ETH.

Aurora'ing back to life..will ACB burn one to get a yearly HIGH?EMA cross (50/200) on the 2hr chart, maybe back testing the 200 EMA now. Bresserts crossover on the weekly chart in oversold territory (last time this happened, it pumped $10 in the following 2 weeks - past performance not necessarily indicative of future results).
CMF shows money flow is in positive territory, relative strength hovering just under 50 RSI. I'd like to see the price touch the $8.80-9.00 ideally, but the downside can be complete here. Semi-worst case it should hold $8.00 but still would not invalidate until major support is breached. Good R:R IMO... this one can be a volatile beast. It is possible we see a pump to the $10.90 region and a retrace to these levels again ($8.50-$9.50) before moving higher. Placing major support at $7.20, soon to move up to $7.60. Keep in mind this is the one traded on the NASDAQ in USD, so you'd have to convert support regions accordingly if trading on the TSX exchange chart. Inverted H&S formation points to $21-$23 region... but should go 'HIGH'er long term.
