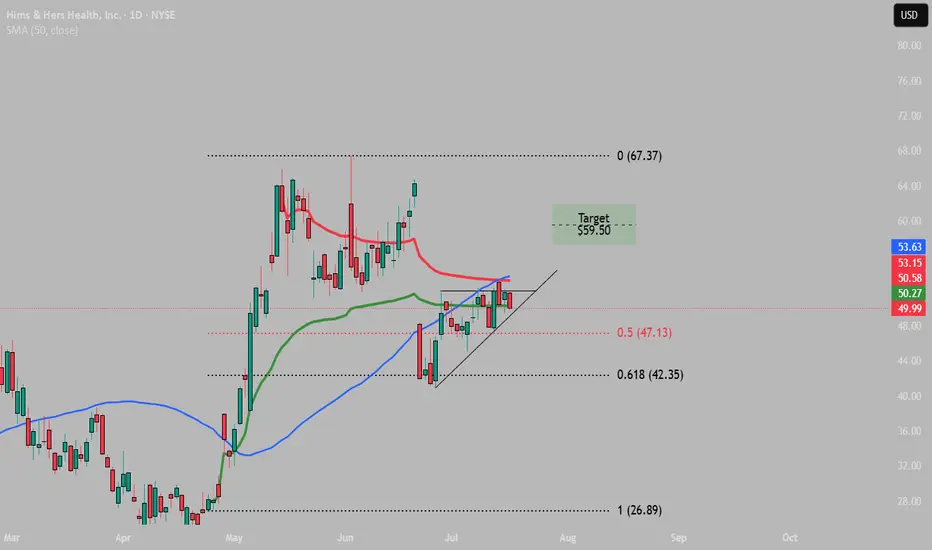
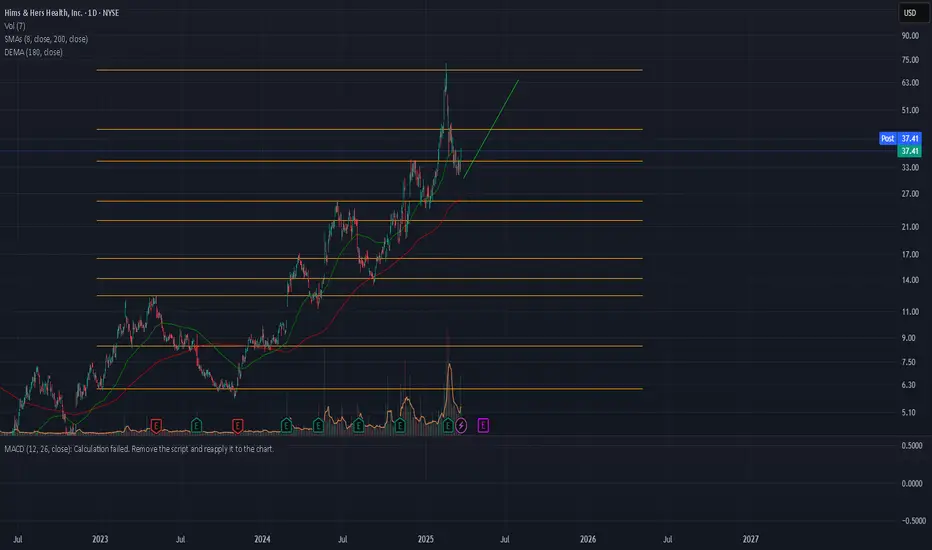
$HIMS Squeeze Time Frame: 1D
RSI : Neutral
MACD: Bullish Cross
Fib Levels: Retraced back to 61.8%
Target:
$59.50
Pattern invalidated of drop below 61.8% ($42.35) Fib level.
HIMS
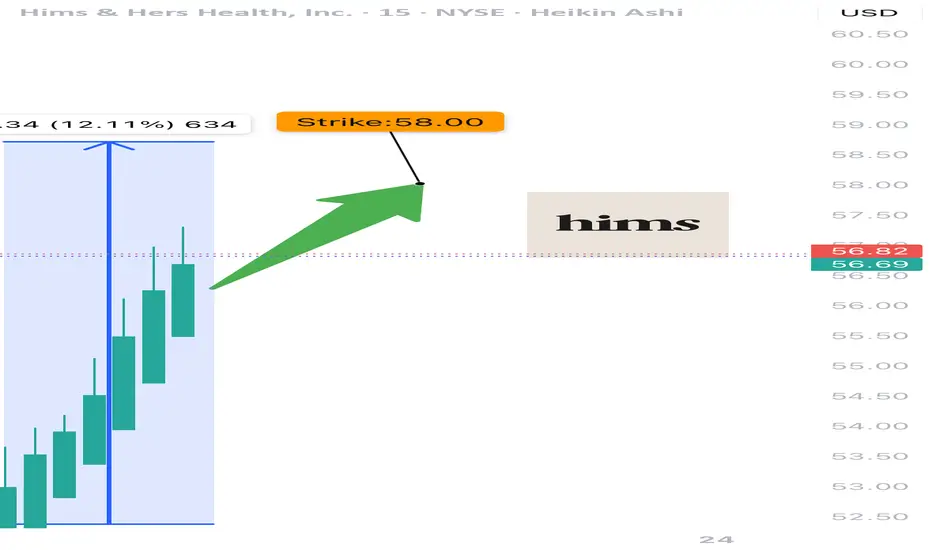
HIMS WEEKLY BULLISH PLAY — 07/23/2025
🩺 HIMS WEEKLY BULLISH PLAY — 07/23/2025
📈 Momentum Up, Flow Bullish, Time Tight — Let’s Ride It
⸻
🔍 MARKET SNAPSHOT
5-model AI consensus = ✅ BULLISH
Why?
• 📈 Weekly RSI = 58.2 (Rising) — Clear momentum
• ⚖️ Call/Put Ratio = 1.63 — Big call volume (45K+)
• 📉 Volume = 0.9x — ⚠️ Slight institutional hesitation
• 🌪️ VIX = 16.0 — Low volatility = smoother execution
⸻
🎯 TRADE IDEA — CALL OPTION PLAY
{
"instrument": "HIMS",
"direction": "CALL",
"strike": 58.00,
"entry_price": 0.86,
"profit_target": 1.72,
"stop_loss": 0.43,
"expiry": "2025-07-25",
"confidence": 75%,
"entry_timing": "Open",
"size": 1 contract
}
⸻
📊 TRADE PLAN
🔹 🔸
🎯 Strike 58 CALL
💵 Entry 0.86
🎯 Profit Target 1.72 (+100%)
🛑 Stop Loss 0.43 (tight risk)
📅 Expiry July 25 (2DTE)
⚡ Confidence 75%
📈 Size Suggestion Risk 2–3% of capital
⚠️ Key Risks Low volume + high gamma exposure
⸻
🧠 MODEL TAKEAWAYS
✅ RSI and momentum are clearly aligned upward
✅ Call flow = bullish commitment
⚠️ Volume is light → watch for momentum stalls
⚠️ Gamma risk = manage tight, exit fast
⸻
💬 Drop a 🧠 if you’re tracking
📈 Drop a 💥 if you’re in this call
🛎️ Trade tight — expiration Friday, HIMS is moving on momentum not mass
#HIMS #OptionsTrading #CallOptions #BullishPlay #MomentumTrade #ZeroDTE #GammaScalp #AITrading #HealthcareStocks
$HIMS - ORBCLEAN breakout for NYSE:HIMS today.
DP_ORB Indicator marked it at candle close outside of ORB Zone, with confirmation bias from a higher high, and volume. All take profits were hit!
If you want the DP_ORB Indicator for FREE:

My buy view for Hims & Hers stock. My buy view for Hims & Hers stock.
Overall, I believe this asset is still in a bullish direction. I remember hoping into accummulating this stock when it dropped from $64 to $41 at the open of market on 23/6/2025 which I sold off when it hit $50.
However, I still hold a strong buy bias with my entry and exit showing on my chart (analysis).
Please trade with care as I still look forward to $64 per share for this stock long-term.
Please, kindly like, share your thoughts via comment and follow me for more.

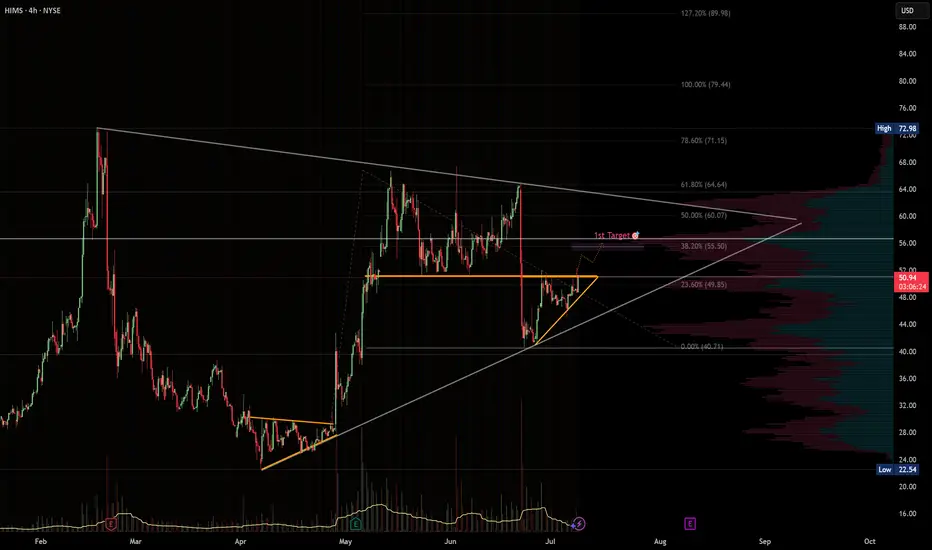
HIMS · 4H — Symmetrical Triangle Breakout Targeting $55 → $60Setup Breakdown
HIMS is forming a symmetrical triangle consolidation, with price tightening between rising support and descending resistance.
The structure follows a previous impulsive move, suggesting this is likely a bullish continuation pattern.
Volume is contracting — typical for pre-breakout setups — and price is holding above a key short-term rising trendline.
A breakout above $52–53 could initiate a fast move into the next resistance band.
---
🎯 Target Zone
🎯 Target Level Reason
Target-1 $55.50 (38.2% Fib) Volume gap fill + first resistance from prior consolidation range. A clean spot for partial profits.
Target-2 $60.00 (50% Fib) Strong historical resistance + Fibonacci confluence. Ideal level to take the rest of the position or trail a runner.
---
🛠️ Trade Plan (Example)
Component Action
Trigger Long on a confirmed breakout above $52 with volume ≥ 20-SMA
Entry Add-on Pullback retest of broken triangle resistance ($52) acting as new support
Stop-loss Close < $49.50 — invalidates the triangle
TP-1 $55.50 — take 50–70% off, move stop to breakeven
TP-2 $60.00 — exit or leave a small runner in case of further breakout
---
⚠️ Risk Notes
Earnings date approaching – trade may need to be closed or hedged before volatility spikes.
Break below $49.50 invalidates the pattern and opens risk to $46 or lower.
Watch for volume confirmation — fakeouts can occur if breakout lacks momentum.
---
✅ Checklist
Triangle structure with strong trendline support
Low-volume zone between $53–60 favors fast expansion
Targets align with Fib + volume profile
Risk clearly defined
Earnings awareness in place
> Disclaimer: This is not financial advice. Trade your own plan and manage risk appropriately.
HIMS 1D — This pattern didn’t cook for nothingOn the daily chart of Hims & Hers Health, we’re looking at a textbook cup with handle formation — not just a pattern, but a structure backed by time, volume, and classic price behavior. The base of the cup formed steadily from February to May 2025, and as soon as the curve was complete, price transitioned into a tight consolidation — the "handle" that often masks real accumulation.
Right now, price is testing the resistance area. And it’s not just floating up there — it’s coming in hot: price has already broken through EMA 20/50/100/200 and SMA 50/200. That’s a full stack flip. This isn’t sideways noise — it’s a structural shift in control.
Volume is starting to build as price rises, confirming that demand is real and institutional positioning likely active. We’re watching a breakout zone above the handle — and when that breaks, the structure unlocks with a clear target: $107.25, roughly a 2x move from current levels.
This setup isn’t noise. It’s a long-cooked formation that’s now about to boil over. If the handle holds and price breaks through — the rest is just follow-through.

HIMS puked up its Wegovy today!Hims & Hers Health
HIMS
shares were down more than 34.63% in Monday trading, while Novo Nordisk
NVO stock was down over 5% after Novo Nordisk said it has halted its collaboration with Hims & Hers on the sale of weight loss drugs, including Wegovy.
The two companies launched a collaboration in April to bundle Wegovy through Hims & Hers' telehealth platform.
Novo Nordisk said direct access to the drug would no longer be available through Hims & Hers Health because the company "has failed to adhere to the law which prohibits mass sales of compounded drugs under the false guise of 'personalization' and are disseminating deceptive marketing that put patient safety at risk."
This stock failed to catch a bid despite the equity markets strong.

HIMS - Wait for it, don't rush itI would wait for the correction to complete around the 45 zone, then start adding when the parallel channel breaks. It has already faked out once. Do not fall for this.

$HIMS setting up for its next big move—here’s what I’m watching!🔥 NYSE:HIMS setting up for its next big move—here’s what I’m watching! 🔥
📉 Eyeing momentum down to $44-$48, and I’m not mad about it!
🔄 That flip from resistance to support is key for long-term price growth.
🚀 Bull flag breakout could come sooner—stay locked in! Keeping an eye on it all for the next trade entry on this beast!
💬 What’s your take? Are we bouncing or breaking out? Drop your thoughts below! ⬇️

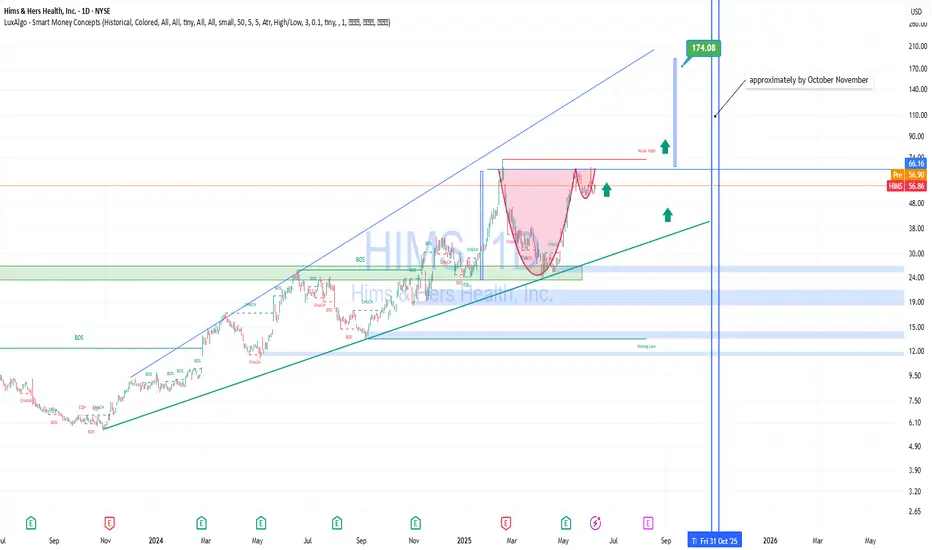
HIMS – Technically and Fundamentally Strong for Mid-to-Long TermTechnical Analysis
HIMS is trading in a clear ascending channel since 2023.
On the daily chart, a “cup and handle” formation has completed, with a confirmed breakout above the neckline ($55–$57 area).
The price is consolidating near the breakout point – classic behavior before a continuation move.
Target projection from the cup pattern is $170+, implying a 200%+ upside potential.
The stock also respects the upper trendline of the long-term channel, reinforcing bullish structure.
Fundamental Strength:
Telemedicine megatrend: Digital health is booming. HIMS is one of the few well-established D2C players in the U.S. market.
Revenue growth: Annual revenue growth exceeds 40% YoY, a sign of operational efficiency and demand.
Sticky subscription model: Over 1.5 million active subscribers — solid base for recurring revenue and LTV.
Valuation upside: Still undervalued relative to sector peers despite recent rally.
Scalable tech stack: Strong backend, customer acquisition systems, and vertically integrated infrastructure support further expansion.
Conclusion: HIMS offers an attractive risk–reward setup for swing traders and long-term investors alike
HIMS Weekly Options Outlook — June 3, 2025📉 HIMS Weekly Options Outlook — June 3, 2025
🚨 AI Model Consensus: Moderately Bearish into June 6 Expiry
🧠 Model Overview
🔹 Grok (xAI)
Bias: Neutral
Setup: Bearish short-term, bullish long-term; mixed outlook
Trade: No action — lacks edge
Confidence: 35%
🔹 Claude (Anthropic)
Bias: Moderately Bearish
Setup: Below EMAs, bearish MACD; cautious sentiment
Trade: Buy $52P @ $0.94 → PT $1.88+, SL $0.56
Confidence: 72%
🔹 Llama (Meta)
Bias: Moderately Bearish
Setup: Post-run fractal pullback, mixed but leaning down
Trade: Buy $52P → PT +20%, SL −50%
Confidence: 70%
🔹 Gemini (Google)
Bias: Moderately Bearish
Setup: Clean break under EMAs, MACD/RSI confirm weakness
Trade: Buy $50P @ ~$0.47 → PT 100%, SL 50%
Confidence: 65%
🔹 DeepSeek
Bias: Moderately Bearish
Setup: Breakdown across timeframes; skewed put flow
Trade: Buy $50P @ $0.45 → PT $0.70, SL $0.32
Confidence: 65%
✅ Consensus Summary
📉 4 of 5 models recommend bearish weekly puts
🔻 Clear breakdown under EMAs with supportive MACD/RSI signals
🧲 Max Pain at $55 could cause late-week pullback or stall
🎯 Preferred strategy: OTM naked puts with high ROI potential
🎯 Recommended Trade Setup
💡 Strategy: Weekly Bearish Put Play
🔘 Ticker: HIMS
📉 Direction: PUT
🎯 Strike: $52
💵 Entry: $0.94 (ask)
🎯 Profit Target: $1.70 (+80%)
🛑 Stop Loss: $0.56 (−40%)
📏 Size: 1 contract
📅 Expiry: 2025-06-06
⏰ Entry Timing: Market Open
📈 Confidence: 70%
⚠️ Risk Factors to Watch
🧲 Max pain at $55 could slow breakdown or cause snapback
🔻 $52 support zone may cause consolidation or chop
📉 Falling VIX = compressed premiums, slower option movement
⌛ Theta accelerates into Thursday/Friday — exit early if flat

HIMS 20SMA Trend Contiuation PULLBACK SETUP NYSE:HIMS – Momentum Reload at 20 SMA After Massive Run
NYSE:HIMS has been one of the hottest stocks in the market, and it’s giving us a textbook trend continuation pullback setup — right into the sweet spot.
🔹 Pullback to the 20 SMA
• After a huge run, NYSE:HIMS finally gave us a controlled pullback to the 20 SMA, where it based for multiple days.
• Today, it remounted the 9 EMA — a key trigger in my swing strategy for momentum re-entry.
🔹 Why This Setup Works
• Momentum names don’t stay down long — this was just a reset.
• Even with the market shaky today, NYSE:HIMS closed strong — up 8% while the rest of the tape faded.
• This setup is all about getting back into strength with low risk.
My Trade Plan:
1️⃣ Entry: Took a position on today’s remount of the 9 EMA.
2️⃣ Stop: Just under the 20 SMA — tight, well-defined risk.
3️⃣ Target: First target is a move back into the previous highs — if it breaks, we trail for continuation.
🧠 This is my bread-and-butter swing entry — clean, controlled, and full of momentum potential.

Update on Nuclear Stocks SMR, OKL0 + NEW IDEAS VRT, TSLA OKLO, SMR going through the roof. NNE is trailing today. Sold out most of the RKLB.
Lets go over the SPY, QQQ which are flagging now after holding support.
Liking this VRT and LTBR AND LUNR for potential swings along with HIMS!
Lets dig into the charts and see whats up!

$SPY Daily Chart Taz Plan - May 2025 into June-July Breakdown📉 SPY Daily Chart Trading Plan — May 2025
Thesis:
Price has returned to the exact level ($594.20) where the February impulse breakdown began. This zone is acting as a Lower High rejection within a broader bearish structure. A clean rejection here opens the door to multiple inefficiency fills below.
🔍 Structure Breakdown:
Feb High (ATH): $613.23
Feb Open: $592.67
Feb Close (last green candle before impulse): $594.20
Current Price: $594.20
Marked LH: $592.50
This is a rally back into rejection, not strength.
📉 Key Zones & Gaps:
🔺 Gap Supply: $566.48 – $578.50
🔺 Wick Gap: $558 – $566 → Needs a full-body candle to initiate fill
🟥 FVG (4/22): $528 – $541.52
🧱 Major Support: $481.80
🧠 Trade Plan:
Short Entry 1 (Confirmation-Based):
🔻 Red candle rejection under $592.50 = starter short
🔻 Watch RSI and MACD for momentum fade
Short Entry 2 (Gap Breach):
🔻 If $578 is broken and retested → scale in
🔻 Gap fill expected quickly once triggered
Short Entry 3 (Wick Gap):
🔻 Body close through $558 = last add
🔻 Sets up for final flush to FVG
🎯 Targets:
$578.50 → $566.48 (Gap Fill)
$558 → $541.52 (Wick Gap & FVG Top)
$528 – $530 (FVG Close)
$481.80 (Long-Term Panic Target)
❌ Invalidation:
Daily close > $595.50 = Pause thesis
Weekly close > $600 = Structural shift, short squeeze zone
🧠 Final Thoughts:
This isn’t just a gap fill play — it’s a structural fade from a lower high back into memory. The Feb impulse wave left behind layers of inefficiency, and price just tapped the origin of the breakdown.
Momentum is peaking. If this is a trap, the downside should begin immediately.
Let the chart prove it.

Hims is OVERBOUGHT Market Context ✨
NYSE:HIMS | Current Price: $42.00
1-Month Move: +17.5% (from $35.75)
1-Year Move: +68.2% (from $25.00)
Year High/Low: $43.50/$24.80
Technicals
RSI: ~75.8 (overbought )
Moving Averages: Above 20-day, 50-day, and 200-day MAs (strong uptrend, but overextended )
MACD: Bearish divergence forming (momentum fading, potential reversal )
Trade Setup
Direction: PUT
Entry Price: $42.00
Take Profit 1 (TP1): $36.00 (~14.3% gain )
Take Profit 2 (TP2): $30.00 (~28.6% gain )
Expected Move: ~12–15% downward
Best AI Signals on the market

HIMS – Pullback Opportunity After Massive RunHIMS has been one of the hottest stocks in the market recently, with a massive run fueled by strong earnings. But now we’re seeing the first meaningful pullback — and this could be a golden opportunity:
🔹 Earnings Gap Reversal (Bullish Signal)
Despite an earnings gap down, buyers stepped in aggressively, pushing the stock higher.
This is a classic earnings gap down reversal — a strong sign of demand.
🔹 First Pullback Opportunity
Historically, the first pullback after a major run tends to get bought.
I’m watching two key levels for a potential buy:
The shaded zone between the 9 EMA and 20 EMA (dynamic support).
The 0.38 - 0.50 Fibonacci retracement for added confirmation.
🔹 My Trading Plan:
1️⃣ Initial Entry: Starter position in the shaded EMA zone (9 EMA - 20 EMA).
2️⃣ Confirmation Add: If price bounces off the Fib zone (0.38 - 0.50) with strength.
3️⃣ Stop Loss: Below the 20 EMA for any initial position — keeping risk tight.
🔹 Why This Setup is Compelling:
Strong run + earnings reversal shows real buyer interest.
First pullback after a big run is typically a strong buying opportunity.
The dual confluence of EMAs + Fibonacci enhances this setup.
⚠️ Risk Management: Tight stop below 20 EMA — always control risk.

$HIMS is in a livermore pattern This Livermore pattern is playing out great. 1.618 will be big resistance tho

$HIMS is HIMS! 80% Upside AheadNYSE:HIMS is HIMS! 80% Upside Ahead
Demolished earnings and I have this name at a fair value of $76 per share based on HIMS 2030 $6.5B Rev. Guidance.
Also, H5_L Indicator is about to cross bullish while the Wr% is rising and swinging from green to red!
Profit Targets:
- $50
- $60
- ATHs!
Before EOY!
Not financial Advice

Quantum's HIMS Trading Guide 4/10/25 HIMS (Hims & Hers Health, Inc.) - Sector: Healthcare (Telehealth)
Sentiment: Bullish. Post-close call volume steady, RSI ~58 (up from ~55), Amplified GLP-1 demand—speculation persists despite tariff noise.
Tariff Impact: Minimal. Domestic focus shields HIMS; 104% China tariffs irrelevant unless generics supply tightens.
News/Catalysts:
Current: tariff pause softens market fear.
Upcoming: Retail Sales (April 15)—strong data could lift +5%; Fed rate outlook (May 2025)—cut signals might push +7%.
Technical Setup:
--Weekly Chart:
---HVN $30 (resistance), support ~$25.45.
---Uptrend (8-week EMA > 13-week > 48-week).
---RSI ~58, MACD above signal,
---Bollinger Bands upper band,
---Donchian Channels above midline,
---Williams %R -25.
--One-Hour Chart:
---Support $28.50, resistance $29.50.
---RSI ~60,
---MACD above signal,
---Bollinger Bands upper band,
---Donchian Channels above midline,
---Williams %R -20.
--10-Minute Chart:
---8/13/48 EMAs up,
---RSI ~62,
---MACD rising.
Options Data:
--GEX: Bullish—pinning near $29.
--DEX: Bullish—call delta dominates.
--IV: High—~50–55% vs. norm 45–50%.
--OI: Call-heavy—above $29.
Timeframe Analysis:
---Weekly: OI call-heavy (70% calls at $30), IV high (55%)—bullish, speculative push.
---Monthly: OI call-leaning (65% calls at $30–$32), IV moderate (50%)—bullish trend.
---3-Month: OI call-heavy (75% calls at $32), IV moderate (45%)—bullish long-term.
Directional Bias:
---Bullish. GEX/DEX and call OI signal strong upside; high IV fuels volatility—intraday breakout potential.
Sympathy Plays:
---TDOC rises with HIMS; AMWL gains with HIMS.
---Opposite: HIMS rallies → WMT fades.
Sector Positioning with RRG: Leading Quadrant (Healthcare vs. XLV)—growth persists.
Targets: Bullish +6% ($30.77); Bearish -3% ($28.16).

$HIMS Hair, Health, Hello!I guess I might be jumping on the Bandwagon. Everything is growing with this one! Year over yr it's exploding, will this have a Zoom like fall? or a Monster rally? Time will tell and the dip makes this look like a great to start loading up.
Where is $HIMS going next? Massive upsideWhere is NYSE:HIMS going next? Massive upside
Watch now to find out!
Not financial advice

Oscars about to BREAKOUT - 64% UpsideNYSE:OSCR - BREAKOUT IMMINENT!
Williams % Range is Breaking Out
Foreshadowing a Falling Wedge Breakout?!
- I think so!
Breakout = $28 🎯
- Volume Shelf Launchpad
- Above H5 Indicator (GREEN)
Not financial advice

HIMS - The Full MonthyNo, no weed involved in this analysis.
As I said before, sometimes chart analysis is simple. But sometimes we need to extend it, combining all our knowledge to find the facts.
Let's see what we have here:
1. The white Fork.
...it's crazy, isn't it? ;-)
It looks like I was looking to fit it somehow.
But the truth can't be farther away. If you understand the principles behind this tool, WHAT it really measures, and what INFORMATION it really provides, then you get it, why this Fork is drawn like it is.
For the non Forkers:
a) Forks measure extremes, cut swings in upper, lower extremes and show where the center is.
b) they project the most probable path of price.
The A-Point was the old high.
The B-Point was the lowest low.
The C-Point is, where we had the last low, after the High was breached. So, in essence, it's a very stretched Pullback-Fork.
2. The slanted grey lines:
They just bring the natural Swings to light, and project them into the future. That's it.
I'm not going into the the minor drawings here, since they are self explaining. Just give yourself a little bit time, watch the Chart from a distance, and let your thoughts flow.
Any trades here?
Let's observe and trade from one extreme to the Center and beyond...
