HIMS WEEKLY TRADE IDEA (7/29/25)*
**💊 HIMS WEEKLY TRADE IDEA (7/29/25)**
**🔥 Bullish Flow + Rising RSI + Institutional Volume**
**📈 Trade Setup**
• **Stock**: \ NYSE:HIMS
• **Direction**: CALL (LONG)
• **Strike**: \$64.00
• **Entry**: \$0.92
• **Target**: \$1.38
• **Stop**: \$0.46
• **Size**: 2 contracts
• **Expiry**: Aug 1, 2025 (3DTE)
• **Confidence**: 80%
• **Entry Timing**: Market Open
---
**🧠 Why This Trade?**
✅ **Call/Put Ratio = 1.37** → Bullish sentiment
✅ **RSI Daily: 65.2 / Weekly: 61.3** → Momentum building
✅ **1.8x Weekly Volume Surge** → Institutional accumulation
✅ **\$64C OI = 2,616** → High liquidity + interest
⚠️ **Gamma Risk + Fast Decay** → Time-sensitive play
---
**🎯 Strategy**
→ Play the momentum spike into expiry
→ Exit quickly on profit target or 50% stop
**#OptionsTrading #HIMS #SwingTrade #EarningsPlay #TradingViewSetup #FlowTrade**
Himslong

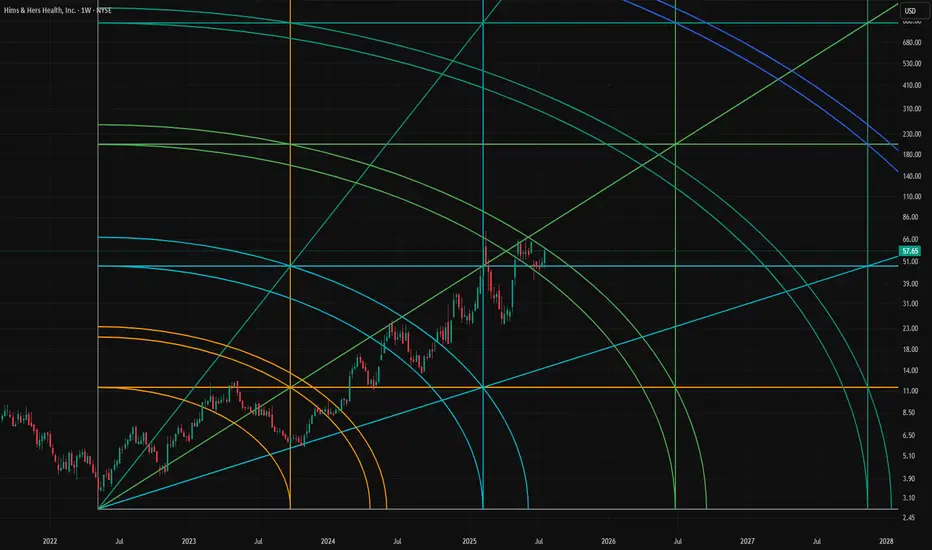
$HIMS gann arc if the arc breaks we gravitate up to the next one. This combined with a cup and handle!
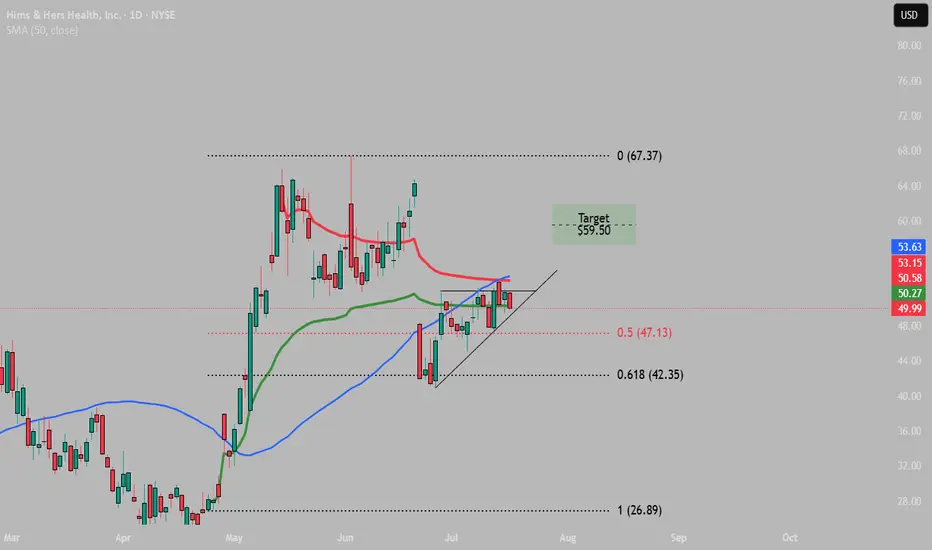
$HIMS Squeeze Time Frame: 1D
RSI : Neutral
MACD: Bullish Cross
Fib Levels: Retraced back to 61.8%
Target:
$59.50
Pattern invalidated of drop below 61.8% ($42.35) Fib level.
HIMS WEEKLY BULLISH PLAY — 07/23/2025
🩺 HIMS WEEKLY BULLISH PLAY — 07/23/2025
📈 Momentum Up, Flow Bullish, Time Tight — Let’s Ride It
⸻
🔍 MARKET SNAPSHOT
5-model AI consensus = ✅ BULLISH
Why?
• 📈 Weekly RSI = 58.2 (Rising) — Clear momentum
• ⚖️ Call/Put Ratio = 1.63 — Big call volume (45K+)
• 📉 Volume = 0.9x — ⚠️ Slight institutional hesitation
• 🌪️ VIX = 16.0 — Low volatility = smoother execution
⸻
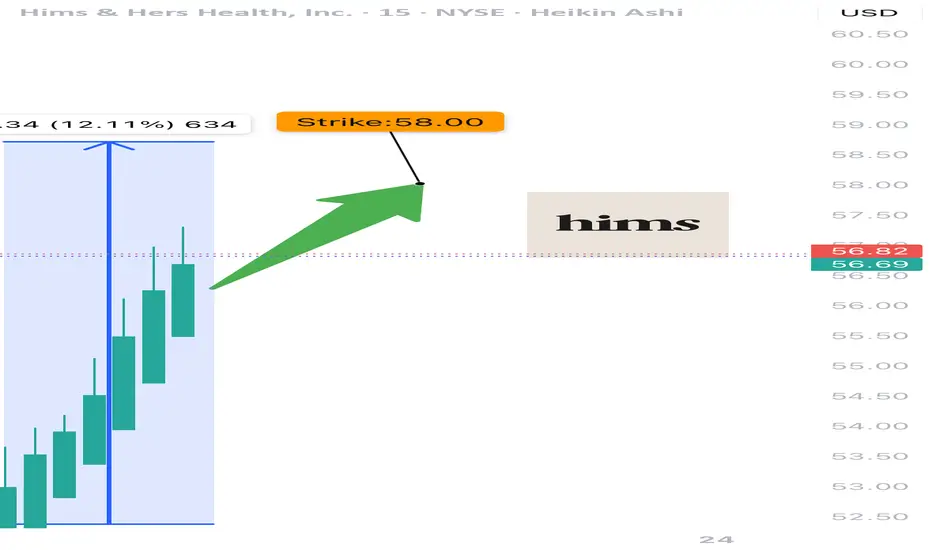
🎯 TRADE IDEA — CALL OPTION PLAY
{
"instrument": "HIMS",
"direction": "CALL",
"strike": 58.00,
"entry_price": 0.86,
"profit_target": 1.72,
"stop_loss": 0.43,
"expiry": "2025-07-25",
"confidence": 75%,
"entry_timing": "Open",
"size": 1 contract
}
⸻
📊 TRADE PLAN
🔹 🔸
🎯 Strike 58 CALL
💵 Entry 0.86
🎯 Profit Target 1.72 (+100%)
🛑 Stop Loss 0.43 (tight risk)
📅 Expiry July 25 (2DTE)
⚡ Confidence 75%
📈 Size Suggestion Risk 2–3% of capital
⚠️ Key Risks Low volume + high gamma exposure
⸻
🧠 MODEL TAKEAWAYS
✅ RSI and momentum are clearly aligned upward
✅ Call flow = bullish commitment
⚠️ Volume is light → watch for momentum stalls
⚠️ Gamma risk = manage tight, exit fast
⸻
💬 Drop a 🧠 if you’re tracking
📈 Drop a 💥 if you’re in this call
🛎️ Trade tight — expiration Friday, HIMS is moving on momentum not mass
#HIMS #OptionsTrading #CallOptions #BullishPlay #MomentumTrade #ZeroDTE #GammaScalp #AITrading #HealthcareStocks
$HIMS setting up for its next big move—here’s what I’m watching!🔥 NYSE:HIMS setting up for its next big move—here’s what I’m watching! 🔥
📉 Eyeing momentum down to $44-$48, and I’m not mad about it!
🔄 That flip from resistance to support is key for long-term price growth.
🚀 Bull flag breakout could come sooner—stay locked in! Keeping an eye on it all for the next trade entry on this beast!
💬 What’s your take? Are we bouncing or breaking out? Drop your thoughts below! ⬇️

$HIMS is in a livermore pattern This Livermore pattern is playing out great. 1.618 will be big resistance tho

$HIMS is HIMS! 80% Upside AheadNYSE:HIMS is HIMS! 80% Upside Ahead
Demolished earnings and I have this name at a fair value of $76 per share based on HIMS 2030 $6.5B Rev. Guidance.
Also, H5_L Indicator is about to cross bullish while the Wr% is rising and swinging from green to red!
Profit Targets:
- $50
- $60
- ATHs!
Before EOY!
Not financial Advice

Where is $HIMS going next? Massive upsideWhere is NYSE:HIMS going next? Massive upside
Watch now to find out!
Not financial advice

HIMS - The Full MonthyNo, no weed involved in this analysis.
As I said before, sometimes chart analysis is simple. But sometimes we need to extend it, combining all our knowledge to find the facts.
Let's see what we have here:
1. The white Fork.
...it's crazy, isn't it? ;-)
It looks like I was looking to fit it somehow.
But the truth can't be farther away. If you understand the principles behind this tool, WHAT it really measures, and what INFORMATION it really provides, then you get it, why this Fork is drawn like it is.
For the non Forkers:
a) Forks measure extremes, cut swings in upper, lower extremes and show where the center is.
b) they project the most probable path of price.
The A-Point was the old high.
The B-Point was the lowest low.
The C-Point is, where we had the last low, after the High was breached. So, in essence, it's a very stretched Pullback-Fork.
2. The slanted grey lines:
They just bring the natural Swings to light, and project them into the future. That's it.
I'm not going into the the minor drawings here, since they are self explaining. Just give yourself a little bit time, watch the Chart from a distance, and let your thoughts flow.
Any trades here?
Let's observe and trade from one extreme to the Center and beyond...
